200 Burnett Ave #105 · Morgan Hill, CA
Flood risk 1/10 · Minimal
- FEMA flood zone
- X (shaded)
- Chance of flooding over 30 yrs
- 0.0%
- Est. flood insurance / yr
- $507 – $1,088
Fire risk 7/10 · Major
- Est. fire insurance / yr
- $659 – $1,223
Heat risk 4/10 · Minor
- Hot days now (above 96°F)
- 7 days/yr
- Hot days in 30 yrs
- 14 days/yr
Wind risk 1/10 · Minimal
- Chance of severe wind over 30 yrs
- —
Air-quality risk 8/10 · Major
- Unhealthy air days now
- 17 days/yr
- Unhealthy air days in 30 yrs
- 17 days/yr
Risk factors via First Street. Map © Google.
Why this score? — see what drove the C- grade
The composite is a weighted blend of 9 inputs, each scored 0–100. Each bar is that input's sub-score; the figure is the points it added to the 100-point composite (weight × sub-score).
- Cash flow +18.0/30.0
- Schools +8.1/10.0
- ARV discount +7.5/15.0
- DSCR +5.6/10.0
- 1% rule +4.8/10.0
- Livability +4.1/5.0
- Rent growth +3.9/5.0
- Condition / age +2.5/5.0
- Appreciation +0.0/10.0
$315,000
🖨 Deal sheet 📄 Offer letter ✓ Due diligence
Listing remarks MLS
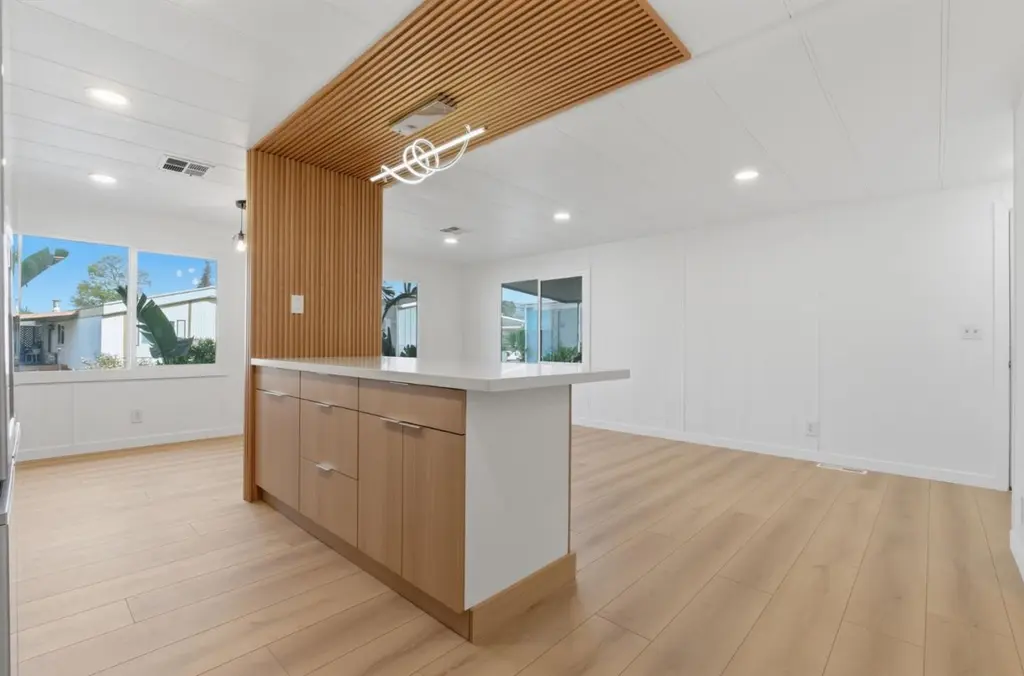
Located in an all-age community, this move-in-ready manufactured home in Morgan Hill offers an excellent and affordable opportunity with low space rent of just $740. Recently remodeled, the home features 2 bedrooms, 1 bathroom, plus a convenient bonus bathroom. Enjoy a spacious backyard filled with mature fruit treesperfect for relaxing, gardening, or entertaining.
Key facts
- Recent remodeling
- Mature fruit trees
- Spacious backyard
Tags
Neighborhood map
What this means for you Summary
Snapshot
- This is a 2-bed/2.0-bath manufactured listed at $315k.
Deal economics
- At list price, monthly cash flow is $269 ($3k/yr) — positive.
- The deal already cash-flows at list — no discount required.
- To meet the 1% rule (rent ≥ 1% of price), the offer needs to be $310k (1.7% below list).
- Recommended offer: $310k (1.7% below list) — sets the bar for 1% rule.
- Cap rate 7.3% vs local median 1.7% in Morgan Hill — top-decile yield for the area; either an underpriced asset or a hidden risk that comps aren't pricing in. Stress-test before assuming the spread holds.
Location & tenants
- Location reads 82/100 on livability (#34 in CA, #1,188 nationally) — a professional / high-income tenant draw. Strengths: amenities A+, commute A+, employment A+; Watch: schools C-, cost of living F.
- Morgan Hill Unified (suburban): math 90% / reading 90% proficiency, ranked #9 of 517 in CA (top 2%) — strong family-tenant draw, lease renewals of 3-5y typical.
- Market conditions: Rents rising fast (+5.8%/yr); 231 active listings in the ZIP; 2 comparable units currently listed for rent nearby; high-income renter base; 3,838 units permitted in Santa Clara County in 2024 (1,886 in 5+ unit buildings).
Forward outlook
- Local home prices are declining (-3.0%/yr); year-one equity from $2k of loan paydown is wiped out by about $9k of value loss. Plan a longer hold.
- Santa Clara County population projected at +24% by 2050 — long-run rental-demand tailwind backs the buy-and-hold thesis.
Negotiation context
- Only 11 days on market — expect competitive offers; lowballing is unlikely to land.
- 6 sale attempts since 22y ago with the ask held roughly flat each time — persistent listings suggest the price (not the market) is what's stuck; bring a comps-based counter.
- Current owner paid $243k; 30% above their basis — modest negotiation headroom, anchor on the comps not their cost.
Risks & watch-outs
- Climate carrying-cost: major wildfire risk — expect insurance premiums to compound above CPI over the hold.
Questions for the listing agent
- Built in 1972 — when were the roof, HVAC, electrical panel, plumbing, and water heater last replaced?
- Is there a deadline driving the sale (1031 exchange, divorce, estate, relocation)? That informs how much negotiation room exists.
- What's the average days-on-market for RENTAL listings here right now (not sales)? A rising rental-DOM trend means longer vacancies and softer asking-rent achievability than the comps imply.
- What's the recent tenant-quality profile in this submarket — average credit score on applications, eviction rate, late-payment / NSF rate, and stable-employment percentage? A property-management company in the area should have these aggregated.
- How much new for-sale + rental construction is in the pipeline within 1–3 miles? Heavy new supply typically softens prices + rents 12–24 months out; constrained supply supports both.
Investment metrics
- 1% rule
- 0.98% ✗
- Cap rate
- 7.32%
- Cash-on-cash
- 3.67%
- DSCR
- 1.16
- GRM
- 8.5
CMA / ARV
No comps found within radius.
Projected returns pro-forma
-3.0% appreciation · 5.79% rent growth · sell at horizon
- IRR
- -7.4%
- Equity multiple
- 0.72×
- Total profit
- $-24,901
- Equity at exit
- $46,968
- IRR
- 5.4%
- Equity multiple
- 1.45×
- Total profit
- $39,430
- Equity at exit
- $27,235
Cash invested: $88,200 (down + closing). Projections, not guarantees.
Landlord ↔ Tenant lean methodology
- Overall (STATE)
- 18 Strongly Tenant-Friendly
- State California
- 18 Strongly Tenant-Friendly · D+13
- County
- — inherits STATE
- City
- — inherits STATE
ZIP-level market 95037
- Rents YoY
- 5.8%
- Active inventory
- 231
- Price-to-rent
- 8.5×
Monthly cashflow live
- Estimated rent
- $3,097 medium interval (Pro) →
- Mortgage (P&I)
- −$1,652
- Tax est. 1.5%
- −$394 /mo · $4,725/yr
- Insurance
- −$131
- HOA
- −$0
- Vacancy / Maint / Mgmt
- −$650
- Net cashflow
- $269
Break-even live
UW: 25.0% down · 7.5% · 30yr · 1.5% tax · 5.0% vac · 8.0% maint · 8.0% mgmt
Financing live
Cash to close
- Down payment
- $78,750
- Closing costs
- $9,450
- Reserves months
- —
- Total cash needed
- —
Loan-product check · same deal, 3 products live
Conventional
25% down · 7.5% · 30yr
- Down + closing
- —
- Monthly P&I
- —
- Monthly cashflow
- —
- DSCR
- —
- Eligible?
- —
Personal DTI + credit; lowest rate.
DSCR
20% down · 8.5% · 30yr
- Down + closing
- —
- Monthly P&I
- —
- Monthly cashflow
- —
- DSCR
- —
- Eligible?
- —
No personal income docs; deal must DSCR.
Hard money
10% down · 12.0% · 12mo
- Down + closing
- —
- Monthly P&I
- —
- Monthly cashflow
- —
- DSCR
- —
- Eligible?
- —
Short-term bridge; refi at stabilization.
Rent comps 2 comps
| Address | Beds | Baths | Sqft | Rent | $/sqft | DOM | Units | Dist |
|---|---|---|---|---|---|---|---|---|
| 19010 Monterey Rd Morgan Hill, CA | 2.0 | 1.0 | 800 | $2,495 | $3.12 | 23d | 1 | 0.39mi |
| 18730 Miner Ln Morgan Hill, CA | 1.0–2.0 | 1.0 | 707 | $2,664 | $3.77 | 1d | 3 | 0.47mi |
Listing history 20 events
-
2026-06-09days on market $315,000 Active 11 DOM
-
2026-06-08days on market $315,000 Active 10 DOM
-
2026-06-07days on market $315,000 Active 9 DOM
-
2026-06-05pricestatusdays on market $315,000 Active 6 DOM
-
2026-04-28status Pending 367-char remark
Show marketing remark (367 chars)
Located in an all-age community, this move-in-ready manufactured home in Morgan Hill offers an excellent and affordable opportunity with low space rent of just $740. Recently remodeled, the home features 2 bedrooms, 1 bathroom, plus a convenient bonus bathroom. Enjoy a spacious backyard filled with mature fruit treesperfect for relaxing, gardening, or entertaining.
-
2026-04-28status Pending (Do Not Show) 367-char remark
Show marketing remark (367 chars)
Located in an all-age community, this move-in-ready manufactured home in Morgan Hill offers an excellent and affordable opportunity with low space rent of just $740. Recently remodeled, the home features 2 bedrooms, 1 bathroom, plus a convenient bonus bathroom. Enjoy a spacious backyard filled with mature fruit treesperfect for relaxing, gardening, or entertaining.
-
2026-04-23$312,000 Active 367-char remark
Show marketing remark (367 chars)
Located in an all-age community, this move-in-ready manufactured home in Morgan Hill offers an excellent and affordable opportunity with low space rent of just $740. Recently remodeled, the home features 2 bedrooms, 1 bathroom, plus a convenient bonus bathroom. Enjoy a spacious backyard filled with mature fruit treesperfect for relaxing, gardening, or entertaining.
-
2023-06-08soldstatus $243,000 Sold
-
2023-05-05status Pending (Do Not Show)
-
2023-04-20$249,000 Active
-
2022-06-29soldstatus $208,000 Sold
-
2022-05-07historical Contingent
-
2022-04-29$199,500 Active
-
2007-09-01soldstatus $62,500
-
2007-08-11historical
-
2006-07-15$67,999
-
2004-11-23historical
-
2004-11-08soldstatus $51,000
-
2004-09-10$55,000
ⓘ Source: listings_history table (triggers on properties + properties_extension) + one-shot
backfill from property_details.listing_events for pre-trigger history.
Climate risk First Street
- Flood 1/10 Low FEMA zone X (shaded) · 0% chance over 30 yrs
- Wildfire 7/10 Severe
- Heat 4/10 Moderate 7 d/yr ≥96°F today · 14 d/yr by 30 yrs out
- Wind 1/10 Low
- Air quality 8/10 Severe 17 unhealthy d/yr today · 17 by 30 yrs out
Nearby sold comps map
Loading sold comps map…
Walkable amenities ~0.75 mi
Loading nearby amenities…
Taxation est. · year 1
- Rental income
- $37,159
- − Mortgage interest
- −$17,645
- − Property taxes
- −$4,725
- − Insurance
- −$1,575
- − Repairs & maintenance
- −$2,973
- − Management
- −$2,973
- − Depreciation
- −$9,164
- Taxable loss
- −$1,895
- Est. tax savings @ 24.0%
- +$455
- After-tax cash flow
- $3,688/yr
For passive investors: Depreciation is non-cash, so a rental often shows a tax loss while cash-flowing — sheltering income. Rental losses are passive: they offset passive income freely, and up to $25,000/yr can offset ordinary (W-2) income if you actively participate and your MAGI is under $100k (phasing out to $0 by $150k); unused losses carry forward. On sale, claimed depreciation is recaptured at up to 25%, and gains may owe capital-gains tax (a 1031 exchange can defer both). Figures are a year-1 estimate at your 24.0% rate — not tax advice; consult a CPA.
Schools (NCES district)
- District
- Morgan Hill Unified
- NCES district ID
- 0625830
- Math proficiency
- 90% ▲ 51.00%
- Reading proficiency
- 90% ▲ 41.00%
- Median HH income
- $99,633
- Composite
- 80.7/100
- National rank
- #45
- State rank
- #9 of 517 in CA
Livability — Morgan Hill
- Score
- 82/100
- State rank
- #34
- US rank
- #1188
Category grades
Schools grade is shown separately in the Schools card above.
Census & demographics
- Census place
- Morgan Hill, CA
- County
- Santa Clara County · 1,806,974 people
- City population
- 51,943
- Metro
- San Jose-Sunnyvale-Santa Clara, CA
- Population (ZIP)
- 51,943
- Household income
- $163,182
- Rent vs Own
- Severe rent burden
- 1261.0
Population outlook (Santa Clara County) Hauer SSP2
- Today (2025)
- 2,179,074 people
- By 2030
- 2,301,297 · +5.6%
- By 2040
- 2,528,195 · +16.0%
- By 2050
- 2,712,135 · +24.5%
- By 2075
- 2,998,701 · +37.6%
- By 2100
- 2,931,429 · +34.5%
Race, ethnicity, and origin ACS 2023
- Neighborhood character
- Diverse neighborhood (Simpson 0.68)
- Race & ethnicity
- White 40% Hispanic / Latino 36% Two or more races 24% Asian 16% Black 2%
- Hispanic origin (detail)
- Mexican 31%
- Common ancestry
- Russian 2% Slovak 2% Italian 2%
- Foreign-born
- 22% · Canada, Vietnam, China
- Languages at home
- 65% English-only · Spanish 20% Other Indo-European 3% Chinese 3%
Political lean MEDSL · Santa Clara
- 2024 margin
- Solid D (+40.0) · D 68.1% · R 28.1% · Other 3.8%
- 2008→2024 swing
- -0.9pp no change · 2008: 40.9pp · 2024: 40.0pp
- All cycles
- 2024: D+40.0 2020: D+47.4 2016: D+52.5 2012: D+42.1 2008: D+40.9
Not yet ingested
- Civics
- —
Market trends
- HPI YoY
- ▼ -927.23%
- Current HPI
- 279.0096
- Rent YoY
- ▲ 5.79%
- Metro
- San Jose-Sunnyvale-Santa Clara, CA
- State GDP YoY
- ▲ 3.21%
- F500 in state
- 116
Industry mix (Fortune 500 HQ in CA)
| Industry | F500 HQs | Revenue |
|---|---|---|
| Technology | 27 | $1,492B |
|
||
| Financial Services | 3 | $174B |
|
||
| Retail | 3 | $44B |
|
||
| Insurance | 3 | $26B |
|
||
| Media / Entertainment | 2 | $115B |
|
||
| Pharmaceuticals / Biotech | 2 | $62B |
|
||
Price history
+467.3% since first listed16 events — show timeline
- 2026-04-28 Pending — bridgeMLS, Bay East AOR, or Contra Costa AOR
- 2026-04-28 Pending — MLSListings
- 2026-04-23 Listed $312,000 MLSListings
- 2026-04-23 Listed $312,000 bridgeMLS, Bay East AOR, or Contra Costa AOR
- 2023-06-08 Sold (MLS) $243,000 MLSListings
- 2023-05-05 Pending — MLSListings
- 2023-04-20 Listed $249,000 MLSListings
- 2022-06-29 Sold (MLS) $208,000 MLSListings
- 2022-05-07 Contingent — MLSListings
- 2022-04-29 Listed $199,500 MLSListings
- 2007-09-01 Sold (MLS) $62,500 MLSListings
- 2007-08-11 Listing Removed — MLSListings
- 2006-07-15 Listed $67,999 MLSListings
- 2004-11-23 Listing Removed — MLSListings
- 2004-11-08 Sold (MLS) $51,000 MLSListings
- 2004-09-10 Listed $55,000 MLSListings
Cash-flow waterfall
monthlySold comps — $/sqft
last 12 mo · ≤1 miLoading sold comps…