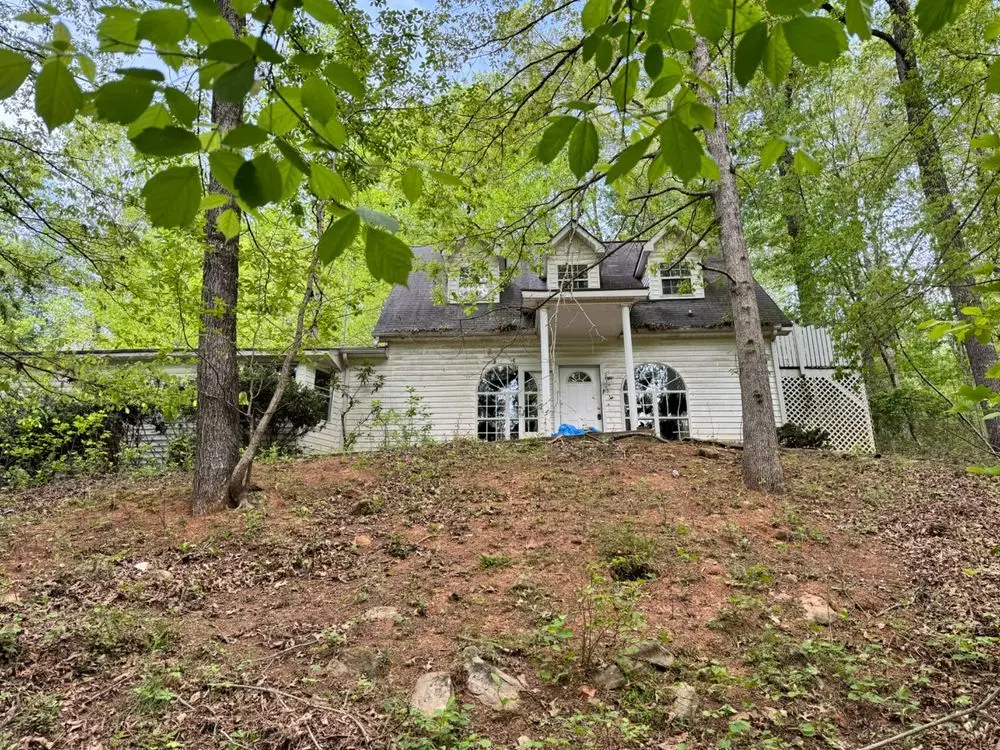
209 Whitewater Rd · Demorest, GA
Flood risk 1/10 · Minimal
- FEMA flood zone
- X (unshaded)
- Chance of flooding over 30 yrs
- 0.0%
- Est. flood insurance / yr
- $507 – $1,088
Fire risk 4/10 · Minor
- Est. fire insurance / yr
- $963 – $1,789
Heat risk 4/10 · Minor
- Hot days now (above 100°F)
- 7 days/yr
- Hot days in 30 yrs
- 18 days/yr
Wind risk 2/10 · Minimal
- Chance of severe wind over 30 yrs
- 2.0%
Air-quality risk 4/10 · Minor
- Unhealthy air days now
- 4 days/yr
- Unhealthy air days in 30 yrs
- 7 days/yr
Risk factors via First Street. Map © Google.
Why this score? — see what drove the B grade
The composite is a weighted blend of 9 inputs, each scored 0–100. Each bar is that input's sub-score; the figure is the points it added to the 100-point composite (weight × sub-score).
- Cash flow +28.8/30.0
- ARV discount +15.0/15.0
- DSCR +10.0/10.0
- 1% rule +7.8/10.0
- Livability +3.4/5.0
- Schools +3.2/10.0
- Rent growth +2.5/5.0
- Condition / age +2.5/5.0
- Appreciation +0.0/10.0
$195,000
🖨 Deal sheet 📄 Offer letter ✓ Due diligence
Listing remarks
Investors, cute 2 bedroom house on 2 acres. Near Chatahoochee River. No power has been turned on, no water (city water is option) well?
Key facts
- 2 acres
- Chatahoochee river
- 2 acre lot
Tags
Property features AI
Exterior
- Home design: House
- Construction: 1,528 square feet of living space
- Exterior features: 2-acre lot
Neighborhood map
What this means for you Summary
Snapshot
- This is a 2-bed/2.0-bath single-family listed at $195k.
Deal economics
- At list price, monthly cash flow is $655 ($8k/yr) — positive.
- The deal already cash-flows at list — no discount required.
- Meets the 1% rule at list price ($2k rent vs $195k).
- Recommended offer: $192k (1.5% below list) — sets the bar for market timing.
- Cap rate 10.3% vs local median 2.8% in Demorest — top-decile yield for the area; either an underpriced asset or a hidden risk that comps aren't pricing in. Stress-test before assuming the spread holds.
Location & tenants
- Location reads 67/100 on livability (#162 in GA) — a middle-class / working-renter tenant base. Strengths: crime A+, cost of living A+, housing A; Watch: employment C-, schools D+, amenities F.
- Habersham County (rural): math 38% / reading 39% proficiency, ranked #53 of 174 in GA (top 30%) — families likely to look elsewhere, expect single-tenant / working-renter base with shorter leases.
- Market conditions: 110 active listings in the ZIP; 1 comparable units currently listed for rent nearby; 215 units permitted in Habersham County in 2024 (5 in 5+ unit buildings).
Forward outlook
- Local home prices are declining (-3.0%/yr); year-one equity from $1k of loan paydown is wiped out by about $6k of value loss. Plan a longer hold.
- Habersham County population projected at +8% by 2050 — modest demand growth; plan on rents tracking national, not racing it.
- At projected returns (-3.0% appreciation + 3.0% rent growth), your $55k cash investment doubles in ~9 years — after that, you're playing with house money.
Negotiation context
- It's been on market 15 days — a 2% lower offer ($192k) is reasonable based on typical stale-listing flexibility.
Questions for the listing agent
- Is there a deadline driving the sale (1031 exchange, divorce, estate, relocation)? That informs how much negotiation room exists.
- Schools are D-rated, which usually means shorter tenancies and higher turnover. Who's the typical renter profile here, and what's been the actual vacancy rate?
- What's the average days-on-market for RENTAL listings here right now (not sales)? A rising rental-DOM trend means longer vacancies and softer asking-rent achievability than the comps imply.
- What's the recent tenant-quality profile in this submarket — average credit score on applications, eviction rate, late-payment / NSF rate, and stable-employment percentage? A property-management company in the area should have these aggregated.
- How much new for-sale + rental construction is in the pipeline within 1–3 miles? Heavy new supply typically softens prices + rents 12–24 months out; constrained supply supports both.
Investment metrics
- 1% rule
- 1.28% ✓
- Cap rate
- 10.32%
- Cash-on-cash
- 14.40%
- DSCR
- 1.64
- GRM
- 6.5
CMA / ARV
- ARV (on-the-fly)
- $292,988
- Comps found
- 5
Show comp detail 5 sales within ~0.75 mi
| Address | Dist | Beds/Ba | Sqft | Sold | Price | $/sf | Match |
|---|---|---|---|---|---|---|---|
| 205 Whitewater Rd | 0.06mi | 3/2.0 (+1) | 1,732 (+5%) | 20mo | $199,000 | $115 | 67 |
| 332 Mineral Springs Trl | 0.62mi | 3/2.0 (+1) | 1,530 (-7%) | 5mo | $280,000 | $183 | 50 |
| 564 Papa Coon Ln | 0.41mi | 3/2.0 (+1) | 1,483 (-10%) | 14mo | $263,420 | $178 | 48 |
| 298 Mineral Springs Connector | 0.62mi | 3/2.0 (+1) | 1,474 (-10%) | 13mo | $247,500 | $168 | 37 |
| 352 Mineral Springs Trl | 0.62mi | 3/2.0 (+1) | 1,483 (-10%) | 24mo | $285,000 | $192 | 30 |
Match score weights: distance 35% · size 25% · config 20% · recency 20%. Top-matched comps best support the ARV.
Projected returns pro-forma
-3.0% appreciation · 3.0% rent growth · sell at horizon
- IRR
- 4.8%
- Equity multiple
- 1.19×
- Total profit
- $10,147
- Equity at exit
- $29,075
- IRR
- 14.3%
- Equity multiple
- 2.15×
- Total profit
- $62,646
- Equity at exit
- $16,860
Cash invested: $54,600 (down + closing). Projections, not guarantees.
Landlord ↔ Tenant lean methodology
- Overall (STATE)
- 90 Strongly Landlord-Friendly
- State Georgia
- 90 Strongly Landlord-Friendly · R+3
- County
- — inherits STATE
- City
- — inherits STATE
ZIP-level market 30535
- Home prices YoY
- -10.7%
- Active inventory
- 110
- Price-to-rent
- 6.5×
Monthly cashflow live
- Estimated rent
- $2,500 medium interval (Pro) →
- Mortgage (P&I)
- −$1,023
- Tax from tax record
- −$216 /mo · $2,592/yr
- Insurance
- −$81
- HOA
- −$0
- Vacancy / Maint / Mgmt
- −$525
- Net cashflow
- $655
Break-even live
UW: 25.0% down · 7.5% · 30yr · 1.5% tax · 5.0% vac · 8.0% maint · 8.0% mgmt
Financing live
Cash to close
- Down payment
- $48,750
- Closing costs
- $5,850
- Reserves months
- —
- Total cash needed
- —
Loan-product check · same deal, 3 products live
Conventional
25% down · 7.5% · 30yr
- Down + closing
- —
- Monthly P&I
- —
- Monthly cashflow
- —
- DSCR
- —
- Eligible?
- —
Personal DTI + credit; lowest rate.
DSCR
20% down · 8.5% · 30yr
- Down + closing
- —
- Monthly P&I
- —
- Monthly cashflow
- —
- DSCR
- —
- Eligible?
- —
No personal income docs; deal must DSCR.
Hard money
10% down · 12.0% · 12mo
- Down + closing
- —
- Monthly P&I
- —
- Monthly cashflow
- —
- DSCR
- —
- Eligible?
- —
Short-term bridge; refi at stabilization.
Rent comps 1 comps
| Address | Beds | Baths | Sqft | Rent | $/sqft | DOM | Units | Dist |
|---|---|---|---|---|---|---|---|---|
| 266 Peaceful Waters Cir Demorest, GA | 2.0 | 1.0 | 1096 | $2,500 | $2.28 | 43d | 1 | 1.47mi |
Listing history 12 events
-
2026-06-19days on market $195,000 Active 15 DOM
-
2026-06-18days on market $195,000 Active 14 DOM
-
2026-06-17days on market $195,000 Active 13 DOM
-
2026-06-16days on market $195,000 Active 12 DOM
-
2026-06-15days on market $195,000 Active 11 DOM
-
2026-06-14days on market $195,000 Active 9 DOM
-
2026-06-12days on market $195,000 Active 8 DOM
-
2026-06-09days on market $195,000 Active 5 DOM
-
2026-06-08days on market $195,000 Active 4 DOM
-
2026-06-07days on market $195,000 Active 3 DOM
-
2026-06-07remarks 135-char remark
-
2026-06-07$195,000 Active 2 DOM
ⓘ Source: listings_history table (triggers on properties + properties_extension) + one-shot
backfill from property_details.listing_events for pre-trigger history.
Tax reassessment forecast GA · Resets to sale price
- Current annual tax
- $2,592 · $216/mo
- Projected year-2 tax
- $2,592 · $216/mo
- Expected delta
- $0/yr ($0/mo · 0.0%)
ⓘ Screening estimate from a state-policy table — verify with the county assessor before closing.
Climate risk First Street
- Flood 1/10 Low FEMA zone X (unshaded) · 0% chance over 30 yrs
- Wildfire 4/10 Moderate
- Heat 4/10 Moderate 7 d/yr ≥100°F today · 18 d/yr by 30 yrs out
- Wind 2/10 Low 2% chance of damaging wind over 30 yrs
- Air quality 4/10 Moderate 4 unhealthy d/yr today · 7 by 30 yrs out
Nearby sold comps map
Loading sold comps map…
Walkable amenities ~0.75 mi
Loading nearby amenities…
Taxation est. · year 1
- Rental income
- $30,000
- − Mortgage interest
- −$10,923
- − Property taxes
- −$2,592
- − Insurance
- −$975
- − Repairs & maintenance
- −$2,400
- − Management
- −$2,400
- − Depreciation
- −$5,673
- Taxable income
- $5,037
- Est. tax owed @ 24.0%
- −$1,209
- After-tax cash flow
- $6,652/yr
For passive investors: Depreciation is non-cash, so a rental often shows a tax loss while cash-flowing — sheltering income. Rental losses are passive: they offset passive income freely, and up to $25,000/yr can offset ordinary (W-2) income if you actively participate and your MAGI is under $100k (phasing out to $0 by $150k); unused losses carry forward. On sale, claimed depreciation is recaptured at up to 25%, and gains may owe capital-gains tax (a 1031 exchange can defer both). Figures are a year-1 estimate at your 24.0% rate — not tax advice; consult a CPA.
Schools (NCES district)
- District
- Habersham County
- NCES district ID
- 1302580
- Math proficiency
- 38% ▼ -16.00%
- Reading proficiency
- 39% ▼ -8.00%
- Median HH income
- $41,838
- Composite
- 32.48/100
- National rank
- #5709
- State rank
- #53 of 174 in GA
Livability — Demorest
- Score
- 67/100
- State rank
- #162
- US rank
- #10338
Category grades
Schools grade is shown separately in the Schools card above.
Census & demographics
- Population (ZIP)
- 8,755
Population outlook (Habersham County) Hauer SSP2
- Today (2025)
- 45,697 people
- By 2030
- 46,571 · +1.9%
- By 2040
- 48,157 · +5.4%
- By 2050
- 49,492 · +8.3%
- By 2075
- 52,546 · +15.0%
- By 2100
- 52,752 · +15.4%
Race, ethnicity, and origin ACS 2023
- Neighborhood character
- Predominantly White (87%)
- Race & ethnicity
- White 87% Two or more races 6% Hispanic / Latino 5% Black 4%
- Hispanic origin (detail)
- Mexican 4%
- Common ancestry
- Serbian 2% Slovak 2% Italian 2%
- Foreign-born
- 3% · Canada
- Languages at home
- 96% English-only · Spanish 3%
Political lean MEDSL · Habersham
- 2024 margin
- Solid R (+64.9) · D 17.3% · R 82.2%
- 2008→2024 swing
- -5.0pp toward R · 2008: -59.9pp · 2024: -64.9pp
- All cycles
- 2024: R+64.9 2020: R+64.0 2016: R+66.3 2012: R+67.5 2008: R+59.9
Not yet ingested
- Civics
- —
Market trends
- HPI YoY
- ▼ -29.84%
- Current HPI
- 248.1602
- Rent YoY
- —
- Metro
- —
- State GDP YoY
- ▲ 2.66%
- F500 in state
- 28
Industry mix (Fortune 500 HQ in GA)
| Industry | F500 HQs | Revenue |
|---|---|---|
| Paper / Packaging | 2 | $29B |
|
||
| Retail | 1 | $160B |
|
||
| Transportation / Logistics | 1 | $91B |
|
||
| Airlines | 1 | $62B |
|
||
| Consumer Goods | 1 | $47B |
|
||
| Utilities | 1 | $25B |
|
||
Price history
1 event — show timeline
- 2026-06-04 Listed $195,000 ForSaleByOwner.com
Property tax history
+11.1%/yrLatest (2025): $2,592 · +12.3% YoY. Source: county tax records.
Cash-flow waterfall
monthlySold comps — $/sqft
last 12 mo · ≤1 miLoading sold comps…