 🏗️ New Construction
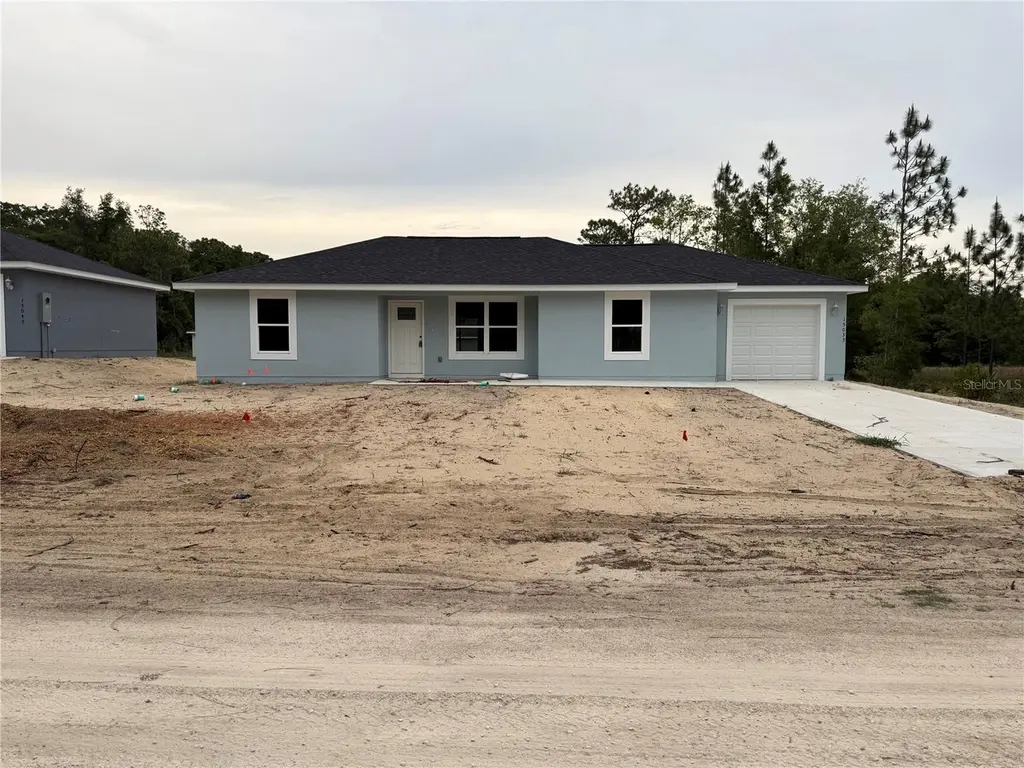
15033 SW 26th Ln · Rainbow Park, FL
Flood risk No data
- FEMA flood zone
- —
- Chance of flooding over 30 yrs
- —
- Est. flood insurance / yr
- —
Fire risk No data
- Est. fire insurance / yr
- —
Heat risk No data
- Hot days now (above threshold)
- —
- Hot days in 30 yrs
- —
Wind risk No data
- Chance of severe wind over 30 yrs
- —
Air-quality risk No data
- Unhealthy air days now
- —
- Unhealthy air days in 30 yrs
- —
Risk factors via First Street. Map © Google.
Why this score? — see what drove the F grade
The composite is a weighted blend of 9 inputs, each scored 0–100. Each bar is that input's sub-score; the figure is the points it added to the 100-point composite (weight × sub-score).
- Cash flow +9.1/30.0
- ARV discount +7.5/15.0
- Schools +3.6/10.0
- 1% rule +2.8/10.0
- DSCR +2.5/10.0
- Rent growth +2.5/5.0
- Livability +2.5/5.0
- Condition / age +1.0/5.0
- Appreciation +0.0/10.0
$209,900
🖨 Deal sheet (PDF) 📄 Offer letter ✓ Due diligence
Listing remarks
Under Construction. Step into this spacious stucco home offering an affordable opportunity with a well-designed split floor plan. The home features a modern kitchen with granite countertops, upgraded cabinetry, and a full stainless steel appliance package including range, microwave, dishwasher, and refrigerator. Tile flooring runs throughout, complemented by ceiling fans and thoughtful finishes. Enjoy the beautiful lot with fresh sod and a peaceful setting. Conveniently located near Rainbow River and the World Equestrian Center, this property provides easy access to a wide range of outdoor activities and events in Marion County. Homestead or Investment great pick!
Key facts
- Ceiling fans
- Upgraded cabinetry
- Tile flooring
Tags
Property features AI
Finance
- Other: Zoned R1
- HOA & community: No association
Exterior
- Parking: Attached garage (1 car, approximately 12x20); Carport present
- Security: Smoke detector(s)
- Utilities: Well water; Septic tank; Electricity connected
- Home design: Single-family residence; Under construction (projected completion: 2026-06-15); One story; Faces south; Attached property
- Construction: Stucco and frame construction; Shingle roof; Slab foundation; New construction by Brooks Construction (model JC1)
- Exterior features: Sliding doors; Cleared corner lot; Located in county
Interior
- Kitchen: Dishwasher; Microwave; Range; Refrigerator
- Bedrooms: 3 bedrooms
- Flooring: Tile
- Bathrooms: 2 full bathrooms
- Heating & cooling: Heat pump heating; Central air conditioning
- Interior features: High ceilings; Split bedroom layout; Programmable thermostat; Walk-in closets; Inside utility room; Smoke detectors
- Laundry & utility: Laundry inside
Neighborhood map
What this means for you Summary
Snapshot
- This is a 3-bed/2.0-bath single-family listed at $210k. Condition is rated poor.
Deal economics
- At list price, monthly cash flow is $-180 ($-2k/yr) — negative.
- To cash-flow at today's rent, offer at most $207k (1.5% below list).
- To meet the 1% rule (rent ≥ 1% of price), the offer needs to be $181k (13.8% below list).
- Recommended offer: $181k (13.8% below list) — sets the bar for 1% rule.
Location & tenants
- Location reads: area grade F — affects rentability + tenant quality, not the cash-flow math above.
- Marion (rural): math 42% / reading 43% proficiency, ranked #61 of 73 in FL (top 84%) — families likely to look elsewhere, expect single-tenant / working-renter base with shorter leases; 61% free/reduced lunch — lower-income household profile, screen leases tightly.
- Zoned schools: Dunnellon Elementary School (math 46% / reading 48%, grade D-, #1,191 of 2,144 statewide, top 57%, 580 students, 61% FRL); Dunnellon Middle School (math 48% / reading 42%, grade D, #310 of 571 statewide, top 56%, 678 students, 68% FRL); Dunnellon High School (math 30% / reading 32%, grade F, #429 of 667 statewide, top 65%, 1,350 students, 63% FRL) — zoned schools at 64% FRL track the district average.
- Market conditions: 1161 active listings in the ZIP; 4 comparable units currently listed for rent nearby; rentals at typical pace (median 23d on market — plan ~3-4 weeks tenant-placement turnaround); 7,071 units permitted in Marion County in 2024 (534 in 5+ unit buildings).
- This rent runs 38% of the median local income ($57k/yr) — at the standard rent-burdened threshold; future hikes will face affordability resistance.
Forward outlook
- Local home prices are declining (-3.0%/yr); year-one equity from $2k of loan paydown is wiped out by about $7k of value loss. Plan a longer hold.
- Marion County population projected at +13% by 2050 — modest demand growth; plan on rents tracking national, not racing it.
Negotiation context
- Only 10 days on market — expect competitive offers; lowballing is unlikely to land.
Questions for the listing agent
- What do current leases actually rent for vs. the listed asking? Can we see a recent rent roll and the last 12 months of T-12 income?
- Have any recent inspections been done? Can we get a copy of the seller's disclosures and any deferred-maintenance estimates?
- Is there a deadline driving the sale (1031 exchange, divorce, estate, relocation)? That informs how much negotiation room exists.
- The area grade is low — what's the realistic commute time and amenity access for the typical tenant pool here? Any planned neighborhood developments (good or bad) we should know about?
- What's the average days-on-market for RENTAL listings here right now (not sales)? A rising rental-DOM trend means longer vacancies and softer asking-rent achievability than the comps imply.
- What's the recent tenant-quality profile in this submarket — average credit score on applications, eviction rate, late-payment / NSF rate, and stable-employment percentage? A property-management company in the area should have these aggregated.
- How much new for-sale + rental construction is in the pipeline within 1–3 miles? Heavy new supply typically softens prices + rents 12–24 months out; constrained supply supports both.
Investment metrics
- 1% rule
- 0.78% ✗
- Cap rate
- 5.36%
- Cash-on-cash
- -3.32%
- DSCR
- 0.85
- GRM
- 10.7
CMA / ARV
- ARV (on-the-fly)
- $232,848
- Comps found
- 12
Show comp detail 12 sales within ~0.75 mi
| Address | Dist | Beds/Ba | Sqft | Sold | Price | $/sf | Match |
|---|---|---|---|---|---|---|---|
| 14689 SW 30th Pl | 0.29mi | 3/2.0 | 1,232 (0%) | 8mo | $210,900 | $171 | 80 |
| 14663 SW 30th Pl | 0.29mi | 3/2.0 | 1,232 (0%) | 9mo | $205,900 | $167 | 79 |
| 3314 SW 144 Ct | 0.50mi | 3/2.0 | 1,211 (-2%) | 13mo | $235,000 | $194 | 63 |
| 14386 SW 26th Ln | 0.29mi | 3/2.0 | 1,127 (-8%) | 14mo | $225,000 | $200 | 61 |
| 15228 SW 16th St | 0.66mi | 3/2.0 | 1,267 (+3%) | 8mo | $237,900 | $188 | 57 |
| 2329 SW 143rd Ct | 0.33mi | 3/2.0 | 1,380 (+12%) | 12mo | $259,900 | $188 | 55 |
| 14346 SW 30th Pl | 0.45mi | 3/2.0 | 1,399 (+14%) | 4mo | $245,000 | $175 | 53 |
| 2388 SW 143rd Ct | 0.33mi | 3/2.0 | 1,058 (-14%) | 16mo | $199,900 | $189 | 48 |
| 14175 SW 30th Street Rd | 0.57mi | 3/2.0 | 1,127 (-8%) | 15mo | $215,000 | $191 | 46 |
| 15422 SW 30 St | 0.73mi | 3/2.0 | 1,089 (-12%) | 10mo | $224,000 | $206 | 38 |
| 14140 SW 19th Pl | 0.63mi | 3/2.0 | 1,399 (+14%) | 17mo | $239,900 | $171 | 34 |
| 3290 SW 151st Ave | 0.69mi | 3/2.0 | 1,066 (-14%) | 15mo | $212,995 | $200 | 33 |
Match score weights: distance 35% · size 25% · config 20% · recency 20%. Top-matched comps best support the ARV.
Projected returns pro-forma
-3.0% appreciation · 3.0% rent growth · sell at horizon
- IRR
- -21.8%
- Equity multiple
- 0.25×
- Total profit
- $-49,196
- Equity at exit
- $34,718
- IRR
- -15.6%
- Equity multiple
- 0.12×
- Total profit
- $-57,525
- Equity at exit
- $20,132
Cash invested: $65,197 (down + closing). Projections, not guarantees.
Landlord ↔ Tenant lean methodology
- Overall (STATE)
- 87 Strongly Landlord-Friendly
- State Florida
- 87 Strongly Landlord-Friendly · R+3
- County
- — inherits STATE
- City
- — inherits STATE
ZIP-level market 34481
- Home prices YoY
- -25.2%
- Active inventory
- 1161
- Price-to-rent
- 9.7×
Monthly cashflow live
- Estimated rent
- $1,809 medium interval (Pro) →
- Mortgage (P&I)
- −$1,221
- Tax est. 1.5%
- −$291 /mo · $3,493/yr
- Insurance
- −$97
- HOA
- −$0
- Vacancy / Maint / Mgmt
- −$380
- Net cashflow
- $-180
Break-even live
Sensitivity live
| Price | -10% $-20 | -5% $-100 | +0% $-180 | +5% $-261 | +10% $-341 |
|---|---|---|---|---|---|
| Rent | -10% $-323 | -5% $-252 | +0% $-180 | +5% $-109 | +10% $-38 |
| Rate | -1.0pp $-63 | -0.5pp $-121 | base $-180 | +0.5pp $-241 | +1.0pp $-302 |
UW: 25.0% down · 7.5% · 30yr · 1.5% tax · 5.0% vac · 8.0% maint · 8.0% mgmt
Financing live
Cash to close
- Down payment
- $58,212
- Closing costs
- $6,985
- Reserves months
- —
- Total cash needed
- —
Loan-product check · same deal, 3 products live
Conventional
25% down · 7.5% · 30yr
- Down + closing
- —
- Monthly P&I
- —
- Monthly cashflow
- —
- DSCR
- —
- Eligible?
- —
Personal DTI + credit; lowest rate.
DSCR
20% down · 8.5% · 30yr
- Down + closing
- —
- Monthly P&I
- —
- Monthly cashflow
- —
- DSCR
- —
- Eligible?
- —
No personal income docs; deal must DSCR.
Hard money
10% down · 12.0% · 12mo
- Down + closing
- —
- Monthly P&I
- —
- Monthly cashflow
- —
- DSCR
- —
- Eligible?
- —
Short-term bridge; refi at stabilization.
Rent comps 4 comps
| Address | Beds | Baths | Sqft | Rent | $/sqft | DOM | Units | Dist |
|---|---|---|---|---|---|---|---|---|
| 14665 SW 22nd Pl Ocala, FL | 3.0 | 2.0 | 1226 | $1,900 | $1.55 | 15d | 1 | 0.28mi |
| 14445 SW 22nd Pl Ocala, FL | 3.0 | 2.0 | 1000 | $1,400 | $1.40 | 23d | 1 | 0.33mi |
| 15388 SW 26th Pl Ocala, FL | 3.0 | 2.0 | 1218 | $1,800 | $1.48 | 15d | 1 | 0.75mi |
| 14070 SW 17th Pl Ocala, FL | 3.0 | 2.0 | 1388 | $1,500 | $1.08 | 23d | 1 | 0.78mi |
Listing history 4 events
-
2026-06-01status $209,900 Pending 10 DOM
-
2026-05-31days on market $209,900 Active 10 DOM
-
2026-05-30days on market $209,900 Active 9 DOM
-
2026-05-21$209,900 Active
ⓘ Source: listings_history table (triggers on properties + properties_extension) + one-shot
backfill from property_details.listing_events for pre-trigger history.
Nearby sold comps map
Loading sold comps map…
Walkable amenities ~0.75 mi
Loading nearby amenities…
Taxation est. · year 1
- Rental income
- $21,702
- − Mortgage interest
- −$13,043
- − Property taxes
- −$3,493
- − Insurance
- −$1,164
- − Repairs & maintenance
- −$1,736
- − Management
- −$1,736
- − Depreciation
- −$6,774
- Taxable loss
- −$6,244
- Est. tax savings @ 24.0%
- +$1,499
- After-tax cash flow
- $-667/yr
For passive investors: Depreciation is non-cash, so a rental often shows a tax loss while cash-flowing — sheltering income. Rental losses are passive: they offset passive income freely, and up to $25,000/yr can offset ordinary (W-2) income if you actively participate and your MAGI is under $100k (phasing out to $0 by $150k); unused losses carry forward. On sale, claimed depreciation is recaptured at up to 25%, and gains may owe capital-gains tax (a 1031 exchange can defer both). Figures are a year-1 estimate at your 24.0% rate — not tax advice; consult a CPA.
Condition & rehab AI · 1 photo
This property is under construction and requires extensive renovation to become move-in ready. Completing the construction and making necessary improvements will significantly increase its value for resale and rental.
Value-add opportunities
- Both Complete construction and installation of kitchen, bathrooms, and other systems — Completing construction will make the home move-in ready and suitable for both resale and rental.
- Both Landscaping and curb appeal improvements — Enhancing the exterior will improve the home's curb appeal and attract potential buyers or renters.
- Both HVAC and mechanical systems installation — Installing these systems will ensure the home is functional and energy-efficient, appealing to both buyers and renters.
- Both Interior finishing and paint — Finishing the interior and painting will make the home more attractive and ready for occupancy.
- Both Kitchen and bathroom fixtures and appliances — Installing fixtures and appliances will complete the kitchen and bathroom, making the home fully functional and ready for use.
- Both Landscaping and sod installation — Landscaping and sod will enhance the curb appeal and make the home more inviting for potential buyers or renters.
Renovation cost estimate screening
Value-add ROI direction
- Both Complete construction and installation of kitchen, bathrooms, and other systems — Completing construction will make the home move-in ready and suitable for both resale and rental. ↑
- Both Landscaping and curb appeal improvements — Enhancing the exterior will improve the home's curb appeal and attract potential buyers or renters. ↑
- Both HVAC and mechanical systems installation — Installing these systems will ensure the home is functional and energy-efficient, appealing to both buyers and renters. ↑
- Both Interior finishing and paint — Finishing the interior and painting will make the home more attractive and ready for occupancy. ↑
- Both Kitchen and bathroom fixtures and appliances — Installing fixtures and appliances will complete the kitchen and bathroom, making the home fully functional and ready for use. ↑
- Both Landscaping and sod installation — Landscaping and sod will enhance the curb appeal and make the home more inviting for potential buyers or renters. ↑
ⓘ Cost ranges are severity-bucket heuristics (US national rule-of-thumb). Get contractor quotes + a written scope before underwriting a rehab budget.
Schools (NCES district)
- District
- Marion
- NCES district ID
- 1201260
- Math proficiency
- 42% ▼ -7.00%
- Reading proficiency
- 43% ▼ -4.00%
- Median HH income
- $40,015
- Composite
- 35.61/100
- National rank
- #4890
- State rank
- #61 of 73 in FL
Livability — Rainbow Park
No livability data for this city. (Only ~50 U.S. cities are tracked.)
Census & demographics
- Census place
- Rainbow Park, FL
- County
- Marion County · 315,796 people
- Metro
- Ocala, FL
- Population (ZIP)
- 26,782
- Household income
- $57,324
- Rent vs Own
- Severe rent burden
- 313.0
Population outlook (Marion County) Hauer SSP2
- Today (2025)
- 365,905 people
- By 2030
- 376,768 · +3.0%
- By 2040
- 396,555 · +8.4%
- By 2050
- 412,723 · +12.8%
- By 2075
- 446,090 · +21.9%
- By 2100
- 436,193 · +19.2%
Race, ethnicity, and origin ACS 2023
- Neighborhood character
- Predominantly White (80%)
- Race & ethnicity
- White 80% Hispanic / Latino 11% Black 7% Two or more races 5%
- Hispanic origin (detail)
- Mexican 4% Puerto Rican 4% Cuban 1%
- Common ancestry
- Romanian 7% Lithuanian 3% Slovak 2%
- Foreign-born
- 8% · Canada, Jamaica
- Languages at home
- 88% English-only · Spanish 9% French/Haitian/Cajun 1% German/W. Germanic 1%
Political lean MEDSL · Marion
- 2024 margin
- Solid R (+31.6) · D 33.8% · R 65.5%
- 2008→2024 swing
- -20.0pp toward R · 2008: -11.6pp · 2024: -31.6pp
- All cycles
- 2024: R+31.6 2020: R+25.9 2016: R+26.2 2012: R+16.2 2008: R+11.6
Not yet ingested
- Civics
- —
Market trends
- HPI YoY
- ▼ -67.48%
- Current HPI
- 199.986
- Rent YoY
- —
- Metro
- Ocala, FL
- State GDP YoY
- ▲ 3.28%
- F500 in state
- 36
Industry mix (Fortune 500 HQ in FL)
| Industry | F500 HQs | Revenue |
|---|---|---|
| Industrial Technology | 2 | $29B |
|
||
| Insurance | 2 | $17B |
|
||
| Retail | 1 | $60B |
|
||
| Technology Distribution | 1 | $58B |
|
||
| Homebuilding | 1 | $35B |
|
||
| Technology Manufacturing | 1 | $35B |
|
||
Price history
2 events — show timeline
- 2026-05-31 Pending — Stellar MLS as Distributed by MLS Grid
- 2026-05-21 Listed $209,900 Stellar MLS as Distributed by MLS Grid
Cash-flow waterfall
monthlySold comps — $/sqft
last 12 mo · ≤1 miLoading sold comps…