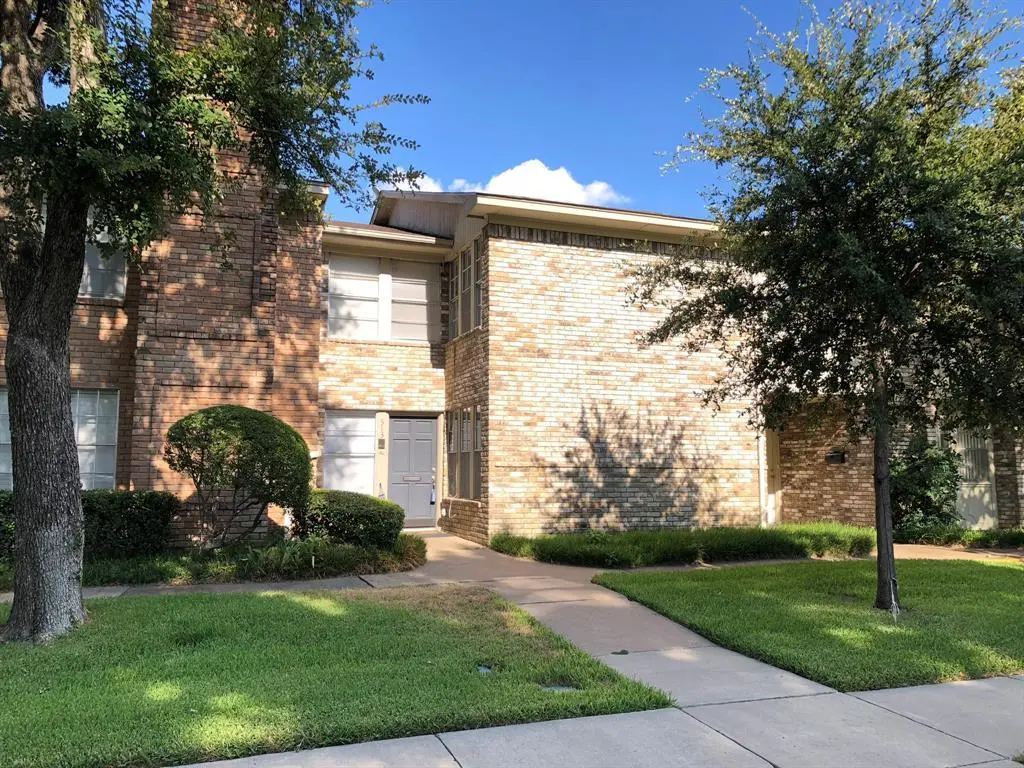
513 Towne House Ln · Richardson, TX
Flood risk 1/10 · Minimal
- FEMA flood zone
- X (unshaded)
- Chance of flooding over 30 yrs
- 0.0%
- Est. flood insurance / yr
- $507 – $1,088
Fire risk 1/10 · Minimal
- Est. fire insurance / yr
- $1,222 – $2,270
Heat risk 7/10 · Major
- Hot days now (above 109°F)
- 7 days/yr
- Hot days in 30 yrs
- 23 days/yr
Wind risk 6/10 · Moderate
- Chance of severe wind over 30 yrs
- 27.0%
Air-quality risk 3/10 · Minor
- Unhealthy air days now
- 3 days/yr
- Unhealthy air days in 30 yrs
- 3 days/yr
Risk factors via First Street. Map © Google.
Why this score? — see what drove the D grade
The composite is a weighted blend of 9 inputs, each scored 0–100. Each bar is that input's sub-score; the figure is the points it added to the 100-point composite (weight × sub-score).
- ARV discount +15.0/15.0
- Cash flow +8.5/30.0
- 1% rule +4.7/10.0
- Livability +4.2/5.0
- Schools +3.7/10.0
- Rent growth +2.5/5.0
- Condition / age +2.5/5.0
- DSCR +2.3/10.0
- Appreciation +0.0/10.0
$239,990
🖨 Deal sheet (PDF) 📄 Offer letter ✓ Due diligence
Listing remarks
sale AS IS Motivated Seller and will definitely consider all reasonable offer. Don’t miss this spacious and inviting townhome in one of Richardson’s most desirable areas! Step inside to find two large living areas and a convenient half bath downstair, perfect for entertaining. Upstairs, you’ll enjoy three generously sized bedrooms and spacious bathrooms, property retained the RETRO Design in the master bath with wall-to-wall mirrors, offering comfort and privacy for the whole family. Outside, relax on your cozy and charming patio with a fenced-in yard, plus the convenience of a covered carport. Best of all, this home is just steps away from the community pool and clubho
Key facts
- Half bath
- Clubhouse
- Community pool
Tags
Property features AI
Finance
- Other: Subdivision: Woodhaven Townhouse Rev; County: Dallas
- Financial info: Second mortgage present; Possession options: lease outstanding or specific date
- HOA & community: Mandatory HOA; Monthly association fee of $281; HOA covers front yard maintenance and full use of facilities
Exterior
- Parking: Two covered spaces; Two carport spaces; Detached carport (no garage)
- Utilities: City water; City sewer; Electricity available
- Home design: Residential townhouse (attached); Two levels; Preowned construction
- Construction: Shingle roof; Siding exterior; Slab foundation; Built in 1973
- Exterior features: Wood fencing; Interior lot; All-weather road access; Alley access; Curbs
Interior
- Kitchen: Dishwasher; Disposal; Electric range; Built-in cabinets; Corian-type countertops
- Bedrooms: Three bedrooms (primary bedroom on second level; two additional bedrooms on second level)
- Flooring: Vinyl flooring
- Bathrooms: Two full bathrooms and one half bathroom
- Heating & cooling: Central heating (electric); Central air conditioning (electric); Ceiling fans
- Interior features: Chandelier; Granite counters; Walk-in closets; Two living areas; One dining area; Accessible full bath, accessible bedroom and accessible doors
- Laundry & utility: Utilities available: electricity
Neighborhood map
What this means for you Summary
Snapshot
- This is a 3-bed/2.0-bath townhouse listed at $240k.
Deal economics
- At list price, monthly cash flow is $-212 ($-3k/yr) — negative.
- To cash-flow at today's rent, offer at most $203k (15.6% below list).
- To meet the 1% rule (rent ≥ 1% of price), the offer needs to be $234k (2.7% below list).
- Recommended offer: $203k (15.6% below list) — sets the bar for cash-flow.
- Cap rate 5.2% vs local median 2.7% in Richardson — top-decile yield for the area; either an underpriced asset or a hidden risk that comps aren't pricing in. Stress-test before assuming the spread holds.
Location & tenants
- Location reads 85/100 on livability (#5 in TX, #551 nationally) — a professional / high-income tenant draw. Strengths: commute A+, employment A+, housing A+; Watch: cost of living D+.
- Richardson ISD (urban): math 40% / reading 44% proficiency, ranked #316 of 826 in TX (top 38%) — families likely to look elsewhere, expect single-tenant / working-renter base with shorter leases.
- Zoned schools: Richardson Terrace El (math 37% / reading 37%, grade F, #1,769 of 4,322 statewide, top 44%, 502 students, 69% FRL); Apollo J H (math 28% / reading 42%, grade F, #842 of 1,662 statewide, top 51%, 639 students, 63% FRL); Berkner H S (math 20% / reading 45%, grade F, #1,029 of 1,632 statewide, top 64%, 2,290 students, 64% FRL).
- Market conditions: Rents flat; 166 active listings in the ZIP; 40 comparable units currently listed for rent nearby; rentals at typical pace (median 23d on market — plan ~3-4 weeks tenant-placement turnaround); solid renter incomes; 12,577 units permitted in Dallas County in 2024 (6,829 in 5+ unit buildings).
- This rent runs 30% of the median local income ($93k/yr) — at the standard rent-burdened threshold; future hikes will face affordability resistance.
Forward outlook
- Local home prices are declining (-3.0%/yr); year-one equity from $2k of loan paydown is wiped out by about $7k of value loss. Plan a longer hold.
- Dallas County population projected at +35% by 2050 — long-run rental-demand tailwind backs the buy-and-hold thesis.
Negotiation context
- It's been on market 49 days — a 3% lower offer ($233k) is reasonable based on typical stale-listing flexibility.
- 11 sale attempts since 21y ago with the ask held roughly flat each time — persistent listings suggest the price (not the market) is what's stuck; bring a comps-based counter.
Risks & watch-outs
- Climate carrying-cost: major wind risk, 27% chance of damaging wind over 30y; extreme-heat days projected 7→23/yr by 2055 (HVAC capex compounding) — expect insurance premiums to compound above CPI over the hold.
Questions for the listing agent
- What do current leases actually rent for vs. the listed asking? Can we see a recent rent roll and the last 12 months of T-12 income?
- It's been on market 49 days. Have you received any prior offers? Is the seller open to a 16% concession, seller financing, or rate buy-down credit?
- Built in 1973 — when were the roof, HVAC, electrical panel, plumbing, and water heater last replaced?
- What does the HOA fee cover, when was the last increase, and are there any pending special assessments or reserve-fund shortfalls?
- Is there a deadline driving the sale (1031 exchange, divorce, estate, relocation)? That informs how much negotiation room exists.
- Schools are A-rated — typically a magnet for longer-tenancy family renters. What's the average tenant stay here, and is there a school-zone premium baked into asking?
- The area grade is low — what's the realistic commute time and amenity access for the typical tenant pool here? Any planned neighborhood developments (good or bad) we should know about?
- What's the average days-on-market for RENTAL listings here right now (not sales)? A rising rental-DOM trend means longer vacancies and softer asking-rent achievability than the comps imply.
- What's the recent tenant-quality profile in this submarket — average credit score on applications, eviction rate, late-payment / NSF rate, and stable-employment percentage? A property-management company in the area should have these aggregated.
- How much new for-sale + rental construction is in the pipeline within 1–3 miles? Heavy new supply typically softens prices + rents 12–24 months out; constrained supply supports both.
Investment metrics
- 1% rule
- 0.97% ✗
- Cap rate
- 5.23%
- Cash-on-cash
- -3.78%
- DSCR
- 0.83
- GRM
- 8.6
CMA / ARV
- ARV (median comp)
- $345,747
- List price
- $239,990
- Delta
- -30.59%
- Verdict
- UNDERPRICED
- Comps
- 20 within 1.0 mi
Show comp detail 12 sales within ~0.75 mi
| Address | Dist | Beds/Ba | Sqft | Sold | Price | $/sf | Match |
|---|---|---|---|---|---|---|---|
| 531 Towne House Ln | 0.04mi | 4/2.5 (+1) | 1,889 (+4%) | 1mo | $285,000 | $151 | 84 |
| 604 Gray Stone Ln | 0.42mi | 3/2.5 | 1,755 (-3%) | 1mo | $345,000 | $197 | 72 |
| 628 Raford Hill Ln | 0.36mi | 2/2.5 (-1) | 1,779 (-2%) | 2mo | $389,900 | $219 | 71 |
| 727 Towne House Ln | 0.23mi | 3/3.0 | 1,817 (0%) | 22mo | $290,000 | $160 | 66 |
| 608 Raford Hill Ln | 0.38mi | 3/2.5 | 1,844 (+2%) | 22mo | $409,990 | $222 | 60 |
| 624 Raford Hill Ln | 0.36mi | 2/3.0 (-1) | 1,835 (+1%) | 21mo | $417,500 | $228 | 55 |
| 845 Rohan Dr | 0.63mi | 3/2.5 | 1,938 (+7%) | 4mo | $434,900 | $224 | 54 |
| 612 Gray Stone Ln | 0.42mi | 2/2.5 (-1) | 1,755 (-3%) | 23mo | $399,000 | $227 | 49 |
| 853 Rohan Dr | 0.64mi | 3/2.5 | 1,887 (+4%) | 20mo | $460,000 | $244 | 46 |
| 633 Raford Hill Ln | 0.38mi | 3/2.0 | 1,603 (-12%) | 24mo | $375,000 | $234 | 43 |
| 938 Dartford Dr | 0.74mi | 3/2.5 | 1,942 (+7%) | 17mo | $445,000 | $229 | 38 |
| 848 Rohan Dr | 0.65mi | 3/2.5 | 1,942 (+7%) | 22mo | $469,900 | $242 | 38 |
Match score weights: distance 35% · size 25% · config 20% · recency 20%. Top-matched comps best support the ARV.
Projected returns pro-forma
-3.0% appreciation · 0.19% rent growth · sell at horizon
- IRR
- -26.6%
- Equity multiple
- 0.13×
- Total profit
- $-58,531
- Equity at exit
- $35,783
- IRR
- -42.7%
- Equity multiple
- -0.37×
- Total profit
- $-92,130
- Equity at exit
- $20,750
Cash invested: $67,197 (down + closing). Projections, not guarantees.
Landlord ↔ Tenant lean methodology
- Overall (STATE)
- 87 Strongly Landlord-Friendly
- State Texas
- 87 Strongly Landlord-Friendly · R+5
- County
- — inherits STATE
- City
- — inherits STATE
ZIP-level market 75081
- Rents YoY
- 0.2%
- Active inventory
- 166
- Price-to-rent
- 8.6×
Monthly cashflow live
- Estimated rent
- $2,336 high interval (Pro) →
- Mortgage (P&I)
- −$1,259
- Tax from tax record
- −$418 /mo · $5,013/yr
- Insurance
- −$100
- HOA
- −$281
- Vacancy / Maint / Mgmt
- −$491
- Net cashflow
- $-212
Break-even live
Sensitivity live
| Price | -10% $-76 | -5% $-144 | +0% $-212 | +5% $-280 | +10% $-348 |
|---|---|---|---|---|---|
| Rent | -10% $-396 | -5% $-304 | +0% $-212 | +5% $-120 | +10% $-27 |
| Rate | -1.0pp $-91 | -0.5pp $-151 | base $-212 | +0.5pp $-274 | +1.0pp $-337 |
UW: 25.0% down · 7.5% · 30yr · 1.5% tax · 5.0% vac · 8.0% maint · 8.0% mgmt
Financing live
Cash to close
- Down payment
- $59,998
- Closing costs
- $7,200
- Reserves months
- —
- Total cash needed
- —
Loan-product check · same deal, 3 products live
Conventional
25% down · 7.5% · 30yr
- Down + closing
- —
- Monthly P&I
- —
- Monthly cashflow
- —
- DSCR
- —
- Eligible?
- —
Personal DTI + credit; lowest rate.
DSCR
20% down · 8.5% · 30yr
- Down + closing
- —
- Monthly P&I
- —
- Monthly cashflow
- —
- DSCR
- —
- Eligible?
- —
No personal income docs; deal must DSCR.
Hard money
10% down · 12.0% · 12mo
- Down + closing
- —
- Monthly P&I
- —
- Monthly cashflow
- —
- DSCR
- —
- Eligible?
- —
Short-term bridge; refi at stabilization.
Rent comps 40 comps
| Address | Beds | Baths | Sqft | Rent | $/sqft | DOM | Units | Dist |
|---|---|---|---|---|---|---|---|---|
| 501 Towne House Ln Richardson, TX | 3.0 | 2.5 | 1817 | $2,150 | $1.18 | 5d | 1 | 0.05mi |
| 501 Towne House Ln Richardson, TX | 3.0 | 2.5 | 1817 | $2,150 | $1.18 | 12d | 1 | 0.05mi |
| 524 Towne House Ln Richardson, TX | 3.0 | 2.0 | 1700 | $2,100 | $1.24 | 45d | 1 | 0.05mi |
| 625 Woodhaven Pl Richardson, TX | 3.0 | 2.0 | 1666 | $2,050 | $1.23 | 18d | 1 | 0.20mi |
| 808 Woodway Ln Richardson, TX | 3.0 | 2.0 | 1830 | $2,299 | $1.26 | 26d | 1 | 0.37mi |
| 808 Woodway Ln Richardson, TX | 3.0 | 2.0 | 1830 | $2,295 | $1.25 | 45d | 1 | 0.37mi |
| 609 Sunningdale Richardson, TX | 3.0 | 2.0 | 2061 | $2,800 | $1.36 | 45d | 1 | 0.38mi |
| 609 Sunningdale Richardson, TX | 3.0 | 2.0 | 2061 | $2,700 | $1.31 | 9d | 1 | 0.38mi |
| 811 Oakway Ct Richardson, TX | 3.0 | 2.0 | 1865 | $2,600 | $1.39 | 1d | 1 | 0.38mi |
| 636 Gray Stone Ln Richardson, TX | 3.0 | 2.5 | 1603 | $2,550 | $1.59 | 26d | 1 | 0.41mi |
| 613 Palomar Ln Richardson, TX | 4.0 | 3.0 | 2292 | $3,000 | $1.31 | 45d | 1 | 0.52mi |
| 514 S Lois Ln Richardson, TX | 3.0 | 2.0 | 1912 | $2,350 | $1.23 | 45d | 1 | 0.58mi |
| 824 Rohan Dr Richardson, TX | 3.0 | 2.5 | 1938 | $2,850 | $1.47 | 46d | 1 | 0.63mi |
| 836 Rohan Dr Richardson, TX | 3.0 | 2.5 | 1887 | $2,950 | $1.56 | 45d | 1 | 0.63mi |
| 856 Rohan Dr Unit 856 Richardson, TX | 3.0 | 2.5 | 1887 | $2,850 | $1.51 | 9d | 1 | 0.65mi |
| 856 Rohan Dr Unit 856 Richardson, TX | 3.0 | 2.5 | 1887 | $2,850 | $1.51 | 45d | 1 | 0.65mi |
| 844 Dartford Dr Richardson, TX | 3.0 | 2.5 | 1924 | $2,400 | $1.25 | 45d | 1 | 0.67mi |
| 540 Buckingham Rd Richardson, TX | 1.0–3.0 | 1.0–2.0 | 964 | $2,250 | $2.33 | 1d | 31 | 0.67mi |
| 1130 Greencove Ln Richardson, TX | 4.0 | 2.0 | 1398 | $2,295 | $1.64 | 1d | 1 | 0.69mi |
| 530 Buckingham Rd Richardson, TX | 1.0–3.0 | 1.0–2.0 | 995 | $2,503 | $2.52 | 0d | 22 | 0.72mi |
| 923 Whitehall Dr Richardson, TX | 3.0 | 2.5 | 2012 | $3,200 | $1.59 | 26d | 1 | 0.73mi |
| 950 Dartford Dr Richardson, TX | 3.0 | 2.5 | 1924 | $2,700 | $1.40 | 24d | 1 | 0.73mi |
| 939 Whitehall Dr Richardson, TX | 3.0 | 2.5 | 1887 | $2,600 | $1.38 | 7d | 1 | 0.74mi |
| 13339 Fall Manor Dr Dallas, TX | 3.0 | 2.0 | 1616 | $2,000 | $1.24 | 9d | 1 | 0.77mi |
| 1308 Grinnell Dr Richardson, TX | 4.0 | 2.0 | 1768 | $2,450 | $1.39 | 1d | 1 | 0.79mi |
| 411 Buckingham Rd Richardson, TX | 1.0–3.0 | 1.0–2.0 | 1002 | $2,490 | $2.49 | 1d | 29 | 0.88mi |
| 627 Tiffany Trl Richardson, TX | 3.0 | 3.0 | 2340 | $3,900 | $1.67 | 16d | 1 | 0.92mi |
| 1234 Briarcove Dr Richardson, TX | 3.0 | 2.0 | 1380 | $2,600 | $1.88 | 26d | 1 | 0.95mi |
| 10212 Panther Ridge Trl Dallas, TX | 4.0 | 2.5 | 2156 | $2,500 | $1.16 | 45d | 1 | 0.97mi |
| 4708 Place One Dr Garland, TX | 4.0 | 2.0 | 1800 | $2,000 | $1.11 | 45d | 1 | 0.97mi |
| 616 Tiffany Trl Richardson, TX | 4.0 | 3.0 | 2471 | $2,999 | $1.21 | 12d | 1 | 0.98mi |
| 616 Tiffany Trl Richardson, TX | 4.0 | 3.0 | 2471 | $2,999 | $1.21 | 9d | 1 | 0.98mi |
| 532 S Greenville Ave Richardson, TX | 2.0 | 2.5 | 1353 | $2,400 | $1.77 | 26d | 1 | 1.04mi |
| 635 Matthew Pl Richardson, TX | 3.0 | 2.5 | 1956 | $2,600 | $1.33 | 20d | 1 | 1.07mi |
| 4718 Bethany Dr Garland, TX | 3.0 | 2.0 | 1236 | $2,100 | $1.70 | 12d | 1 | 1.13mi |
| 951 Abrams Rd Richardson, TX | 1.0–3.0 | 1.0–2.0 | 1045 | $2,222 | $2.13 | 22d | 1 | 1.14mi |
| 429 Sheffield Dr Richardson, TX | 4.0 | 3.5 | 2545 | $3,100 | $1.22 | 9d | 1 | 1.18mi |
| 509 Shadow Bend Dr Richardson, TX | 4.0 | 4.0 | 2213 | $3,500 | $1.58 | 45d | 1 | 1.34mi |
| 714 N Plano Rd Richardson, TX | 3.0 | 3.5 | 2019 | $2,795 | $1.38 | 22d | 1 | 1.38mi |
| 10135 Rita Rd Dallas, TX | 3.0 | 2.5 | 2413 | $2,550 | $1.06 | 20d | 1 | 1.39mi |
HOA detail
- Monthly dues
- $281 · $3,372/yr
- Likely covers
- pool
Listing history 48 events
-
2026-06-21days on market $239,990 Active 49 DOM
-
2026-06-18days on market $239,990 Active 46 DOM
-
2026-06-17days on market $239,990 Active 45 DOM
-
2026-06-16days on market $239,990 Active 44 DOM
-
2026-06-15days on market $239,990 Active 43 DOM
-
2026-06-13days on market $239,990 Active 41 DOM
-
2026-06-09days on market $239,990 Active 37 DOM
-
2026-06-08days on market $239,990 Active 36 DOM
-
2026-06-07days on market $239,990 Active 35 DOM
-
2026-06-04days on market $239,990 Active 32 DOM
-
2026-06-03days on market $239,990 Active 31 DOM
-
2026-06-02days on market $239,990 Active 30 DOM
-
2026-06-01days on market $239,990 Active 29 DOM
-
2026-05-31days on market $239,990 Active 28 DOM
-
2026-05-03$239,990 Active 855-char remark
-
2026-04-27historical
-
2026-01-27$239,900 Active
-
2026-01-13historical
-
2025-11-19price $230,000
-
2025-10-02$199,990 Active
-
2025-08-12historical
-
2025-07-29$279,800 Active
-
2025-07-28historical
-
2025-04-28$279,000 Active
-
2022-11-11historical
-
2022-10-26status Active
-
2022-10-22status Pending
-
2022-10-18historical Active Option Contract
-
2022-08-10$279,900 Active
-
2022-08-08historical
-
2022-07-23price $278,000
-
2022-07-14price $288,000
-
2022-06-24$298,000 Active
-
2017-05-08soldstatus
-
2017-05-02soldstatus Sold
-
2017-04-18status Pending
-
2017-04-07historical Active Option Contract
-
2017-04-05$164,900 Active
-
2016-10-11status Pending
-
2016-10-10historical
-
2016-10-05historical Active Option Contract
-
2016-09-22$149,900 Active
-
2005-02-28soldstatus
-
2005-02-24historical
-
2005-02-22$115,000
-
2002-11-11soldstatus
-
2002-11-06soldstatus
-
1983-04-18soldstatus
ⓘ Source: listings_history table (triggers on properties + properties_extension) + one-shot
backfill from property_details.listing_events for pre-trigger history.
Tax reassessment forecast TX · Resets to sale price
- Current annual tax
- $5,013 · $418/mo
- Projected year-2 tax
- $5,013 · $418/mo
- Expected delta
- $0/yr ($0/mo · 0.0%)
ⓘ Screening estimate from a state-policy table — verify with the county assessor before closing.
Climate risk First Street
- Flood 1/10 Low FEMA zone X (unshaded) · 0% chance over 30 yrs
- Wildfire 1/10 Low
- Heat 7/10 Severe 7 d/yr ≥109°F today · 23 d/yr by 30 yrs out
- Wind 6/10 Major 27% chance of damaging wind over 30 yrs
- Air quality 3/10 Moderate 3 unhealthy d/yr today · 3 by 30 yrs out
Nearby sold comps map
Loading sold comps map…
Walkable amenities ~0.75 mi
Loading nearby amenities…
Taxation est. · year 1
- Rental income
- $28,031
- − Mortgage interest
- −$13,443
- − Property taxes
- −$5,013
- − Insurance
- −$1,200
- − Repairs & maintenance
- −$2,242
- − Management
- −$2,242
- − HOA
- −$3,372
- − Depreciation
- −$6,982
- Taxable loss
- −$6,464
- Est. tax savings @ 24.0%
- +$1,551
- After-tax cash flow
- $-992/yr
For passive investors: Depreciation is non-cash, so a rental often shows a tax loss while cash-flowing — sheltering income. Rental losses are passive: they offset passive income freely, and up to $25,000/yr can offset ordinary (W-2) income if you actively participate and your MAGI is under $100k (phasing out to $0 by $150k); unused losses carry forward. On sale, claimed depreciation is recaptured at up to 25%, and gains may owe capital-gains tax (a 1031 exchange can defer both). Figures are a year-1 estimate at your 24.0% rate — not tax advice; consult a CPA.
Schools (NCES district)
- District
- Richardson ISD
- NCES district ID
- 4837020
- Math proficiency
- 40% ▼ -14.00%
- Reading proficiency
- 44% ▼ -6.00%
- Median HH income
- $54,609
- Composite
- 36.58/100
- National rank
- #4633
- State rank
- #316 of 826 in TX
Livability — Richardson
- Score
- 85/100
- State rank
- #5
- US rank
- #551
Category grades
Schools grade is shown separately in the Schools card above.
Census & demographics
- Census place
- Richardson, TX
- County
- Dallas County · 2,612,404 people
- City population
- 118,731
- Metro
- Dallas-Fort Worth-Arlington, TX
- Population (ZIP)
- 36,544
- Household income
- $93,165
- Rent vs Own
- Severe rent burden
- 1347.0
Population outlook (Dallas County) Hauer SSP2
- Today (2025)
- 2,979,839 people
- By 2030
- 3,191,823 · +7.1%
- By 2040
- 3,619,611 · +21.5%
- By 2050
- 4,026,915 · +35.1%
- By 2075
- 4,957,073 · +66.4%
- By 2100
- 5,508,725 · +84.9%
Race, ethnicity, and origin ACS 2023
- Neighborhood character
- Diverse neighborhood (Simpson 0.70)
- Race & ethnicity
- White 46% Black 21% Hispanic / Latino 18% Asian 11% Two or more races 8%
- Hispanic origin (detail)
- Mexican 15%
- Common ancestry
- Arab 2% Lithuanian 2% Slovak 2%
- Foreign-born
- 28% · Canada, China, Vietnam
- Languages at home
- 61% English-only · Spanish 15% Other Indo-European 5% Arabic 4%
Political lean MEDSL · Dallas
- 2024 margin
- Strong D (+22.2) · D 60.2% · R 38.0% · Other 1.8%
- 2008→2024 swing
- +6.9pp toward D · 2008: 15.3pp · 2024: 22.2pp
- All cycles
- 2024: D+22.2 2020: D+31.6 2016: D+26.2 2012: D+15.4 2008: D+15.3
Not yet ingested
- Civics
- —
Market trends
- HPI YoY
- ▼ -290.20%
- Current HPI
- 305.9843
- Rent YoY
- ▲ 0.19%
- Metro
- Dallas-Fort Worth-Arlington, TX
- State GDP YoY
- ▲ 3.95%
- F500 in state
- 110
Industry mix (Fortune 500 HQ in TX)
| Industry | F500 HQs | Revenue |
|---|---|---|
| Energy | 16 | $1,198B |
|
||
| Technology | 5 | $198B |
|
||
| Engineering / Construction | 4 | $72B |
|
||
| Energy Services | 3 | $60B |
|
||
| Utilities | 3 | $41B |
|
||
| Healthcare | 2 | $330B |
|
||
Price history
+108.7% since first listed34 events — show timeline
- 2026-05-03 Listed $239,990 NTREIS
- 2026-04-27 Listing Removed — NTREIS
- 2026-01-27 Listed $239,900 NTREIS
- 2026-01-13 Listing Removed — NTREIS
- 2025-11-19 Price Changed $230,000 NTREIS
- 2025-10-02 Listed $199,990 NTREIS
- 2025-08-12 Listing Removed — NTREIS
- 2025-07-29 Listed $279,800 NTREIS
- 2025-07-28 Listing Removed — NTREIS
- 2025-04-28 Listed $279,000 NTREIS
- 2022-11-11 Listing Removed — NTREIS
- 2022-10-26 Relisted — NTREIS
- 2022-10-22 Pending — NTREIS
- 2022-10-18 Contingent — NTREIS
- 2022-08-10 Listed $279,900 NTREIS
- 2022-08-08 Listing Removed — NTREIS
- 2022-07-23 Price Changed $278,000 NTREIS
- 2022-07-14 Price Changed $288,000 NTREIS
- 2022-06-24 Listed $298,000 NTREIS
- 2017-05-08 Sold (Public Records) — Public Records
- 2017-05-02 Sold (MLS) — NTREIS
- 2017-04-18 Pending — NTREIS
- 2017-04-07 Contingent — NTREIS
- 2017-04-05 Listed $164,900 NTREIS
- 2016-10-11 Pending — NTREIS
- 2016-10-10 Listing Removed — NTREIS
- 2016-10-05 Contingent — NTREIS
- 2016-09-22 Listed $149,900 NTREIS
- 2005-02-28 Sold (MLS) — NTREIS
- 2005-02-24 Listing Removed — NTREIS
- 2005-02-22 Listed $115,000 NTREIS
- 2002-11-11 Sold (Public Records) — Public Records
- 2002-11-06 Sold (Public Records) — Public Records
- 1983-04-18 Sold (Public Records) — Public Records
Property tax history
+5.7%/yrLatest (2025): $5,013 · +0.0% YoY. Source: county tax records.
Cash-flow waterfall
monthlySold comps — $/sqft
last 12 mo · ≤1 miLoading sold comps…