 Multi-family
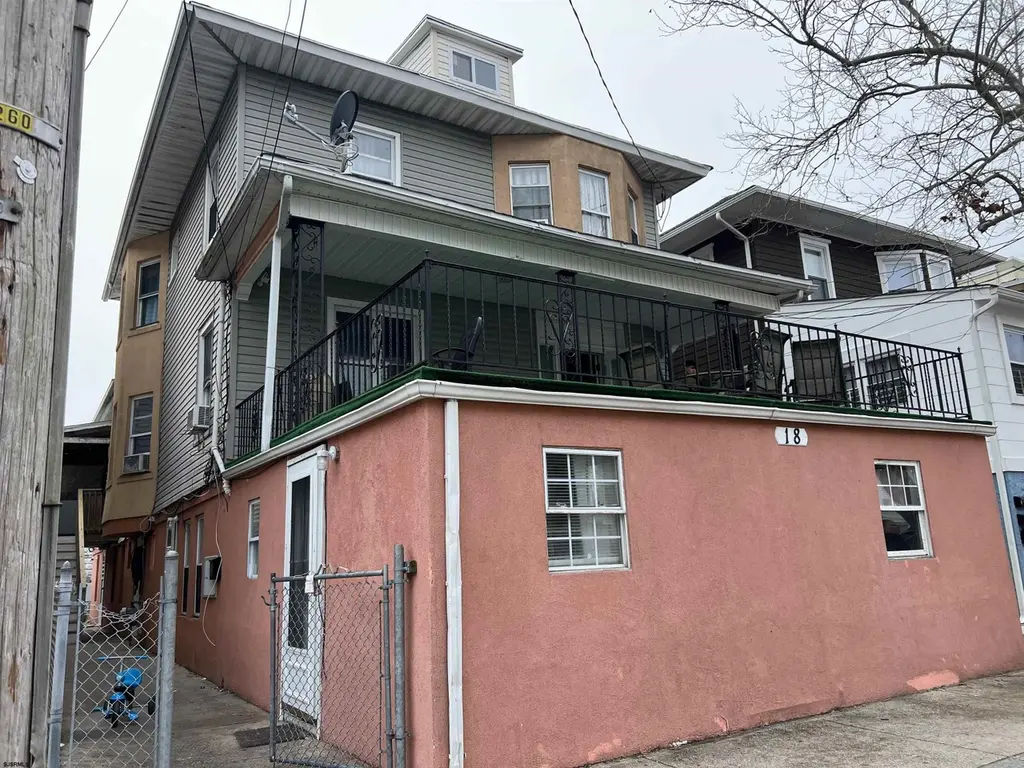
18 N Sovereign Ave · Atlantic City, NJ
Flood risk 9/10 · Severe
- FEMA flood zone
- AE
- Chance of flooding over 30 yrs
- 0.99%
- Est. flood insurance / yr
- $1,737 – $8,500
Fire risk 1/10 · Minimal
- Est. fire insurance / yr
- $526 – $976
Heat risk 9/10 · Severe
- Hot days now (above 94°F)
- 7 days/yr
- Hot days in 30 yrs
- 16 days/yr
Wind risk 8/10 · Major
- Chance of severe wind over 30 yrs
- 80.0%
Air-quality risk 2/10 · Minimal
- Unhealthy air days now
- 2 days/yr
- Unhealthy air days in 30 yrs
- 2 days/yr
Risk factors via First Street. Map © Google.
Why this score? — see what drove the F grade
The composite is a weighted blend of 9 inputs, each scored 0–100. Each bar is that input's sub-score; the figure is the points it added to the 100-point composite (weight × sub-score).
- Cash flow +13.2/30.0
- Appreciation +5.0/10.0
- DSCR +4.0/10.0
- 1% rule +3.6/10.0
- Livability +2.8/5.0
- Rent growth +2.5/5.0
- Condition / age +2.5/5.0
- Schools +1.4/10.0
- ARV discount +0.0/15.0
$625,000
🖨 Deal sheet (PDF) 📄 Offer letter ✓ Due diligence
Multi-family units
County records classify this as Multi-Family (5+ Unit). Listing-text estimate: 1 unit. estimate disagrees with records
5+ unit building — per-unit beds/baths from public records are typically unavailable; the breakdown below (if shown) is an estimate from the listing text.
Listing remarks MLS
Legal 5 units with nonconformity, 100 % occupancy, close to school , transportation and casino. Great investment !
Key facts
- Close to school
- 100 occupancy
- 5 units
Tags
Neighborhood map
What this means for you Summary
Snapshot
- This is a multifamily listed at $625k.
Deal economics
- At list price, monthly cash flow is $-442 ($-5k/yr) — negative.
- To cash-flow at today's rent, offer at most $547k (12.5% below list).
- To meet the 1% rule (rent ≥ 1% of price), the offer needs to be $535k (14.4% below list).
- Recommended offer: $535k (14.4% below list) — sets the bar for 1% rule.
- Cap rate 6.3% vs local median 3.7% in Atlantic City — top-decile yield for the area; either an underpriced asset or a hidden risk that comps aren't pricing in. Stress-test before assuming the spread holds.
Location & tenants
- Location reads 55/100 on livability (#525 in NJ) — a working-class tenant base; expect higher turnover. Strengths: health & safety A; Watch: commute D, crime F, amenities F.
- Atlantic City School District (urban): math 9% / reading 26% proficiency, ranked #454 of 472 in NJ (top 96%) — low school quality limits family demand, transient renter base, plan for 1-2y turnover; 85% free/reduced lunch — lower-income household profile, screen leases tightly.
- Zoned schools: Sovereign Avenue School (math 16% / reading 34%, grade F, #862 of 1,303 statewide, top 67%, 698 students, 91% FRL); Atlantic City High School (math 12% / reading 32%, grade F, #346 of 399 statewide, top 88%, 1,764 students, 80% FRL) — zoned schools at 86% FRL track the district average.
- Market conditions: 1 active listings in the ZIP; 7 comparable units currently listed for rent nearby; rentals at typical pace (median 24d on market — plan ~3-4 weeks tenant-placement turnaround); 672 units permitted in Atlantic County in 2024 (258 in 5+ unit buildings).
Forward outlook
- In year one you build about $23k of equity ($4k loan paydown + $19k appreciation (3.0% local appreciation)).
- Atlantic County population projected at -12% by 2050 — secular population decline; favor cash flow + early exit over multi-decade hold.
- By year 2, paydown + projected appreciation supports a ~$38k cash-out refi (75% LTV) — recoverable capital for the next deal without selling this one.
Negotiation context
- It's been on market 105 days — a 9% lower offer ($569k) is reasonable based on typical stale-listing flexibility.
- 4 sale attempts since 26y ago with the ask held roughly flat each time — persistent listings suggest the price (not the market) is what's stuck; bring a comps-based counter.
- Current owner paid $160k; list at $625k implies a 291% gain — meaningful room to come down on a strong offer.
Risks & watch-outs
- Watch-outs: flood insurance adds $427/mo; built in 1940 — expect roof / HVAC / electrical / plumbing capex.
- Climate carrying-cost: in FEMA flood zone AE (mandatory federal flood insurance); severe wind risk, 80% chance of damaging wind over 30y; extreme-heat days projected 7→16/yr by 2055 (HVAC capex compounding) — expect insurance premiums to compound above CPI over the hold.
Questions for the listing agent
- What do current leases actually rent for vs. the listed asking? Can we see a recent rent roll and the last 12 months of T-12 income?
- It's been on market 105 days. Have you received any prior offers? Is the seller open to a 14% concession, seller financing, or rate buy-down credit?
- Built in 1940 — when were the roof, HVAC, electrical panel, plumbing, and water heater last replaced?
- What's the actual annual flood-insurance premium (NFIP or private), and is the property in a SFHA with mandatory coverage?
- Why hasn't it sold? Are there any deal-killer items the seller is aware of (foundation, flood, title, zoning, code violations)?
- Is there a deadline driving the sale (1031 exchange, divorce, estate, relocation)? That informs how much negotiation room exists.
- Schools are F-rated, which usually means shorter tenancies and higher turnover. Who's the typical renter profile here, and what's been the actual vacancy rate?
- Crime grade is F in this area — have there been break-ins, vandalism, or insurance claims at this property in the last 3 years? What carrier currently insures it and at what premium?
- The area grade is low — what's the realistic commute time and amenity access for the typical tenant pool here? Any planned neighborhood developments (good or bad) we should know about?
- What's the average days-on-market for RENTAL listings here right now (not sales)? A rising rental-DOM trend means longer vacancies and softer asking-rent achievability than the comps imply.
- What's the recent tenant-quality profile in this submarket — average credit score on applications, eviction rate, late-payment / NSF rate, and stable-employment percentage? A property-management company in the area should have these aggregated.
- How much new apartment / multifamily construction is in the pipeline within 1–3 miles? Heavy new supply (>2% of stock underway) typically softens rents 12–24 months out; light construction supports rent growth.
Investment metrics
- 1% rule
- 0.86% ✗
- Cap rate
- 6.26%
- Cash-on-cash
- -0.11%
- DSCR
- 1.00
- GRM
- 9.7
CMA / ARV
- ARV (on-the-fly)
- $438,496
- Comps found
- 8
Show comp detail 8 sales within ~0.75 mi
| Address | Dist | Beds/Ba | Sqft | Sold | Price | $/sf | Match |
|---|---|---|---|---|---|---|---|
| 3625 Winchester Ave | 0.22mi | 7/— | 2,232 (-2%) | 4mo | $585,000 | $262 | 84 |
| 213 N Montpelier Ave | 0.20mi | 2/2.0 | 2,100 (-8%) | 13mo | $295,000 | $140 | 67 |
| 509 N Elberon Ave | 0.61mi | 5/2.5 | 2,200 (-3%) | 4mo | $424,900 | $193 | 63 |
| 45 S Dover Ave | 0.45mi | 7/6.0 | 2,410 (+6%) | 21mo | $539,888 | $224 | 51 |
| 105 S Albion Ave | 0.49mi | —/— | 2,390 (+5%) | 21mo | $675,000 | $282 | 51 |
| 15 S Florida Ave | 0.57mi | 5/— | 1,972 (-13%) | 3mo | $265,000 | $134 | 49 |
| 2321 Arctic Ave | 0.64mi | —/— | 2,525 (+11%) | 6mo | $356,000 | $141 | 47 |
| 115 N Delancy Pl | 0.68mi | 4/2.5 | 2,214 (-3%) | 23mo | $151,000 | $68 | 45 |
Match score weights: distance 35% · size 25% · config 20% · recency 20%. Top-matched comps best support the ARV.
Projected returns pro-forma
3.0% appreciation · 3.0% rent growth · sell at horizon
- IRR
- 4.7%
- Equity multiple
- 1.27×
- Total profit
- $47,422
- Equity at exit
- $281,027
- IRR
- 7.9%
- Equity multiple
- 2.19×
- Total profit
- $208,793
- Equity at exit
- $433,096
Cash invested: $175,000 (down + closing). Projections, not guarantees.
Landlord ↔ Tenant lean methodology
- Overall (STATE)
- 21 Tenant-Leaning
- State New Jersey
- 21 Tenant-Leaning · D+6
- County
- — inherits STATE
- City
- — inherits STATE
ZIP-level market 08401-3641
- Active inventory
- 1
- Price-to-rent
- 48.7×
Monthly cashflow live
- Estimated rent
- $5,350 medium interval (Pro) →
- Mortgage (P&I)
- −$3,278
- Tax from tax record
- −$704 /mo · $8,450/yr
- Insurance
- −$260
- Flood insurance flood zone
- −$427 /mo · $5,118/yr
- HOA
- −$0
- Lot rent
- −$0
- Vacancy / Maint / Mgmt
- −$1,124
- Net cashflow
- $-442
Break-even live
Sensitivity live
| Price | -10% $-88 | -5% $-265 | +0% $-442 | +5% $-619 | +10% $-796 |
|---|---|---|---|---|---|
| Rent | -10% $-865 | -5% $-654 | +0% $-442 | +5% $-231 | +10% $-20 |
| Rate | -1.0pp $-127 | -0.5pp $-283 | base $-442 | +0.5pp $-604 | +1.0pp $-769 |
5-unit breakdown (identical units grouped — click to expand)
| Units | Beds | Baths | Est. rent |
|---|---|---|---|
| 5× units | 2 | 1 | $5,350 |
| #1 | 2 | 1 | $1,070 |
| #2 | 2 | 1 | $1,070 |
| #3 | 2 | 1 | $1,070 |
| #4 | 2 | 1 | $1,070 |
| #5 | 2 | 1 | $1,070 |
| Total (5 units) | $5,350 | ||
UW: 25.0% down · 7.5% · 30yr · 1.5% tax · 5.0% vac · 8.0% maint · 8.0% mgmt
Financing live
Cash to close
- Down payment
- $156,250
- Closing costs
- $18,750
- Reserves months
- —
- Total cash needed
- —
Loan-product check · same deal, 3 products live
Conventional
25% down · 7.5% · 30yr
- Down + closing
- —
- Monthly P&I
- —
- Monthly cashflow
- —
- DSCR
- —
- Eligible?
- —
Personal DTI + credit; lowest rate.
DSCR
20% down · 8.5% · 30yr
- Down + closing
- —
- Monthly P&I
- —
- Monthly cashflow
- —
- DSCR
- —
- Eligible?
- —
No personal income docs; deal must DSCR.
Hard money
10% down · 12.0% · 12mo
- Down + closing
- —
- Monthly P&I
- —
- Monthly cashflow
- —
- DSCR
- —
- Eligible?
- —
Short-term bridge; refi at stabilization.
Rent comps 7 comps
| Address | Beds | Baths | Sqft | Rent | $/sqft | DOM | Units | Dist |
|---|---|---|---|---|---|---|---|---|
| 36 Chelsea Ct Atlantic City, NJ | 3.0 | 2.5 | 2100 | $3,300 | $1.57 | 16d | 1 | 0.40mi |
| 3914 South Blvd Atlantic City, NJ | 2.0 | 2.5 | 1700 | $3,400 | $2.00 | 23d | 1 | 0.40mi |
| 2402 Auburn Ter Unit B Atlantic City, NJ | 3.0 | 1.0 | 1893 | $2,000 | $1.06 | 23d | 1 | 0.60mi |
| 1 N Austin Ave Unit 1308998P Ventnor City, NJ | 3.0 | 3.0 | 2195 | $7,184 | $3.27 | 23d | 1 | 1.08mi |
| 5000 Boardwalk #1009 Ventnor City, NJ | 2.0 | 2.5 | 1893 | $17,000 | $8.98 | 23d | 1 | 1.13mi |
| 326 N Tennessee Ave Unit 2 Atlantic City, NJ | 3.0 | 1.0 | 1815 | $2,200 | $1.21 | 16d | 1 | 1.41mi |
| 208 N Surrey Ave Ventnor City, NJ | 3.0 | 2.5 | 2672 | $50,000 | $18.71 | 46d | 1 | 1.47mi |
Listing history 26 events
-
2026-06-23days on market $625,000 Active 105 DOM
-
2026-06-21days on market $625,000 Active 104 DOM
-
2026-06-19days on market $625,000 Active 102 DOM
-
2026-06-18days on market $625,000 Active 101 DOM
-
2026-06-17days on market $625,000 Active 100 DOM
-
2026-06-16days on market $625,000 Active 99 DOM
-
2026-06-15days on market $625,000 Active 98 DOM
-
2026-06-14days on market $625,000 Active 96 DOM
-
2026-06-13days on market $625,000 Active 95 DOM
-
2026-06-10days on market $625,000 Active 93 DOM
-
2026-06-09days on market $625,000 Active 92 DOM
-
2026-06-08days on market $625,000 Active 91 DOM
-
2026-06-07days on market $625,000 Active 90 DOM
-
2026-06-02days on market $625,000 Active 85 DOM
-
2026-06-01days on market $625,000 Active 84 DOM
-
2026-05-31days on market $625,000 Active 83 DOM
-
2026-05-30days on market $625,000 Active 82 DOM
-
2026-03-09$625,000 Active 114-char remark
Show marketing remark (114 chars)
Legal 5 units with nonconformity, 100 % occupancy, close to school , transportation and casino. Great investment !
-
2026-01-01historical 78-char remark
Show marketing remark (78 chars)
Five units in AC, 100% occupancy, close to school, casino, and transportation.
-
2025-03-07$625,000 Active 78-char remark
Show marketing remark (78 chars)
Five units in AC, 100% occupancy, close to school, casino, and transportation.
-
2025-01-01historical
-
2024-05-04$595,000 Active
-
2011-06-07soldstatus $160,000
-
2000-12-21soldstatus $170,000
-
2000-12-08historical
-
2000-04-13$185,000
ⓘ Source: listings_history table (triggers on properties + properties_extension) + one-shot
backfill from property_details.listing_events for pre-trigger history.
Tax reassessment forecast NJ · Partial reset (capped growth)
- Current annual tax
- $8,450 · $704/mo
- Projected year-2 tax
- $12,006 · $1,001/mo
- Expected delta
- +$3,556/yr (+$296/mo · 42.1%)
ⓘ Screening estimate from a state-policy table — verify with the county assessor before closing.
Climate risk First Street
- Flood 9/10 Extreme FEMA zone AE · 99% chance over 30 yrs
- Wildfire 1/10 Low
- Heat 9/10 Extreme 7 d/yr ≥94°F today · 16 d/yr by 30 yrs out
- Wind 8/10 Severe 80% chance of damaging wind over 30 yrs
- Air quality 2/10 Low 2 unhealthy d/yr today · 2 by 30 yrs out
Nearby sold comps map
Loading sold comps map…
Walkable amenities ~0.75 mi
Loading nearby amenities…
Taxation est. · year 1
- Rental income
- $64,200
- − Mortgage interest
- −$35,010
- − Property taxes
- −$8,450
- − Insurance
- −$8,244
- − Repairs & maintenance
- −$5,136
- − Management
- −$5,136
- − Depreciation
- −$18,182
- Taxable loss
- −$15,957
- Est. tax savings @ 24.0%
- +$3,830
- After-tax cash flow
- $-1,477/yr
For passive investors: Depreciation is non-cash, so a rental often shows a tax loss while cash-flowing — sheltering income. Rental losses are passive: they offset passive income freely, and up to $25,000/yr can offset ordinary (W-2) income if you actively participate and your MAGI is under $100k (phasing out to $0 by $150k); unused losses carry forward. On sale, claimed depreciation is recaptured at up to 25%, and gains may owe capital-gains tax (a 1031 exchange can defer both). Figures are a year-1 estimate at your 24.0% rate — not tax advice; consult a CPA.
Schools (NCES district)
- District
- Atlantic City School District
- NCES district ID
- 3400960
- Math proficiency
- 9% ▼ -12.00%
- Reading proficiency
- 26% ▼ -6.00%
- Median HH income
- $27,842
- Composite
- 13.66/100
- National rank
- #9504
- State rank
- #454 of 472 in NJ
Livability — Atlantic City
- Score
- 55/100
- State rank
- #525
- US rank
- #23095
Category grades
Schools grade is shown separately in the Schools card above.
Census & demographics
- Census place
- Atlantic City, NJ
Population outlook (Atlantic County) Hauer SSP2
- Today (2025)
- 268,948 people
- By 2030
- 264,497 · -1.7%
- By 2040
- 252,261 · -6.2%
- By 2050
- 237,846 · -11.6%
- By 2075
- 210,650 · -21.7%
- By 2100
- 180,234 · -33.0%
Not yet ingested
- Political lean
- —
- Race & ethnicity
- —
- Common origin
- —
- Civics
- —
Market trends
- HPI YoY
- —
- Current HPI
- —
- Rent YoY
- —
- Metro
- —
- State GDP YoY
- ▲ 2.05%
- F500 in state
- 34
Industry mix (Fortune 500 HQ in NJ)
| Industry | F500 HQs | Revenue |
|---|---|---|
| Consumer Goods | 3 | $31B |
|
||
| Pharmaceuticals | 2 | $153B |
|
||
| Technology | 2 | $21B |
|
||
| Insurance | 2 | $20B |
|
||
| Healthcare | 2 | $19B |
|
||
| Financial Services | 1 | $70B |
|
||
Price history
+237.8% since first listed9 events — show timeline
- 2026-03-09 Listed $625,000 SJSRMLS
- 2026-01-01 Listing Removed — SJSRMLS
- 2025-03-07 Listed $625,000 SJSRMLS
- 2025-01-01 Listing Removed — SJSRMLS
- 2024-05-04 Listed $595,000 SJSRMLS
- 2011-06-07 Sold (Public Records) $160,000 Public Records
- 2000-12-21 Sold (MLS) $170,000 SJSRMLS
- 2000-12-08 Listing Removed — SJSRMLS
- 2000-04-13 Listed $185,000 SJSRMLS
Property tax history
+0.1%/yrLatest (2025): $8,450 · -2.1% YoY. Source: county tax records.
Cash-flow waterfall
monthlySold comps — $/sqft
last 12 mo · ≤1 miLoading sold comps…