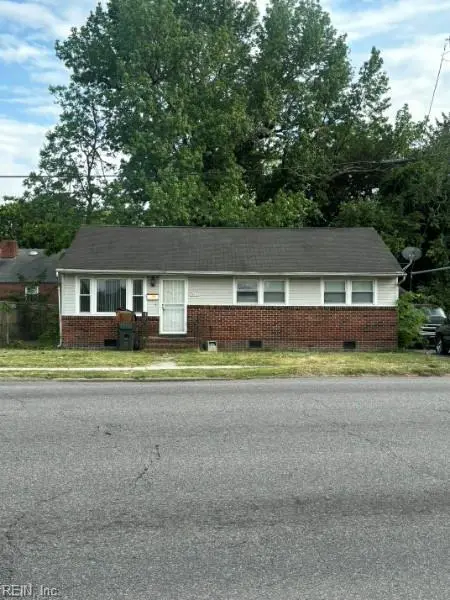
2615 Princess Anne Rd · Norfolk, VA
Flood risk 1/10 · Minimal
- FEMA flood zone
- X (unshaded)
- Chance of flooding over 30 yrs
- 0.0%
- Est. flood insurance / yr
- $507 – $1,088
Fire risk 1/10 · Minimal
- Est. fire insurance / yr
- $666 – $1,236
Heat risk 9/10 · Severe
- Hot days now (above 106°F)
- 7 days/yr
- Hot days in 30 yrs
- 16 days/yr
Wind risk 8/10 · Major
- Chance of severe wind over 30 yrs
- 80.0%
Air-quality risk 3/10 · Minor
- Unhealthy air days now
- 2 days/yr
- Unhealthy air days in 30 yrs
- 5 days/yr
Risk factors via First Street. Map © Google.
Why this score? — see what drove the C grade
The composite is a weighted blend of 9 inputs, each scored 0–100. Each bar is that input's sub-score; the figure is the points it added to the 100-point composite (weight × sub-score).
- Cash flow +18.5/30.0
- ARV discount +15.0/15.0
- DSCR +5.8/10.0
- 1% rule +4.5/10.0
- Livability +4.2/5.0
- Rent growth +4.0/5.0
- Schools +3.5/10.0
- Condition / age +2.5/5.0
- Appreciation +0.0/10.0
$180,900
🖨 Deal sheet 📄 Offer letter ✓ Due diligence
Listing remarks
Investor special! This property is being sold as-is, where-is and presents a great opportunity for investors or buyers looking to add value. With strong potential for renovation or rental income, this home is ideal for those ready to bring their vision to life. Conveniently located in Norfolk with easy access to major highways, shopping, and dining. Highly motivated seller—bring all offers!
Key facts
- Shopping and dining
- Built 1956
- Listed 19 days
Tags
Property features AI
Finance
- HOA & community: No HOA fees
Exterior
- Parking: Driveway parking spaces
- Utilities: City/County water; City/County sewer; Gas water heater; Electric service
- Home design: Detached ranch-style home; Single-story
- Construction: Crawlspace foundation; Asphalt shingle roof
- Exterior features: Brick and vinyl siding; Chain-link fence
Interior
- Kitchen: Electric range
- Bedrooms: Master bedroom on the first floor; At least one bedroom has an ensuite
- Flooring: Carpet; Ceramic; Wood
- Bathrooms: One full bathroom
- Heating & cooling: Electric heating; Central air conditioning
- Interior features: Ceiling fan
- Laundry & utility: Washer hookup; Dryer hookup; Utility room
Neighborhood map
What this means for you Summary
Snapshot
- This is a 3-bed/1.0-bath single-family listed at $181k.
Deal economics
- At list price, monthly cash flow is $172 ($2k/yr) — positive.
- The deal already cash-flows at list — no discount required.
- To meet the 1% rule (rent ≥ 1% of price), the offer needs to be $172k (4.7% below list).
- Recommended offer: $172k (4.7% below list) — sets the bar for 1% rule.
- Cap rate 7.4% vs local median 4.0% in Norfolk — top-decile yield for the area; either an underpriced asset or a hidden risk that comps aren't pricing in. Stress-test before assuming the spread holds.
Location & tenants
- Location reads 83/100 on livability (#43 in VA, #1,026 nationally) — a professional / high-income tenant draw. Strengths: amenities A+, commute A+, health & safety A+; Watch: employment C-, crime F.
- Norfolk City Public School District (urban): math 27% / reading 56% proficiency, ranked #118 of 131 in VA (top 90%) — families likely to look elsewhere, expect single-tenant / working-renter base with shorter leases.
- Zoned schools: Richard Bowling Elementary (math 13% / reading 30%, grade F, #1,077 of 1,108 statewide, top 97%, 465 students, 97% FRL); Norview High (math 33% / reading 85%, grade C+, #256 of 319 statewide, top 81%, 1,915 students, 97% FRL) — zoned schools average 97% FRL vs 59% district-wide (38 pts higher); higher-poverty schools than district average — tighter screening recommended.
- Market conditions: Rents rising fast (+6.1%/yr); 120 active listings in the ZIP; 40 comparable units currently listed for rent nearby; rentals at typical pace (median 24d on market — plan ~3-4 weeks tenant-placement turnaround); lower-income renter base — watch delinquency; 438 units permitted in Norfolk city in 2024 (273 in 5+ unit buildings).
- At $1,723/mo this rent would consume 46% of the median local household income ($45k/yr) (locally 1531% of renters already pay >50% of income on rent) — very limited rent-growth headroom before tenants either downsize or default.
Forward outlook
- Local home prices are declining (-3.0%/yr); year-one equity from $1k of loan paydown is wiped out by about $5k of value loss. Plan a longer hold.
Negotiation context
- It's been on market 19 days — a 2% lower offer ($178k) is reasonable based on typical stale-listing flexibility.
- 2 sale attempts with the ask held roughly flat each time — persistent listings suggest the price (not the market) is what's stuck; bring a comps-based counter.
- Current owner paid $140k; 29% above their basis — modest negotiation headroom, anchor on the comps not their cost.
Risks & watch-outs
- Watch-outs: built in 1956 — expect roof / HVAC / electrical / plumbing capex.
- Climate carrying-cost: severe wind risk, 80% chance of damaging wind over 30y; extreme-heat days projected 7→16/yr by 2055 (HVAC capex compounding) — expect insurance premiums to compound above CPI over the hold.
Questions for the listing agent
- Built in 1956 — when were the roof, HVAC, electrical panel, plumbing, and water heater last replaced?
- Is there a deadline driving the sale (1031 exchange, divorce, estate, relocation)? That informs how much negotiation room exists.
- Schools are A-rated — typically a magnet for longer-tenancy family renters. What's the average tenant stay here, and is there a school-zone premium baked into asking?
- Crime grade is F in this area — have there been break-ins, vandalism, or insurance claims at this property in the last 3 years? What carrier currently insures it and at what premium?
- What's the average days-on-market for RENTAL listings here right now (not sales)? A rising rental-DOM trend means longer vacancies and softer asking-rent achievability than the comps imply.
- What's the recent tenant-quality profile in this submarket — average credit score on applications, eviction rate, late-payment / NSF rate, and stable-employment percentage? A property-management company in the area should have these aggregated.
- How much new for-sale + rental construction is in the pipeline within 1–3 miles? Heavy new supply typically softens prices + rents 12–24 months out; constrained supply supports both.
Investment metrics
- 1% rule
- 0.95% ✗
- Cap rate
- 7.43%
- Cash-on-cash
- 4.08%
- DSCR
- 1.18
- GRM
- 8.7
CMA / ARV
- ARV (median comp)
- $270,000
- List price
- $180,900
- Delta
- -33.00%
- Verdict
- UNDERPRICED
- Comps
- 20 within 1.0 mi
Show comp detail 12 sales within ~0.75 mi
| Address | Dist | Beds/Ba | Sqft | Sold | Price | $/sf | Match |
|---|---|---|---|---|---|---|---|
| 2615 Princess Anne Rd | 0.00mi | 3/1.0 | 1,184 (0%) | 0mo | $140,000 | $118 | 100 |
| 2724 Mapleton Ave | 0.13mi | 3/1.5 | 1,059 (-11%) | 0mo | $270,000 | $255 | 74 |
| 1028 Mapole Ave | 0.15mi | 3/1.0 | 1,089 (-8%) | 6mo | $239,900 | $220 | 74 |
| 930 Mapole Ave | 0.24mi | 2/1.5 (-1) | 1,102 (-7%) | 7mo | $158,000 | $143 | 64 |
| 2229 Maltby Ave | 0.60mi | 3/1.5 | 1,175 (-1%) | 7mo | $285,000 | $243 | 63 |
| 1416 Bolton St | 0.73mi | 3/1.5 | 1,224 (+3%) | 2mo | $140,000 | $114 | 57 |
| 1020 Merrimac Ave | 0.33mi | 3/1.0 | 1,011 (-15%) | 6mo | $250,000 | $247 | 55 |
| 1350 Marshall Ave | 0.40mi | 3/2.5 | 1,320 (+12%) | 2mo | $140,000 | $106 | 54 |
| 2325 Keller Ave | 0.67mi | 3/1.5 | 1,240 (+5%) | 7mo | $306,000 | $247 | 53 |
| 2717 Victoria Ave | 0.74mi | 3/1.0 | 1,273 (+8%) | 2mo | $225,000 | $177 | 51 |
| 2311 Harrell Ave | 0.61mi | 4/1.0 (+1) | 1,296 (+10%) | 1mo | $270,000 | $208 | 50 |
| 720 Forbes St | 0.74mi | 3/2.0 | 1,056 (-11%) | 5mo | $150,000 | $142 | 40 |
Match score weights: distance 35% · size 25% · config 20% · recency 20%. Top-matched comps best support the ARV.
Projected returns pro-forma
-3.0% appreciation · 6.12% rent growth · sell at horizon
- IRR
- -6.6%
- Equity multiple
- 0.75×
- Total profit
- $-12,790
- Equity at exit
- $26,973
- IRR
- 6.4%
- Equity multiple
- 1.54×
- Total profit
- $27,335
- Equity at exit
- $15,641
Cash invested: $50,652 (down + closing). Projections, not guarantees.
Landlord ↔ Tenant lean methodology
- Overall (STATE)
- 55 Moderately Landlord-Leaning
- State Virginia
- 55 Moderately Landlord-Leaning · D+2
- County
- — inherits STATE
- City
- — inherits STATE
ZIP-level market 23504
- Home prices YoY
- -6.2%
- Rents YoY
- 6.1%
- Active inventory
- 120
- Price-to-rent
- 8.7×
Monthly cashflow live
- Estimated rent
- $1,723 high interval (Pro) →
- Mortgage (P&I)
- −$949
- Tax from tax record
- −$165 /mo · $1,985/yr
- Insurance
- −$75
- HOA
- −$0
- Vacancy / Maint / Mgmt
- −$362
- Net cashflow
- $172
Break-even live
UW: 25.0% down · 7.5% · 30yr · 1.5% tax · 5.0% vac · 8.0% maint · 8.0% mgmt
Financing live
Cash to close
- Down payment
- $45,225
- Closing costs
- $5,427
- Reserves months
- —
- Total cash needed
- —
Loan-product check · same deal, 3 products live
Conventional
25% down · 7.5% · 30yr
- Down + closing
- —
- Monthly P&I
- —
- Monthly cashflow
- —
- DSCR
- —
- Eligible?
- —
Personal DTI + credit; lowest rate.
DSCR
20% down · 8.5% · 30yr
- Down + closing
- —
- Monthly P&I
- —
- Monthly cashflow
- —
- DSCR
- —
- Eligible?
- —
No personal income docs; deal must DSCR.
Hard money
10% down · 12.0% · 12mo
- Down + closing
- —
- Monthly P&I
- —
- Monthly cashflow
- —
- DSCR
- —
- Eligible?
- —
Short-term bridge; refi at stabilization.
Rent comps 40 comps
| Address | Beds | Baths | Sqft | Rent | $/sqft | DOM | Units | Dist |
|---|---|---|---|---|---|---|---|---|
| 1022 Kenton Ave Norfolk, VA | 3.0 | 2.0 | 1400 | $2,400 | $1.71 | 10d | 1 | 0.17mi |
| 1300 Lead St Norfolk, VA | 1.0–2.0 | 1.0 | 950 | $1,124 | $1.18 | 23d | 1 | 0.28mi |
| 720 Forbes St Norfolk, VA | 3.0 | 2.0 | 1056 | $2,195 | $2.08 | 14d | 1 | 0.76mi |
| 720 Forbes St Norfolk, VA | 3.0 | 2.0 | 1056 | $2,250 | $2.13 | 43d | 1 | 0.76mi |
| 2400 Ballentine Blvd Unit A Norfolk, VA | 2.0 | 1.0 | 879 | $1,550 | $1.76 | 43d | 1 | 0.77mi |
| 2841 Earlscourt Ave Norfolk, VA | 4.0 | 2.0 | 1404 | $2,000 | $1.42 | 2d | 1 | 0.78mi |
| 2841 Earlscourt Ave Norfolk, VA | 4.0 | 2.0 | 1404 | $2,000 | $1.42 | 3d | 1 | 0.78mi |
| 2315 Bolton St Norfolk, VA | 3.0 | 1.0 | 1000 | $1,800 | $1.80 | 43d | 1 | 0.82mi |
| 2421 Bolton St Unit F Norfolk, VA | 2.0 | 1.0 | 725 | $1,275 | $1.76 | 43d | 1 | 0.87mi |
| 2660 Chesapeake Blvd Norfolk, VA | 3.0 | 2.0 | 1375 | $2,100 | $1.53 | 17d | 1 | 0.89mi |
| 1449 Proescher St Norfolk, VA | 3.0 | 1.5 | 1400 | $1,550 | $1.11 | 23d | 1 | 0.96mi |
| 1110 Chapel St Unit 6 Norfolk, VA | 2.0 | 1.0 | 1000 | $1,200 | $1.20 | 43d | 1 | 0.97mi |
| 2401 Ruffin St Norfolk, VA | 2.0 | 1.0 | 900 | $1,350 | $1.50 | 43d | 1 | 1.01mi |
| 3541 Mangrove Ave Unit 8 Norfolk, VA | 2.0 | 1.0 | 900 | $1,350 | $1.50 | 23d | 1 | 1.01mi |
| 3515 Gatling Ave Norfolk, VA | 2.0 | 1.0 | 770 | $1,050 | $1.36 | 43d | 1 | 1.05mi |
| 2421 Arkansas Ave Unit A Norfolk, VA | 2.0 | 1.0 | 870 | $1,225 | $1.41 | 14d | 1 | 1.06mi |
| 3507 Cape Henry Ave Unit A Norfolk, VA | 2.0 | 1.0 | 755 | $1,200 | $1.59 | 21d | 1 | 1.11mi |
| 1525 Nevada Ave Unit B Norfolk, VA | 2.0 | 1.5 | 1134 | $1,445 | $1.27 | 43d | 1 | 1.11mi |
| 1801 Bower St Unit B1 Norfolk, VA | 2.0 | 1.0 | 750 | $950 | $1.27 | 16d | 1 | 1.12mi |
| 2721 Grandy Ave Norfolk, VA | 2.0 | 1.0 | 900 | $1,150 | $1.28 | 23d | 1 | 1.12mi |
| 2900 Verdun Ave Norfolk, VA | 3.0 | 1.0 | 867 | $1,800 | $2.08 | 43d | 1 | 1.13mi |
| 2815 Keller Ave Norfolk, VA | 3.0 | 2.0 | 1210 | $2,250 | $1.86 | 4d | 1 | 1.16mi |
| 742 Lexington St Unit A Norfolk, VA | 2.0 | 1.0 | 780 | $1,100 | $1.41 | 20d | 1 | 1.19mi |
| 758 Fremont St Norfolk, VA | 2.0 | 1.0 | 852 | $995 | $1.17 | 7d | 1 | 1.19mi |
| 754 Fremont St Norfolk, VA | 2.0 | 1.0 | 852 | $995 | $1.17 | 3d | 1 | 1.19mi |
| 842 C Ave Norfolk, VA | 3.0 | 1.5 | 900 | $1,095 | $1.22 | 43d | 1 | 1.22mi |
| 764 B Ave Norfolk, VA | 3.0 | 2.5 | 1380 | $1,795 | $1.30 | 20d | 1 | 1.25mi |
| 2949 Verdun Ave Norfolk, VA | 3.0 | 2.0 | 950 | $3,000 | $3.16 | 43d | 1 | 1.26mi |
| 789 Wakefield Ave Unit D Norfolk, VA | 2.0 | 1.0 | 847 | $1,375 | $1.62 | 23d | 1 | 1.27mi |
| 645 Church St Norfolk, VA | 1.0–3.0 | 1.0–2.0 | 881 | $1,845 | $2.09 | 7d | 1 | 1.27mi |
| 3556 Riverside Dr Norfolk, VA | 3.0 | 1.0 | 1084 | $1,950 | $1.80 | 17d | 1 | 1.30mi |
| 2928 Tidewater Dr Norfolk, VA | 2.0 | 1.0 | 740 | $1,350 | $1.82 | 23d | 1 | 1.38mi |
| 1822 Saint Denis Ave Apt 4 Norfolk, VA | 2.0 | 1.0 | 750 | $995 | $1.33 | 43d | 1 | 1.43mi |
| 2111 Bellevue Ave Unit 1 Norfolk, VA | 2.0 | 1.0 | 950 | $1,300 | $1.37 | 43d | 1 | 1.43mi |
| 1801 Saint Denis Ave Unit 3 Norfolk, VA | 4.0 | 2.0 | 1500 | $2,400 | $1.60 | 23d | 1 | 1.44mi |
| 2500 Leo St Unit 2506 Leo Street-4 Norfolk, VA | 2.0 | 1.0 | 800 | $1,100 | $1.38 | 43d | 1 | 1.45mi |
| 2504 Leo St Unit 3 Norfolk, VA | 2.0 | 1.0 | 800 | $1,100 | $1.38 | 4d | 1 | 1.46mi |
| 2506 Leo St Unit 4 Norfolk, VA | 2.0 | 1.0 | 800 | $1,100 | $1.38 | 43d | 1 | 1.46mi |
| 3400 Lafayette Blvd #2 Norfolk, VA | 2.0 | 1.0 | 800 | $1,350 | $1.69 | 3d | 1 | 1.47mi |
| 2405 Lafayette Blvd Unit A Norfolk, VA | 3.0 | 2.0 | 1000 | $2,200 | $2.20 | 14d | 1 | 1.47mi |
Listing history 3 events
-
2026-05-18status Active 399-char remark
-
2026-05-08historical Active Under Contract 399-char remark
-
2026-05-01$180,900 Active 399-char remark
ⓘ Source: listings_history table (triggers on properties + properties_extension) + one-shot
backfill from property_details.listing_events for pre-trigger history.
Tax reassessment forecast VA · Resets to sale price
- Current annual tax
- $1,985 · $165/mo
- Projected year-2 tax
- $1,985 · $165/mo
- Expected delta
- $0/yr ($0/mo · 0.0%)
ⓘ Screening estimate from a state-policy table — verify with the county assessor before closing.
Climate risk First Street
- Flood 1/10 Low FEMA zone X (unshaded) · 0% chance over 30 yrs
- Wildfire 1/10 Low
- Heat 9/10 Extreme 7 d/yr ≥106°F today · 16 d/yr by 30 yrs out
- Wind 8/10 Severe 80% chance of damaging wind over 30 yrs
- Air quality 3/10 Moderate 2 unhealthy d/yr today · 5 by 30 yrs out
Nearby sold comps map
Loading sold comps map…
Walkable amenities ~0.75 mi
Loading nearby amenities…
Taxation est. · year 1
- Rental income
- $20,681
- − Mortgage interest
- −$10,133
- − Property taxes
- −$1,985
- − Insurance
- −$904
- − Repairs & maintenance
- −$1,654
- − Management
- −$1,654
- − Depreciation
- −$5,263
- Taxable loss
- −$914
- Est. tax savings @ 24.0%
- +$219
- After-tax cash flow
- $2,284/yr
For passive investors: Depreciation is non-cash, so a rental often shows a tax loss while cash-flowing — sheltering income. Rental losses are passive: they offset passive income freely, and up to $25,000/yr can offset ordinary (W-2) income if you actively participate and your MAGI is under $100k (phasing out to $0 by $150k); unused losses carry forward. On sale, claimed depreciation is recaptured at up to 25%, and gains may owe capital-gains tax (a 1031 exchange can defer both). Figures are a year-1 estimate at your 24.0% rate — not tax advice; consult a CPA.
Schools (NCES district)
- District
- Norfolk City Public School District
- NCES district ID
- 5102670
- Math proficiency
- 27% ▼ -44.00%
- Reading proficiency
- 56% ▼ -10.00%
- Median HH income
- $44,358
- Composite
- 35.08/100
- National rank
- #5026
- State rank
- #118 of 131 in VA
Livability — Norfolk
- Score
- 83/100
- State rank
- #43
- US rank
- #1026
Category grades
Schools grade is shown separately in the Schools card above.
Census & demographics
- Census place
- Norfolk, VA
- County
- Norfolk City · 214,042 people
- City population
- 214,042
- Metro
- Virginia Beach-Norfolk-Newport News, VA-NC
- Population (ZIP)
- 23,502
- Household income
- $44,659
- Rent vs Own
- Severe rent burden
- 1531.0
Population outlook (Norfolk County) Hauer SSP2
- Today (2025)
- 249,032 people
- By 2030
- 252,347 · +1.3%
- By 2040
- 253,644 · +1.9%
- By 2050
- 251,913 · +1.2%
- By 2075
- 245,281 · -1.5%
- By 2100
- 219,548 · -11.8%
Race, ethnicity, and origin ACS 2023
- Neighborhood character
- Predominantly Black (78%)
- Race & ethnicity
- Black 78% White 12% Two or more races 5% Hispanic / Latino 3%
- Common ancestry
- Lithuanian 1% Slovak 1%
- Foreign-born
- 3% · Canada
- Languages at home
- 94% English-only · Spanish 4% French/Haitian/Cajun 1%
Political lean MEDSL · Norfolk
- 2024 margin
- Solid D (+41.5) · D 70.0% · R 28.5% · Other 1.6%
- 2008→2024 swing
- -1.4pp toward R · 2008: 43.0pp · 2024: 41.5pp
- All cycles
- 2024: D+41.5 2020: D+45.6 2016: D+42.0 2012: D+44.0 2008: D+43.0
Not yet ingested
- Civics
- —
Market trends
- HPI YoY
- ▼ -21.60%
- Current HPI
- 327.2374
- Rent YoY
- ▲ 6.12%
- Metro
- Virginia Beach-Norfolk-Newport News, VA-NC
- State GDP YoY
- ▲ 2.40%
- F500 in state
- 50
Industry mix (Fortune 500 HQ in VA)
| Industry | F500 HQs | Revenue |
|---|---|---|
| Aerospace / Defense | 4 | $236B |
|
||
| Technology / Defense | 3 | $32B |
|
||
| Financial Services | 2 | $176B |
|
||
| Utilities | 2 | $27B |
|
||
| Insurance | 2 | $25B |
|
||
| Technology | 2 | $15B |
|
||
Price history
-22.6% since first listed5 events — show timeline
- 2026-06-08 Sold (MLS) $140,000 REINMLS
- 2026-05-21 Pending — REINMLS
- 2026-05-18 Relisted — REINMLS
- 2026-05-08 Contingent — REINMLS
- 2026-05-01 Listed $180,900 REINMLS
Property tax history
+5.1%/yrLatest (2025): $1,985 · +5.7% YoY. Source: county tax records.
Cash-flow waterfall
monthlySold comps — $/sqft
last 12 mo · ≤1 miLoading sold comps…