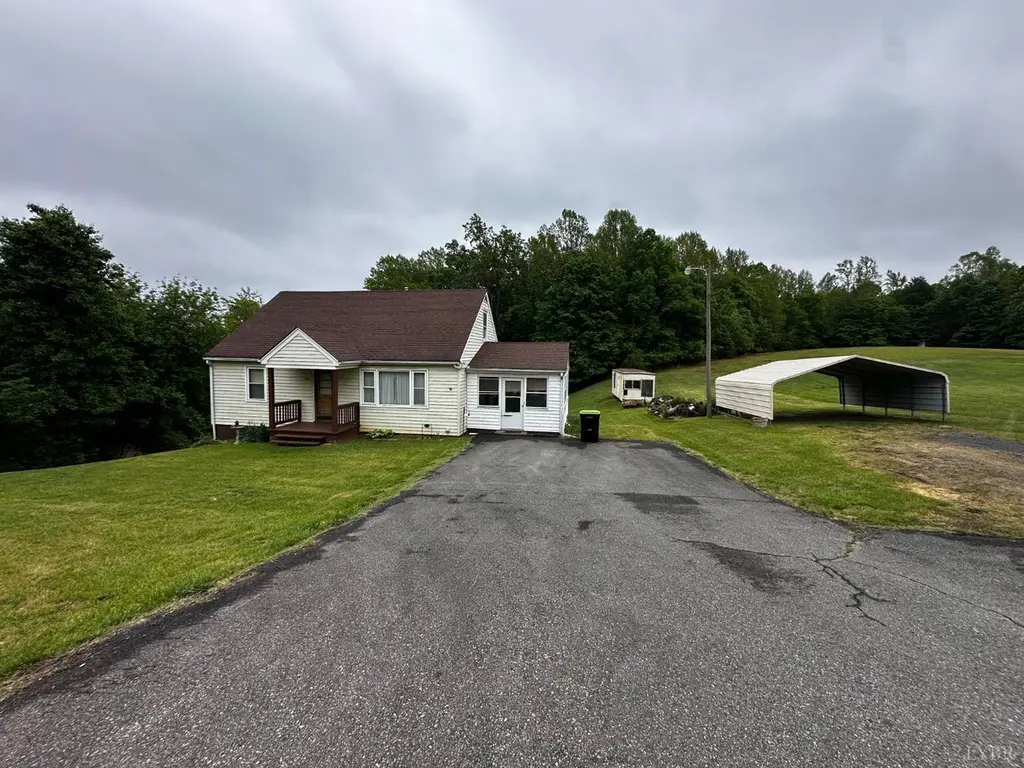
269 Thomas Rd · Madison Heights, VA
Flood risk No data
- FEMA flood zone
- —
- Chance of flooding over 30 yrs
- —
- Est. flood insurance / yr
- —
Fire risk No data
- Est. fire insurance / yr
- —
Heat risk No data
- Hot days now (above threshold)
- —
- Hot days in 30 yrs
- —
Wind risk No data
- Chance of severe wind over 30 yrs
- —
Air-quality risk No data
- Unhealthy air days now
- —
- Unhealthy air days in 30 yrs
- —
Risk factors via First Street. Map © Google.
Why this score? — see what drove the D- grade
The composite is a weighted blend of 9 inputs, each scored 0–100. Each bar is that input's sub-score; the figure is the points it added to the 100-point composite (weight × sub-score).
- Cash flow +9.6/30.0
- ARV discount +8.4/15.0
- Schools +4.4/10.0
- Livability +3.7/5.0
- DSCR +2.7/10.0
- Rent growth +2.5/5.0
- Condition / age +2.5/5.0
- 1% rule +1.7/10.0
- Appreciation +0.0/10.0
$214,900
🖨 Deal sheet (PDF) 📄 Offer letter ✓ Due diligence
Listing remarks
Charming one-owner country home offering peaceful surroundings and timeless appeal. This property features a welcoming front porch, spacious paved driveway and sits on a generous lot with plenty of room to enjoy the outdoors. Inside, you'll find warm hardwood floors throughout most of the home with a functional layout full of character. The home features two bedrooms on the main level along with two additional bedrooms upstairs, providing flexibility for family, guests, or office space. Enjoy quiet country living with being 10 mins to Lynchburg. Whether you're looking for a starter home, room to grow, or an investment opportunity, this one-owner home is full of potential and ready for its n
Key facts
- Generous lot
- Front porch
- Paved driveway
Tags
Property features AI
Exterior
- Parking: Paved parking
- Utilities: Cable available; Septic tank sewer
- Home design: Single-family residence; One story
- Construction: Vinyl siding; Built with a foundation and full basement
- Exterior features: Screened porch; Porch; Shingle roof; Garden; Storage structure; Workshop
Interior
- Kitchen: Electric range; Refrigerator; Electric water heater
- Flooring: Hardwood and wood flooring; Laminate flooring
- Bathrooms: 1 full bathroom; 1 half bathroom
- Heating & cooling: Heat pump heating; Has heating
- Interior features: Garden adjacent to the home; Storm door(s)
- Laundry & utility: Washer and dryer included; Washer hookup in basement; Laundry located in basement; Full basement
Neighborhood map
What this means for you Summary
Snapshot
- This is a 3-bed/1.0-bath single-family listed at $215k.
Deal economics
- At list price, monthly cash flow is $-145 ($-2k/yr) — negative.
- To cash-flow at today's rent, offer at most $189k (11.9% below list).
- To meet the 1% rule (rent ≥ 1% of price), the offer needs to be $143k (33.4% below list).
- Recommended offer: $143k (33.4% below list) — sets the bar for 1% rule.
- Cap rate 5.5% vs local median 3.1% in Madison Heights — top-decile yield for the area; either an underpriced asset or a hidden risk that comps aren't pricing in. Stress-test before assuming the spread holds.
Location & tenants
- Location reads 73/100 on livability (#166 in VA) — a middle-class / working-renter tenant base. Strengths: cost of living A+, housing A+, commute B; Watch: health & safety C-, employment D, amenities F.
- Amherst County Public School District (rural): math 40% / reading 64% proficiency, ranked #94 of 131 in VA (top 72%) — acceptable for families but not a draw, mixed tenant base, ~2y average lease.
- Zoned schools: Madison Heights Elementary (math 32% / reading 47%, grade F, #900 of 1,108 statewide, top 83%, 418 students, 77% FRL); Monelison Middle (math 25% / reading 59%, grade D-, #295 of 342 statewide, top 87%, 513 students, 77% FRL); Amherst County High (math 57% / reading 81%, grade B, #170 of 319 statewide, top 55%, 1,260 students, 75% FRL) — zoned schools average 76% FRL vs 42% district-wide (34 pts higher); higher-poverty schools than district average — tighter screening recommended.
- Market conditions: 116 active listings in the ZIP; 7 comparable units currently listed for rent nearby; rentals lingering (median 46d on market — plan ~5-8 weeks vacancy on turnover, expect pricing pressure); 57% of comp listings sitting > 30 days — soft ceiling on asking rent; 228 units permitted in Amherst County in 2024 (108 in 5+ unit buildings).
Forward outlook
- Local home prices are declining (-3.0%/yr); year-one equity from $1k of loan paydown is wiped out by about $6k of value loss. Plan a longer hold.
- Amherst County population projected at -28% by 2050 — secular population decline; favor cash flow + early exit over multi-decade hold.
Negotiation context
- Only 5 days on market — expect competitive offers; lowballing is unlikely to land.
Questions for the listing agent
- What do current leases actually rent for vs. the listed asking? Can we see a recent rent roll and the last 12 months of T-12 income?
- Built in 1961 — when were the roof, HVAC, electrical panel, plumbing, and water heater last replaced?
- Is there a deadline driving the sale (1031 exchange, divorce, estate, relocation)? That informs how much negotiation room exists.
- Schools are B-rated — typically a magnet for longer-tenancy family renters. What's the average tenant stay here, and is there a school-zone premium baked into asking?
- The area grade is low — what's the realistic commute time and amenity access for the typical tenant pool here? Any planned neighborhood developments (good or bad) we should know about?
- What's the average days-on-market for RENTAL listings here right now (not sales)? A rising rental-DOM trend means longer vacancies and softer asking-rent achievability than the comps imply.
- What's the recent tenant-quality profile in this submarket — average credit score on applications, eviction rate, late-payment / NSF rate, and stable-employment percentage? A property-management company in the area should have these aggregated.
- How much new for-sale + rental construction is in the pipeline within 1–3 miles? Heavy new supply typically softens prices + rents 12–24 months out; constrained supply supports both.
Investment metrics
- 1% rule
- 0.67% ✗
- Cap rate
- 5.49%
- Cash-on-cash
- -2.89%
- DSCR
- 0.87
- GRM
- 12.5
CMA / ARV
- ARV (median comp)
- $219,508
- List price
- $214,900
- Delta
- -2.10%
- Verdict
- FAIR
- Comps
- 20 within 1.0 mi
Show comp detail 3 sales within ~0.75 mi
| Address | Dist | Beds/Ba | Sqft | Sold | Price | $/sf | Match |
|---|---|---|---|---|---|---|---|
| 233 Mays St | 0.47mi | 2/1.0 (-1) | 1,263 (-4%) | 13mo | $220,000 | $174 | 57 |
| 170 Woodvue Dr | 0.40mi | 3/2.0 | 1,404 (+7%) | 22mo | $239,900 | $171 | 46 |
| 140 Grove Ave | 0.55mi | 3/1.0 | 1,497 (+14%) | 18mo | $237,500 | $159 | 35 |
Match score weights: distance 35% · size 25% · config 20% · recency 20%. Top-matched comps best support the ARV.
Projected returns pro-forma
-3.0% appreciation · 3.0% rent growth · sell at horizon
- IRR
- -21.2%
- Equity multiple
- 0.27×
- Total profit
- $-44,145
- Equity at exit
- $32,042
- IRR
- -14.8%
- Equity multiple
- 0.16×
- Total profit
- $-50,744
- Equity at exit
- $18,581
Cash invested: $60,172 (down + closing). Projections, not guarantees.
Landlord ↔ Tenant lean methodology
- Overall (STATE)
- 55 Moderately Landlord-Leaning
- State Virginia
- 55 Moderately Landlord-Leaning · D+2
- County
- — inherits STATE
- City
- — inherits STATE
ZIP-level market 24572
- Home prices YoY
- -22.0%
- Active inventory
- 116
- Price-to-rent
- 12.5×
Monthly cashflow live
- Estimated rent
- $1,430 high interval (Pro) →
- Mortgage (P&I)
- −$1,127
- Tax from tax record
- −$58 /mo · $696/yr
- Insurance
- −$90
- HOA
- −$0
- Vacancy / Maint / Mgmt
- −$300
- Net cashflow
- $-145
Break-even live
Sensitivity live
| Price | -10% $-23 | -5% $-84 | +0% $-145 | +5% $-206 | +10% $-266 |
|---|---|---|---|---|---|
| Rent | -10% $-258 | -5% $-201 | +0% $-145 | +5% $-88 | +10% $-32 |
| Rate | -1.0pp $-36 | -0.5pp $-90 | base $-145 | +0.5pp $-200 | +1.0pp $-257 |
UW: 25.0% down · 7.5% · 30yr · 1.5% tax · 5.0% vac · 8.0% maint · 8.0% mgmt
Financing live
Cash to close
- Down payment
- $53,725
- Closing costs
- $6,447
- Reserves months
- —
- Total cash needed
- —
Loan-product check · same deal, 3 products live
Conventional
25% down · 7.5% · 30yr
- Down + closing
- —
- Monthly P&I
- —
- Monthly cashflow
- —
- DSCR
- —
- Eligible?
- —
Personal DTI + credit; lowest rate.
DSCR
20% down · 8.5% · 30yr
- Down + closing
- —
- Monthly P&I
- —
- Monthly cashflow
- —
- DSCR
- —
- Eligible?
- —
No personal income docs; deal must DSCR.
Hard money
10% down · 12.0% · 12mo
- Down + closing
- —
- Monthly P&I
- —
- Monthly cashflow
- —
- DSCR
- —
- Eligible?
- —
Short-term bridge; refi at stabilization.
Rent comps 7 comps
| Address | Beds | Baths | Sqft | Rent | $/sqft | DOM | Units | Dist |
|---|---|---|---|---|---|---|---|---|
| 115 Town Center Pkwy Unit 1001 Madison Heights, VA | 3.0 | 2.0 | 1356 | $1,650 | $1.22 | 45d | 1 | 0.55mi |
| 115 Town Center Pkwy Apt 1206 Madison Heights, VA | 2.0 | 2.0 | 1234 | $1,500 | $1.22 | 15d | 1 | 0.55mi |
| 131 Town Center Pkwy Unit 2104 Madison Heights, VA | 2.0 | 2.0 | 1332 | $1,600 | $1.20 | 23d | 1 | 0.57mi |
| 156 Cedar Crest Dr Apt 302 Madison Heights, VA | 2.0 | 1.5 | 980 | $995 | $1.02 | 15d | 1 | 0.86mi |
| 4995 S Amherst Hwy Apt 224 Madison Heights, VA | 2.0 | 1.0 | 982 | $795 | $0.81 | 45d | 1 | 0.94mi |
| 197 Hilltop Dr Madison Heights, VA | 3.0 | 1.0 | 1279 | $1,500 | $1.17 | 45d | 1 | 1.35mi |
| 146 Oakwood Dr Unit 150 Madison Heights, VA | 2.0 | 1.5 | 1066 | $1,100 | $1.03 | 45d | 1 | 1.40mi |
Listing history 2 events
-
2026-05-04status Pending 711-char remark
-
2026-04-29$214,900 Active 711-char remark
ⓘ Source: listings_history table (triggers on properties + properties_extension) + one-shot
backfill from property_details.listing_events for pre-trigger history.
Tax reassessment forecast VA · Resets to sale price
- Current annual tax
- $696 · $58/mo
- Projected year-2 tax
- $1,762 · $147/mo
- Expected delta
- +$1,066/yr (+$89/mo · 153.2%)
ⓘ Screening estimate from a state-policy table — verify with the county assessor before closing.
Nearby sold comps map
Loading sold comps map…
Walkable amenities ~0.75 mi
Loading nearby amenities…
Taxation est. · year 1
- Rental income
- $17,162
- − Mortgage interest
- −$12,038
- − Property taxes
- −$696
- − Insurance
- −$1,074
- − Repairs & maintenance
- −$1,373
- − Management
- −$1,373
- − Depreciation
- −$6,252
- Taxable loss
- −$5,644
- Est. tax savings @ 24.0%
- +$1,355
- After-tax cash flow
- $-382/yr
For passive investors: Depreciation is non-cash, so a rental often shows a tax loss while cash-flowing — sheltering income. Rental losses are passive: they offset passive income freely, and up to $25,000/yr can offset ordinary (W-2) income if you actively participate and your MAGI is under $100k (phasing out to $0 by $150k); unused losses carry forward. On sale, claimed depreciation is recaptured at up to 25%, and gains may owe capital-gains tax (a 1031 exchange can defer both). Figures are a year-1 estimate at your 24.0% rate — not tax advice; consult a CPA.
Schools (NCES district)
- District
- Amherst County Public School District
- NCES district ID
- 5100210
- Math proficiency
- 40% ▼ -42.00%
- Reading proficiency
- 64% ▼ -14.00%
- Median HH income
- $45,945
- Composite
- 43.96/100
- National rank
- #2900
- State rank
- #94 of 131 in VA
Livability — Madison Heights
- Score
- 73/100
- State rank
- #166
- US rank
- #5166
Category grades
Schools grade is shown separately in the Schools card above.
Census & demographics
- Census place
- Madison Heights, VA
- County
- Amherst County · 15,744 people
- City population
- 15,744
- Metro
- Lynchburg, VA
- Population (ZIP)
- 15,744
- Household income
- $62,030
- Rent vs Own
- Severe rent burden
- 357.0
Population outlook (Amherst County) Hauer SSP2
- Today (2025)
- 29,790 people
- By 2030
- 28,332 · -4.9%
- By 2040
- 24,963 · -16.2%
- By 2050
- 21,468 · -27.9%
- By 2075
- 14,111 · -52.6%
- By 2100
- 9,344 · -68.6%
Race, ethnicity, and origin ACS 2023
- Neighborhood character
- Predominantly White (70%)
- Race & ethnicity
- White 70% Black 21% Two or more races 6% Hispanic / Latino 3% Asian 1%
- Common ancestry
- Slovak 2% Italian 1% Serbian 1%
- Foreign-born
- 1% · Canada, Jamaica
- Languages at home
- 97% English-only · Spanish 2%
Political lean MEDSL · Amherst
- 2024 margin
- Solid R (+36.5) · D 31.4% · R 67.9%
- 2008→2024 swing
- -20.3pp toward R · 2008: -16.2pp · 2024: -36.5pp
- All cycles
- 2024: R+36.5 2020: R+31.6 2016: R+30.7 2012: R+19.9 2008: R+16.2
Not yet ingested
- Civics
- —
Market trends
- HPI YoY
- ▼ -50.26%
- Current HPI
- 178.2917
- Rent YoY
- —
- Metro
- Lynchburg, VA
- State GDP YoY
- ▲ 2.40%
- F500 in state
- 50
Industry mix (Fortune 500 HQ in VA)
| Industry | F500 HQs | Revenue |
|---|---|---|
| Aerospace / Defense | 4 | $236B |
|
||
| Technology / Defense | 3 | $32B |
|
||
| Financial Services | 2 | $176B |
|
||
| Utilities | 2 | $27B |
|
||
| Insurance | 2 | $25B |
|
||
| Technology | 2 | $15B |
|
||
Price history
2 events — show timeline
- 2026-05-04 Pending — LMLS
- 2026-04-29 Listed $214,900 LMLS
Property tax history
+0.8%/yrLatest (2025): $696 · +0.0% YoY. Source: county tax records.
Cash-flow waterfall
monthlySold comps — $/sqft
last 12 mo · ≤1 miLoading sold comps…