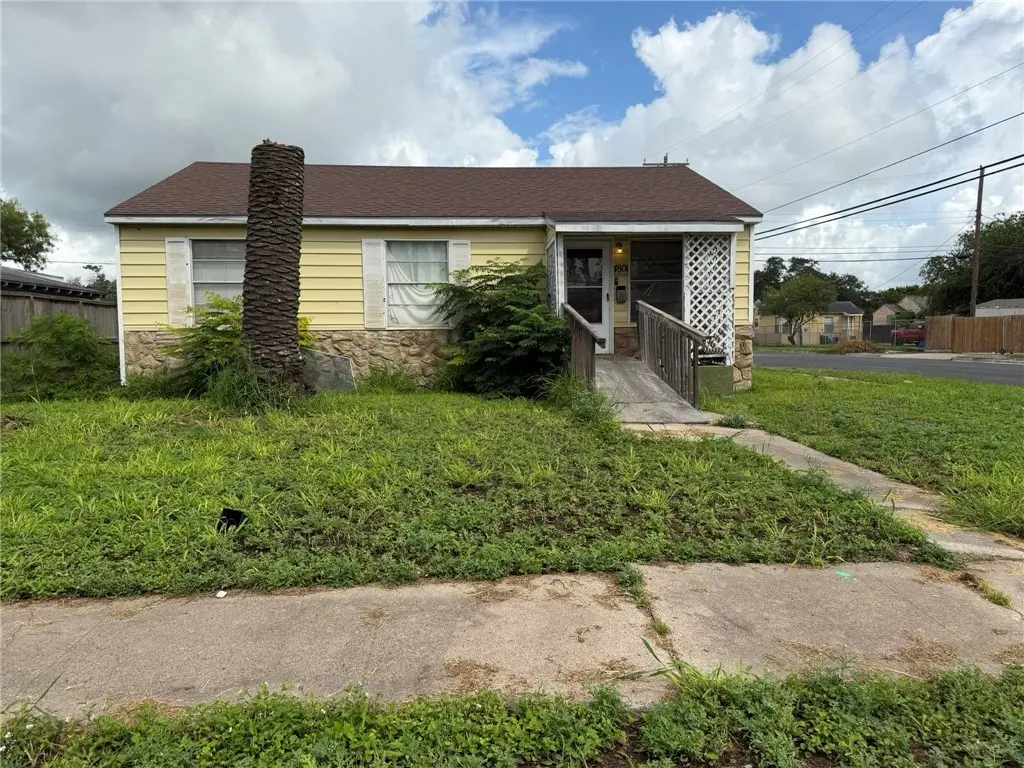
4801 Odem Dr · Corpus Christi, TX
Flood risk 1/10 · Minimal
- FEMA flood zone
- X (unshaded)
- Chance of flooding over 30 yrs
- 0.0%
- Est. flood insurance / yr
- $507 – $1,088
Fire risk 1/10 · Minimal
- Est. fire insurance / yr
- $1,222 – $2,270
Heat risk 10/10 · Severe
- Hot days now (above 107°F)
- 7 days/yr
- Hot days in 30 yrs
- 26 days/yr
Wind risk 9/10 · Severe
- Chance of severe wind over 30 yrs
- 99.0%
Air-quality risk 1/10 · Minimal
- Unhealthy air days now
- 0 days/yr
- Unhealthy air days in 30 yrs
- 0 days/yr
Risk factors via First Street. Map © Google.
Why this score? — see what drove the B+ grade
The composite is a weighted blend of 9 inputs, each scored 0–100. Each bar is that input's sub-score; the figure is the points it added to the 100-point composite (weight × sub-score).
- Cash flow +28.8/30.0
- ARV discount +15.0/15.0
- DSCR +10.0/10.0
- 1% rule +9.2/10.0
- Livability +3.9/5.0
- Rent growth +3.1/5.0
- Schools +2.8/10.0
- Condition / age +2.5/5.0
- Appreciation +0.0/10.0
$99,900
🖨 Deal sheet (PDF) 📄 Offer letter ✓ Due diligence
Listing remarks MLS
Adorable 3 bedroom with updated bath; nice hardwood floors
Key facts
- 6,443 sq ft lot
- 2 garage spots
- Built 1950
Property features AI
Exterior
- Parking: Detached garage; 2 covered spaces (garage); 5 total parking spaces
- Utilities: Public sewer available; Sewer available
- Home design: Single-story; Pillar/post/pier foundation
- Construction: Vinyl siding; Wood siding; Shingle roof; Built as single-story
- Exterior features: Open patio; Wood fencing; Corner lot
Interior
- Flooring: Hardwood
- Bathrooms: 1 full bathroom
- Heating & cooling: Window heating unit; Window cooling unit
- Interior features: Cable TV
- Laundry & utility: Dryer hookup; Washer included
Neighborhood map
What this means for you Summary
Snapshot
- This is a 3-bed/1.0-bath single-family listed at $100k.
Deal economics
- At list price, monthly cash flow is $337 ($4k/yr) — positive.
- The deal already cash-flows at list — no discount required.
- Meets the 1% rule at list price ($1k rent vs $100k).
- Recommended offer: $98k (1.5% below list) — sets the bar for market timing.
- Cap rate 10.3% vs local median 3.6% in Corpus Christi — top-decile yield for the area; either an underpriced asset or a hidden risk that comps aren't pricing in. Stress-test before assuming the spread holds.
Location & tenants
- Location reads 78/100 on livability (#66 in TX, #2,404 nationally) — a middle-class / working-renter tenant base. Strengths: commute A+, cost of living A+, housing A+; Watch: crime F.
- Corpus Christi ISD (urban): math 31% / reading 35% proficiency, ranked #562 of 826 in TX (top 68%) — families likely to look elsewhere, expect single-tenant / working-renter base with shorter leases; 63% free/reduced lunch — lower-income household profile, screen leases tightly.
- Zoned schools: Windsor Park G/T (math 85% / reading 90%, grade A+, #6 of 4,322 statewide, top 0%, 609 students, 29% FRL); Adkins Middle (math 40% / reading 39%, grade F, #660 of 1,662 statewide, top 41%, 956 students, 48% FRL); Moody H S (math 33% / reading 26%, grade F, #1,112 of 1,632 statewide, top 70%, 1,382 students, 84% FRL).
- Zoned-school proficiency averages 52% at this address vs 33% district-wide (+19 pts) — the actual schools serving this property are materially stronger than the Corpus Christi ISD average implies; a family-tenant draw the district grade alone would hide.
- Market conditions: Rents rising (+2.3%/yr); 434 active listings in the ZIP; 32 comparable units currently listed for rent nearby; rentals at typical pace (median 23d on market — plan ~3-4 weeks tenant-placement turnaround); 41% of comp listings sitting > 30 days — soft ceiling on asking rent; 1,397 units permitted in Nueces County in 2024 (47 in 5+ unit buildings).
Forward outlook
- Local home prices are declining (-3.0%/yr); year-one equity from $691 of loan paydown is wiped out by about $3k of value loss. Plan a longer hold.
- Nueces County population projected at +36% by 2050 — long-run rental-demand tailwind backs the buy-and-hold thesis.
- At projected returns (-3.0% appreciation + 2.3% rent growth), your $28k cash investment doubles in ~9 years — after that, you're playing with house money.
Negotiation context
- It's been on market 16 days — a 2% lower offer ($98k) is reasonable based on typical stale-listing flexibility.
- 3 sale attempts since 23y ago; this cycle's ask has dropped $20k (17%) from the opening price — seller is motivated, your offer sets the floor, not the list.
Risks & watch-outs
- Watch-outs: property tax is 2.6% of price; built in 1950 — expect roof / HVAC / electrical / plumbing capex.
- Climate carrying-cost: severe wind risk, 99% chance of damaging wind over 30y; extreme-heat days projected 7→26/yr by 2055 (HVAC capex compounding) — expect insurance premiums to compound above CPI over the hold.
Questions for the listing agent
- Built in 1950 — when were the roof, HVAC, electrical panel, plumbing, and water heater last replaced?
- Property tax is high relative to price — has the assessment been appealed recently, and will the sale trigger a re-assessment?
- Is there a deadline driving the sale (1031 exchange, divorce, estate, relocation)? That informs how much negotiation room exists.
- Crime grade is F in this area — have there been break-ins, vandalism, or insurance claims at this property in the last 3 years? What carrier currently insures it and at what premium?
- What's the average days-on-market for RENTAL listings here right now (not sales)? A rising rental-DOM trend means longer vacancies and softer asking-rent achievability than the comps imply.
- What's the recent tenant-quality profile in this submarket — average credit score on applications, eviction rate, late-payment / NSF rate, and stable-employment percentage? A property-management company in the area should have these aggregated.
- How much new for-sale + rental construction is in the pipeline within 1–3 miles? Heavy new supply typically softens prices + rents 12–24 months out; constrained supply supports both.
Investment metrics
- 1% rule
- 1.42% ✓
- Cap rate
- 10.34%
- Cash-on-cash
- 14.44%
- DSCR
- 1.64
- GRM
- 5.9
CMA / ARV
- ARV (on-the-fly)
- $150,192
- Comps found
- 12
Show comp detail 12 sales within ~0.75 mi
| Address | Dist | Beds/Ba | Sqft | Sold | Price | $/sf | Match |
|---|---|---|---|---|---|---|---|
| 4705 Kendall Dr | 0.19mi | 3/1.0 | 1,036 (+3%) | 1mo | $155,000 | $150 | 86 |
| 4721 Nesbitt Dr | 0.10mi | 3/1.0 | 1,088 (+8%) | 2mo | $149,000 | $137 | 80 |
| 4718 Queen Dr | 0.16mi | 2/1.0 (-1) | 1,133 (+12%) | 2mo | $89,900 | $79 | 65 |
| 4922 Gabriel Dr | 0.38mi | 3/1.5 | 1,083 (+7%) | 5mo | $99,950 | $92 | 63 |
| 4505 Moravian Dr | 0.66mi | 3/1.0 | 1,000 (-1%) | 6mo | $160,000 | $160 | 63 |
| 4822 Dodd Dr | 0.53mi | 2/1.0 (-1) | 938 (-7%) | 1mo | $139,500 | $149 | 58 |
| 4513 Green Grove Dr | 0.39mi | 3/1.0 | 1,104 (+10%) | 10mo | $150,000 | $136 | 58 |
| 4309 Nicholson St | 0.56mi | 3/2.0 | 1,059 (+5%) | 10mo | $90,000 | $85 | 53 |
| 4318 Ivy | 0.60mi | 4/2.0 (+1) | 1,043 (+4%) | 10mo | $169,000 | $162 | 49 |
| 4849 Easter Dr | 0.47mi | 2/1.0 (-1) | 885 (-12%) | 7mo | $79,900 | $90 | 47 |
| 4649 Dodd Dr | 0.58mi | 3/1.0 | 888 (-12%) | 10mo | $187,000 | $211 | 45 |
| 5334 Bowie St | 0.72mi | 3/1.0 | 920 (-9%) | 10mo | $157,900 | $172 | 43 |
Match score weights: distance 35% · size 25% · config 20% · recency 20%. Top-matched comps best support the ARV.
Projected returns pro-forma
-3.0% appreciation · 2.32% rent growth · sell at horizon
- IRR
- 4.1%
- Equity multiple
- 1.16×
- Total profit
- $4,369
- Equity at exit
- $14,895
- IRR
- 12.9%
- Equity multiple
- 2.00×
- Total profit
- $27,833
- Equity at exit
- $8,638
Cash invested: $27,972 (down + closing). Projections, not guarantees.
Landlord ↔ Tenant lean methodology
- Overall (STATE)
- 87 Strongly Landlord-Friendly
- State Texas
- 87 Strongly Landlord-Friendly · R+5
- County
- — inherits STATE
- City
- — inherits STATE
ZIP-level market 78415
- Rents YoY
- 2.3%
- Active inventory
- 434
- Price-to-rent
- 5.9×
Monthly cashflow live
- Estimated rent
- $1,418 high interval (Pro) →
- Mortgage (P&I)
- −$524
- Tax from tax record
- −$218 /mo · $2,616/yr
- Insurance
- −$42
- HOA
- −$0
- Vacancy / Maint / Mgmt
- −$298
- Net cashflow
- $337
Break-even live
Sensitivity live
| Price | -10% $393 | -5% $365 | +0% $337 | +5% $308 | +10% $280 |
|---|---|---|---|---|---|
| Rent | -10% $225 | -5% $281 | +0% $337 | +5% $393 | +10% $449 |
| Rate | -1.0pp $387 | -0.5pp $362 | base $337 | +0.5pp $311 | +1.0pp $284 |
UW: 25.0% down · 7.5% · 30yr · 1.5% tax · 5.0% vac · 8.0% maint · 8.0% mgmt
Financing live
Cash to close
- Down payment
- $24,975
- Closing costs
- $2,997
- Reserves months
- —
- Total cash needed
- —
Loan-product check · same deal, 3 products live
Conventional
25% down · 7.5% · 30yr
- Down + closing
- —
- Monthly P&I
- —
- Monthly cashflow
- —
- DSCR
- —
- Eligible?
- —
Personal DTI + credit; lowest rate.
DSCR
20% down · 8.5% · 30yr
- Down + closing
- —
- Monthly P&I
- —
- Monthly cashflow
- —
- DSCR
- —
- Eligible?
- —
No personal income docs; deal must DSCR.
Hard money
10% down · 12.0% · 12mo
- Down + closing
- —
- Monthly P&I
- —
- Monthly cashflow
- —
- DSCR
- —
- Eligible?
- —
Short-term bridge; refi at stabilization.
Rent comps 32 comps
| Address | Beds | Baths | Sqft | Rent | $/sqft | DOM | Units | Dist |
|---|---|---|---|---|---|---|---|---|
| 4818 Kendall Dr Corpus Christi, TX | 2.0 | 1.0 | 1169 | $1,250 | $1.07 | 15d | 1 | 0.17mi |
| 4625 Kostoryz Rd Unit 108 Corpus Christi, TX | 2.0 | 1.0 | 720 | $975 | $1.35 | 45d | 1 | 0.24mi |
| 4241 Green Grove Dr Corpus Christi, TX | 3.0 | 2.0 | 1345 | $1,700 | $1.26 | 45d | 1 | 0.64mi |
| 4322 Kostoryz Rd Corpus Christi, TX | 2.0 | 1.5 | 1100 | $1,259 | $1.14 | 45d | 1 | 0.67mi |
| 4822 Mokry Dr Corpus Christi, TX | 2.0 | 1.0 | 903 | $1,200 | $1.33 | 23d | 1 | 0.68mi |
| 2709 Milo St Corpus Christi, TX | 3.0 | 2.0 | 1122 | $1,700 | $1.52 | 15d | 1 | 0.70mi |
| 4942 Anthony St Corpus Christi, TX | 3.0 | 1.0 | 1014 | $1,595 | $1.57 | 15d | 1 | 0.83mi |
| 4005 Green Grove Dr Corpus Christi, TX | 3.0 | 2.0 | 1406 | $1,695 | $1.21 | 45d | 1 | 0.87mi |
| 4845 Concord St Corpus Christi, TX | 4.0 | 2.0 | 1437 | $1,750 | $1.22 | 15d | 1 | 0.89mi |
| 3738 Marion St Corpus Christi, TX | 3.0 | 1.0 | 1100 | $1,295 | $1.18 | 45d | 1 | 0.96mi |
| 4961 Monitor St Corpus Christi, TX | 2.0 | 1.0 | 725 | $1,150 | $1.59 | 23d | 1 | 0.99mi |
| 1410 Ray Dr Corpus Christi, TX | 3.0 | 1.0 | 1224 | $1,600 | $1.31 | 15d | 1 | 1.04mi |
| 1534 Lazy Ln Corpus Christi, TX | 3.0 | 1.0 | 800 | $1,195 | $1.49 | 23d | 1 | 1.06mi |
| 4322 Fir St Corpus Christi, TX | 2.0 | 1.0 | 758 | $1,195 | $1.58 | 45d | 1 | 1.07mi |
| 5541 Candace St Corpus Christi, TX | 3.0 | 2.0 | 1484 | $1,795 | $1.21 | 15d | 1 | 1.08mi |
| 1522 Cambridge Dr Corpus Christi, TX | 3.0 | 1.5 | 1278 | $1,600 | $1.25 | 45d | 1 | 1.15mi |
| 4326 Vestal St Corpus Christi, TX | 3.0 | 1.0 | 984 | $1,125 | $1.14 | 15d | 1 | 1.18mi |
| 3535 Cottonwood St Apt H2 Corpus Christi, TX | 2.0 | 1.0 | 731 | $870 | $1.19 | 45d | 1 | 1.20mi |
| 5623 Carroll Ln Corpus Christi, TX | 2.0 | 1.0 | 750 | $825 | $1.10 | 45d | 1 | 1.23mi |
| 4002 McArdle Rd Corpus Christi, TX | 3.0 | 1.0 | 1018 | $1,095 | $1.08 | 15d | 1 | 1.24mi |
| 3936 Brushwood Ln Corpus Christi, TX | 2.0 | 1.0 | 900 | $925 | $1.03 | 45d | 1 | 1.27mi |
| 1446 Annapolis Dr Corpus Christi, TX | 3.0 | 2.0 | 1500 | $1,700 | $1.13 | 45d | 1 | 1.27mi |
| 4213 Lowman St Corpus Christi, TX | 2.0 | 1.0 | 810 | $1,195 | $1.48 | 23d | 1 | 1.28mi |
| 2122 Harvard St Corpus Christi, TX | 2.0 | 1.0 | 858 | $1,250 | $1.46 | 15d | 1 | 1.30mi |
| 3620 La Paz Dr Corpus Christi, TX | 2.0 | 1.0 | 875 | $1,195 | $1.37 | 15d | 1 | 1.33mi |
| 2106 Harvard St Corpus Christi, TX | 3.0 | 1.0 | 912 | $1,225 | $1.34 | 45d | 1 | 1.33mi |
| 3102 Crestwater Dr Corpus Christi, TX | 3.0 | 2.0 | 1173 | $1,550 | $1.32 | 45d | 1 | 1.34mi |
| 3619 La Paz Dr Corpus Christi, TX | 2.0 | 1.0 | 903 | $1,195 | $1.32 | 23d | 1 | 1.35mi |
| 2041 Harvard St Corpus Christi, TX | 3.0 | 2.0 | 1230 | $1,400 | $1.14 | 15d | 1 | 1.35mi |
| 5220 Weber Rd Unit G-101 Corpus Christi, TX | 2.0 | 1.5 | 840 | $1,200 | $1.43 | 23d | 1 | 1.37mi |
| 5220 Weber Rd Corpus Christi, TX | 2.0 | 1.0 | 840 | $1,200 | $1.43 | 23d | 1 | 1.38mi |
| 3715 La Paz Dr Corpus Christi, TX | 2.0 | 1.0 | 906 | $1,295 | $1.43 | 15d | 1 | 1.42mi |
Listing history 11 events
-
2026-06-21pricedays on market $99,900 Active 16 DOM
-
2026-06-18days on market $109,900 Active 13 DOM
-
2026-06-17days on market $109,900 Active 12 DOM
-
2026-06-16days on market $109,900 Active 11 DOM
-
2026-06-15pricedays on market $109,900 Active 10 DOM
-
2026-06-14days on market $119,900 Active 8 DOM
-
2026-06-10days on market $119,900 Active 5 DOM
-
2026-06-09days on market $119,900 Active 4 DOM
-
2026-06-08days on market $119,900 Active 3 DOM
-
2026-06-07remarks 159-char remark
-
2026-06-07$119,900 Active 2 DOM
ⓘ Source: listings_history table (triggers on properties + properties_extension) + one-shot
backfill from property_details.listing_events for pre-trigger history.
Tax reassessment forecast TX · Resets to sale price
- Current annual tax
- $2,616 · $218/mo
- Projected year-2 tax
- $2,616 · $218/mo
- Expected delta
- $0/yr ($0/mo · 0.0%)
ⓘ Screening estimate from a state-policy table — verify with the county assessor before closing.
Climate risk First Street
- Flood 1/10 Low FEMA zone X (unshaded) · 0% chance over 30 yrs
- Wildfire 1/10 Low
- Heat 10/10 Extreme 7 d/yr ≥107°F today · 26 d/yr by 30 yrs out
- Wind 9/10 Extreme 99% chance of damaging wind over 30 yrs
- Air quality 1/10 Low 0 unhealthy d/yr today · 0 by 30 yrs out
Nearby sold comps map
Loading sold comps map…
Walkable amenities ~0.75 mi
Loading nearby amenities…
Taxation est. · year 1
- Rental income
- $17,015
- − Mortgage interest
- −$5,596
- − Property taxes
- −$2,616
- − Insurance
- −$500
- − Repairs & maintenance
- −$1,361
- − Management
- −$1,361
- − Depreciation
- −$2,906
- Taxable income
- $2,675
- Est. tax owed @ 24.0%
- −$642
- After-tax cash flow
- $3,398/yr
For passive investors: Depreciation is non-cash, so a rental often shows a tax loss while cash-flowing — sheltering income. Rental losses are passive: they offset passive income freely, and up to $25,000/yr can offset ordinary (W-2) income if you actively participate and your MAGI is under $100k (phasing out to $0 by $150k); unused losses carry forward. On sale, claimed depreciation is recaptured at up to 25%, and gains may owe capital-gains tax (a 1031 exchange can defer both). Figures are a year-1 estimate at your 24.0% rate — not tax advice; consult a CPA.
Schools (NCES district)
- District
- Corpus Christi ISD
- NCES district ID
- 4815270
- Math proficiency
- 31% ▼ -18.00%
- Reading proficiency
- 35% ▼ -7.00%
- Median HH income
- $45,672
- Composite
- 28.27/100
- National rank
- #6793
- State rank
- #562 of 826 in TX
Livability — Corpus Christi
- Score
- 78/100
- State rank
- #66
- US rank
- #2404
Category grades
Schools grade is shown separately in the Schools card above.
Census & demographics
- Census place
- Corpus Christi, TX
- County
- Nueces County · 296,836 people
- City population
- 296,836
- Metro
- Corpus Christi, TX
- Population (ZIP)
- 43,080
- Household income
- $54,990
- Rent vs Own
- Severe rent burden
- 1730.0
Population outlook (Nueces County) Hauer SSP2
- Today (2025)
- 418,037 people
- By 2030
- 447,123 · +7.0%
- By 2040
- 505,911 · +21.0%
- By 2050
- 567,522 · +35.8%
- By 2075
- 729,686 · +74.6%
- By 2100
- 847,087 · +102.6%
Race, ethnicity, and origin ACS 2023
- Neighborhood character
- Predominantly Hispanic (83%)
- Race & ethnicity
- Hispanic / Latino 83% Two or more races 41% White 12% Black 3%
- Hispanic origin (detail)
- Mexican 75%
- Foreign-born
- 9% · Canada
- Languages at home
- 59% English-only · Spanish 40%
Political lean MEDSL · Nueces
- 2024 margin
- R (+11.5) · D 43.8% · R 55.3%
- 2008→2024 swing
- -7.1pp toward R · 2008: -4.4pp · 2024: -11.5pp
- All cycles
- 2024: R+11.5 2020: R+2.9 2016: R+1.5 2012: R+3.2 2008: R+4.4
Not yet ingested
- Civics
- —
Market trends
- HPI YoY
- ▼ -173.20%
- Current HPI
- 158.011
- Rent YoY
- ▲ 2.32%
- Metro
- Corpus Christi, TX
- State GDP YoY
- ▲ 3.95%
- F500 in state
- 110
Industry mix (Fortune 500 HQ in TX)
| Industry | F500 HQs | Revenue |
|---|---|---|
| Energy | 16 | $1,198B |
|
||
| Technology | 5 | $198B |
|
||
| Engineering / Construction | 4 | $72B |
|
||
| Energy Services | 3 | $60B |
|
||
| Utilities | 3 | $41B |
|
||
| Healthcare | 2 | $330B |
|
||
Price history
+100.2% since first listed6 events — show timeline
- 2026-06-03 Listed $119,900 CBMLS
- 2004-10-14 Sold (Public Records) — Public Records
- 2004-10-08 Sold (MLS) — CBMLS
- 2004-08-20 Listed $59,900 CBMLS
- 2003-12-23 Sold (Public Records) — Public Records
- 2003-03-14 Listed $59,900 CBMLS
Property tax history
+5.0%/yrLatest (2025): $2,616 · +11.2% YoY. Source: county tax records.
Cash-flow waterfall
monthlySold comps — $/sqft
last 12 mo · ≤1 miLoading sold comps…