139B Farrington Ct Unit b · Leisure Village, NJ
Flood risk 1/10 · Minimal
- FEMA flood zone
- X (unshaded)
- Chance of flooding over 30 yrs
- 0.0%
- Est. flood insurance / yr
- $507 – $1,088
Fire risk 1/10 · Minimal
- Est. fire insurance / yr
- $526 – $976
Heat risk 6/10 · Moderate
- Hot days now (above 103°F)
- 7 days/yr
- Hot days in 30 yrs
- 15 days/yr
Wind risk 6/10 · Moderate
- Chance of severe wind over 30 yrs
- 68.0%
Air-quality risk 3/10 · Minor
- Unhealthy air days now
- 3 days/yr
- Unhealthy air days in 30 yrs
- 4 days/yr
Risk factors via First Street. Map © Google.
Why this score? — see what drove the C- grade
The composite is a weighted blend of 9 inputs, each scored 0–100. Each bar is that input's sub-score; the figure is the points it added to the 100-point composite (weight × sub-score).
- Cash flow +17.2/30.0
- ARV discount +10.1/15.0
- 1% rule +7.0/10.0
- DSCR +5.4/10.0
- Condition / age +3.8/5.0
- Livability +3.2/5.0
- Rent growth +2.5/5.0
- Schools +1.9/10.0
- Appreciation +0.0/10.0
$175,000
🖨 Deal sheet 📄 Offer letter ✓ Due diligence
Listing remarks MLS
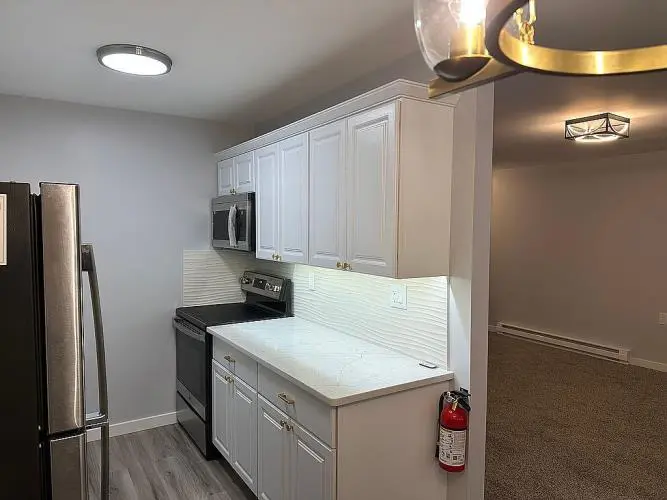
Newly renovated unit. Upgraded kitchen, stainless appliances, Quartz countertop, beautiful marble bathroom, Door to the back , fresh comfortable unit.
Key facts
- Quartz countertop
- Door to the back
- Stainless appliances
Tags
Neighborhood map
What this means for you Summary
Snapshot
- This is a 2-bed/1.0-bath condo listed at $175k. Condition is rated good.
Deal economics
- At list price, monthly cash flow is $125 ($2k/yr) — positive.
- The deal already cash-flows at list — no discount required.
- Meets the 1% rule at list price ($2k rent vs $175k).
- Recommended offer: $159k (9.0% below list) — sets the bar for market timing.
Location & tenants
- Location reads 64/100 on livability (#416 in NJ) — a middle-class / working-renter tenant base. Strengths: housing A+, crime B+, cost of living B; Watch: schools D, amenities F, commute F.
- Lakewood Township School District (suburban): math 17% / reading 28% proficiency, ranked #417 of 472 in NJ (top 88%) — low school quality limits family demand, transient renter base, plan for 1-2y turnover; 82% free/reduced lunch — lower-income household profile, screen leases tightly.
- Market conditions: 419 active listings in the ZIP; 10 comparable units currently listed for rent nearby; rentals at typical pace (median 19d on market — plan ~3-4 weeks tenant-placement turnaround); 4,434 units permitted in Ocean County in 2024 (868 in 5+ unit buildings).
- This rent runs 39% of the median local income ($65k/yr) — at the standard rent-burdened threshold; future hikes will face affordability resistance.
Forward outlook
- Local home prices are declining (-3.0%/yr); year-one equity from $1k of loan paydown is wiped out by about $5k of value loss. Plan a longer hold.
- Ocean County population projected to shrink 8% by 2050 — rents likely to lag national; underwrite the cash flow, not the appreciation.
Negotiation context
- It's been on market 98 days — a 9% lower offer ($159k) is reasonable based on typical stale-listing flexibility.
- 4 sale attempts since 5y ago with the ask held roughly flat each time — persistent listings suggest the price (not the market) is what's stuck; bring a comps-based counter.
- Current owner paid $85k; list at $175k implies a 106% gain — meaningful room to come down on a strong offer.
Risks & watch-outs
- Climate carrying-cost: major wind risk, 68% chance of damaging wind over 30y; extreme-heat days projected 7→15/yr by 2055 (HVAC capex compounding) — expect insurance premiums to compound above CPI over the hold.
Questions for the listing agent
- It's been on market 98 days. Have you received any prior offers? Is the seller open to a 9% concession, seller financing, or rate buy-down credit?
- Built in 1967 — when were the roof, HVAC, electrical panel, plumbing, and water heater last replaced?
- What does the HOA fee cover, when was the last increase, and are there any pending special assessments or reserve-fund shortfalls?
- Any open or pending special assessments — roof, HVAC, plumbing, elevator, façade? What's the per-unit balance and payoff schedule, and is the seller paying it off at close or rolling it to the buyer?
- Why hasn't it sold? Are there any deal-killer items the seller is aware of (foundation, flood, title, zoning, code violations)?
- Is there a deadline driving the sale (1031 exchange, divorce, estate, relocation)? That informs how much negotiation room exists.
- Schools are D-rated, which usually means shorter tenancies and higher turnover. Who's the typical renter profile here, and what's been the actual vacancy rate?
- What's the average days-on-market for RENTAL listings here right now (not sales)? A rising rental-DOM trend means longer vacancies and softer asking-rent achievability than the comps imply.
- What's the recent tenant-quality profile in this submarket — average credit score on applications, eviction rate, late-payment / NSF rate, and stable-employment percentage? A property-management company in the area should have these aggregated.
- How much new apartment / multifamily construction is in the pipeline within 1–3 miles? Heavy new supply (>2% of stock underway) typically softens rents 12–24 months out; light construction supports rent growth.
Investment metrics
- 1% rule
- 1.20% ✓
- Cap rate
- 7.15%
- Cash-on-cash
- 3.06%
- DSCR
- 1.14
- GRM
- 6.9
CMA / ARV
- ARV (median comp)
- $185,544
- List price
- $175,000
- Delta
- -5.68%
- Verdict
- FAIR
- Comps
- 20 within 1.0 mi
Projected returns pro-forma
-3.0% appreciation · 3.0% rent growth · sell at horizon
- IRR
- -11.3%
- Equity multiple
- 0.59×
- Total profit
- $-20,166
- Equity at exit
- $26,093
- IRR
- -1.9%
- Equity multiple
- 0.87×
- Total profit
- $-6,372
- Equity at exit
- $15,131
Cash invested: $49,000 (down + closing). Projections, not guarantees.
Landlord ↔ Tenant lean methodology
- Overall (STATE)
- 21 Tenant-Leaning
- State New Jersey
- 21 Tenant-Leaning · D+6
- County
- — inherits STATE
- City
- — inherits STATE
ZIP-level market 08701
- Active inventory
- 419
- Price-to-rent
- 6.9×
Monthly cashflow live
- Estimated rent
- $2,099 high interval (Pro) →
- Mortgage (P&I)
- −$918
- Tax est. 1.5%
- −$219 /mo · $2,625/yr
- Insurance
- −$73
- HOA est. from 4 same-building comps
- −$324
- Vacancy / Maint / Mgmt
- −$441
- Net cashflow
- $125
Break-even live
UW: 25.0% down · 7.5% · 30yr · 1.5% tax · 5.0% vac · 8.0% maint · 8.0% mgmt
Financing live
Cash to close
- Down payment
- $43,750
- Closing costs
- $5,250
- Reserves months
- —
- Total cash needed
- —
Loan-product check · same deal, 3 products live
Conventional
25% down · 7.5% · 30yr
- Down + closing
- —
- Monthly P&I
- —
- Monthly cashflow
- —
- DSCR
- —
- Eligible?
- —
Personal DTI + credit; lowest rate.
DSCR
20% down · 8.5% · 30yr
- Down + closing
- —
- Monthly P&I
- —
- Monthly cashflow
- —
- DSCR
- —
- Eligible?
- —
No personal income docs; deal must DSCR.
Hard money
10% down · 12.0% · 12mo
- Down + closing
- —
- Monthly P&I
- —
- Monthly cashflow
- —
- DSCR
- —
- Eligible?
- —
Short-term bridge; refi at stabilization.
Rent comps 10 comps
| Address | Beds | Baths | Sqft | Rent | $/sqft | DOM | Units | Dist |
|---|---|---|---|---|---|---|---|---|
| 219 Buckingham Ct Lakewood, NJ | 1.0 | 1.0 | 663 | $1,900 | $2.87 | 43d | 1 | 0.30mi |
| 47L Cambridge Ct Lakewood, NJ | 2.0 | 1.0 | 841 | $1,795 | $2.13 | 24d | 1 | 0.31mi |
| 341B Canterbury Ct Lakewood, NJ | 2.0 | 1.0 | 982 | $2,275 | $2.32 | 22d | 1 | 0.37mi |
| 106A Edinburgh Ln Lakewood, NJ | 2.0 | 1.0 | 858 | $2,200 | $2.56 | 17d | 1 | 0.38mi |
| 335A Canterbury Ct Lakewood, NJ | 2.0 | 1.0 | 982 | $1,950 | $1.99 | 19d | 1 | 0.40mi |
| 278C Kingston Ct Lakewood, NJ | 2.0 | 1.0 | 1000 | $2,250 | $2.25 | 2d | 1 | 0.53mi |
| 1042C Aberdeen Dr Unit C Lakewood, NJ | 2.0 | 1.0 | 982 | $2,000 | $2.04 | 3d | 1 | 1.18mi |
| 1100 Deer Path Lakewood, NJ | 2.0 | 1.0–1.5 | 1187 | $2,575 | $2.17 | 1d | 4 | 1.30mi |
| 824A Balmoral Ct Unit A Toms River, NJ | 2.0 | 1.0 | 982 | $2,200 | $2.24 | 19d | 1 | 1.35mi |
| 829A Balmoral Ct Unit 1001 Lakewood, NJ | 1.0 | 1.0 | 663 | $1,600 | $2.41 | 24d | 1 | 1.40mi |
HOA detail condo
- Monthly dues
- $0 · $0/yr
- Assessments
- None detected in remarks — confirm with the listing agent.
Listing history 22 events
-
2026-06-18days on market $175,000 Active 98 DOM
-
2026-06-17days on market $175,000 Active 97 DOM
-
2026-06-16days on market $175,000 Active 96 DOM
-
2026-06-15days on market $175,000 Active 95 DOM
-
2026-06-13days on market $175,000 Active 93 DOM
-
2026-06-13days on market $175,000 Active 92 DOM
-
2026-06-09days on market $175,000 Active 89 DOM
-
2026-06-08days on market $175,000 Active 88 DOM
-
2026-06-07days on market $175,000 Active 87 DOM
-
2026-06-04days on market $175,000 Active 84 DOM
-
2026-06-03days on market $175,000 Active 83 DOM
-
2026-06-02days on market $175,000 Active 82 DOM
-
2026-06-01days on market $175,000 Active 81 DOM
-
2026-05-31days on market $175,000 Active 80 DOM
-
2026-03-26$175,000 Active
-
2026-03-11$175,000 Active 150-char remark
Show marketing remark (150 chars)
Newly renovated unit. Upgraded kitchen, stainless appliances, Quartz countertop, beautiful marble bathroom, Door to the back , fresh comfortable unit.
-
2026-01-13price $179,000
-
2025-12-22$185,000 Active
-
2021-08-12soldstatus $85,000 Sold
-
2021-08-02historical
-
2021-07-21price $89,900
-
2021-07-06$110,000 Active
ⓘ Source: listings_history table (triggers on properties + properties_extension) + one-shot
backfill from property_details.listing_events for pre-trigger history.
Climate risk First Street
- Flood 1/10 Low FEMA zone X (unshaded) · 0% chance over 30 yrs
- Wildfire 1/10 Low
- Heat 6/10 Major 7 d/yr ≥103°F today · 15 d/yr by 30 yrs out
- Wind 6/10 Major 68% chance of damaging wind over 30 yrs
- Air quality 3/10 Moderate 3 unhealthy d/yr today · 4 by 30 yrs out
Nearby sold comps map
Loading sold comps map…
Walkable amenities ~0.75 mi
Loading nearby amenities…
Taxation est. · year 1
- Rental income
- $25,191
- − Mortgage interest
- −$9,803
- − Property taxes
- −$2,625
- − Insurance
- −$875
- − Repairs & maintenance
- −$2,015
- − Management
- −$2,015
- − HOA
- −$3,888
- − Depreciation
- −$5,091
- Taxable loss
- −$1,122
- Est. tax savings @ 24.0%
- +$269
- After-tax cash flow
- $1,769/yr
For passive investors: Depreciation is non-cash, so a rental often shows a tax loss while cash-flowing — sheltering income. Rental losses are passive: they offset passive income freely, and up to $25,000/yr can offset ordinary (W-2) income if you actively participate and your MAGI is under $100k (phasing out to $0 by $150k); unused losses carry forward. On sale, claimed depreciation is recaptured at up to 25%, and gains may owe capital-gains tax (a 1031 exchange can defer both). Figures are a year-1 estimate at your 24.0% rate — not tax advice; consult a CPA.
Condition & rehab AI · 8 photos
A newly renovated unit with upgraded kitchen and marble bathroom. Good condition with minor cosmetic updates needed for optimal resale and rental value.
Value-add opportunities
- Both Paint the exterior siding — Enhances curb appeal and value
- Both Replace carpet with hardwood flooring — Improves aesthetics and value
- Both Install smart home devices — Enhances convenience and marketability
Renovation cost estimate screening
Value-add ROI direction
- Both Paint the exterior siding — Enhances curb appeal and value ↑
- Both Replace carpet with hardwood flooring — Improves aesthetics and value ↑
- Both Install smart home devices — Enhances convenience and marketability ↑
ⓘ Cost ranges are severity-bucket heuristics (US national rule-of-thumb). Get contractor quotes + a written scope before underwriting a rehab budget.
Schools (NCES district)
- District
- Lakewood Township School District
- NCES district ID
- 3408220
- Math proficiency
- 17% ▼ -4.00%
- Reading proficiency
- 28% ▼ -5.00%
- Median HH income
- $42,301
- Composite
- 19.21/100
- National rank
- #8813
- State rank
- #417 of 472 in NJ
Livability — Leisure Village
- Score
- 64/100
- State rank
- #416
- US rank
- #14624
Category grades
Schools grade is shown separately in the Schools card above.
Census & demographics
- Census place
- Leisure Village, NJ
- County
- Ocean County · 439,426 people
- Metro
- New York-Newark-Jersey City, NY-NJ-PA
- Population (ZIP)
- 139,149
- Household income
- $64,959
- Rent vs Own
- Severe rent burden
- 5757.0
Population outlook (Ocean County) Hauer SSP2
- Today (2025)
- 586,991 people
- By 2030
- 581,403 · -1.0%
- By 2040
- 564,913 · -3.8%
- By 2050
- 538,149 · -8.3%
- By 2075
- 468,845 · -20.1%
- By 2100
- 350,297 · -40.3%
Race, ethnicity, and origin ACS 2023
- Neighborhood character
- Predominantly White (84%)
- Race & ethnicity
- White 84% Hispanic / Latino 11% Two or more races 5% Black 2%
- Hispanic origin (detail)
- Mexican 5% Puerto Rican 2% Dominican 2%
- Common ancestry
- Romanian 6% Italian 5% Scotch-Irish 2%
- Foreign-born
- 8% · Canada, Jamaica
- Languages at home
- 77% English-only · Spanish 9% German/W. Germanic 7% Russian/Polish/Slavic 1%
Political lean MEDSL · Ocean
- 2024 margin
- Solid R (+36.0) · D 31.4% · R 67.4% · Other 1.2%
- 2008→2024 swing
- -17.6pp toward R · 2008: -18.4pp · 2024: -36.0pp
- All cycles
- 2024: R+36.0 2020: R+28.7 2016: R+34.0 2012: R+17.7 2008: R+18.4
Not yet ingested
- Civics
- —
Market trends
- HPI YoY
- ▼ -682.83%
- Current HPI
- 465.344
- Rent YoY
- —
- Metro
- New York-Newark-Jersey City, NY-NJ-PA
- State GDP YoY
- ▲ 2.05%
- F500 in state
- 34
Industry mix (Fortune 500 HQ in NJ)
| Industry | F500 HQs | Revenue |
|---|---|---|
| Consumer Goods | 3 | $31B |
|
||
| Pharmaceuticals | 2 | $153B |
|
||
| Technology | 2 | $21B |
|
||
| Insurance | 2 | $20B |
|
||
| Healthcare | 2 | $19B |
|
||
| Financial Services | 1 | $70B |
|
||
Price history
+59.1% since first listed8 events — show timeline
- 2026-03-26 Listed $175,000 MOMLS
- 2026-03-11 Listed $175,000 Fizber.com
- 2026-01-13 Price Changed $179,000 MOMLS
- 2025-12-22 Listed $185,000 MOMLS
- 2021-08-12 Sold (MLS) $85,000 GSMLS
- 2021-08-02 Delisted — GSMLS
- 2021-07-21 Price Changed $89,900 GSMLS
- 2021-07-06 Listed $110,000 GSMLS
Cash-flow waterfall
monthlySold comps — $/sqft
last 12 mo · ≤1 miLoading sold comps…