 Triplex
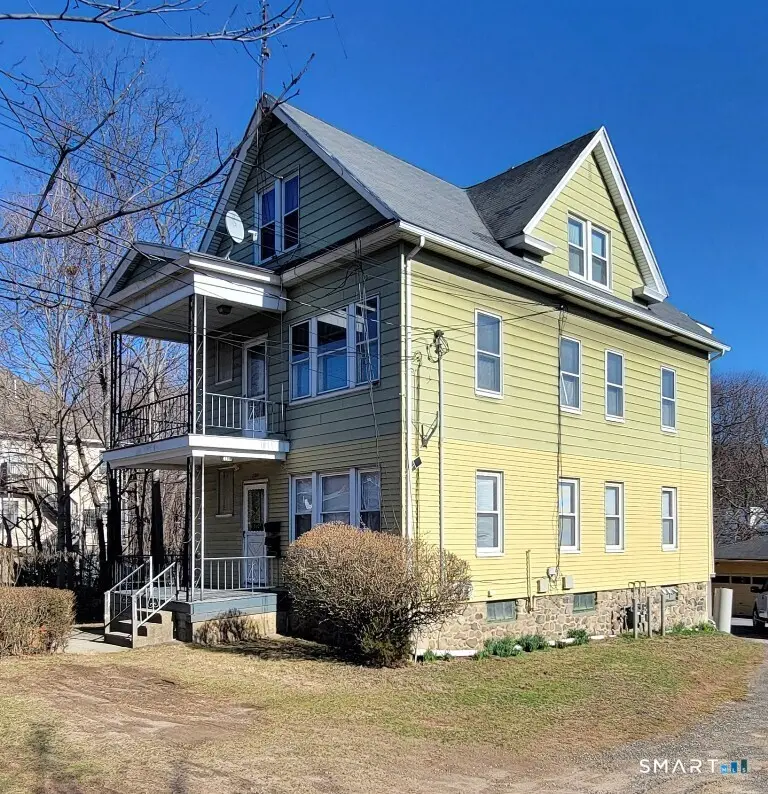
2784 E Main St · Waterbury, CT
Flood risk 1/10 · Minimal
- FEMA flood zone
- X (unshaded)
- Chance of flooding over 30 yrs
- 0.0%
- Est. flood insurance / yr
- $473 – $860
Fire risk 1/10 · Minimal
- Est. fire insurance / yr
- $829 – $1,539
Heat risk 5/10 · Moderate
- Hot days now (above 96°F)
- 7 days/yr
- Hot days in 30 yrs
- 15 days/yr
Wind risk 6/10 · Moderate
- Chance of severe wind over 30 yrs
- 27.0%
Air-quality risk 3/10 · Minor
- Unhealthy air days now
- 2 days/yr
- Unhealthy air days in 30 yrs
- 3 days/yr
Risk factors via First Street. Map © Google.
Why this score? — see what drove the D+ grade
The composite is a weighted blend of 9 inputs, each scored 0–100. Each bar is that input's sub-score; the figure is the points it added to the 100-point composite (weight × sub-score).
- Cash flow +18.0/30.0
- ARV discount +6.8/15.0
- DSCR +5.6/10.0
- 1% rule +5.2/10.0
- Livability +4.0/5.0
- Rent growth +3.3/5.0
- Condition / age +2.5/5.0
- Schools +1.5/10.0
- Appreciation +0.0/10.0
$455,000
🖨 Deal sheet (PDF) 📄 Offer letter ✓ Due diligence
Multi-family units
County records classify this as Multi-Family (2-4 Unit). Listing-text estimate: 3 units. confirmed
Listing remarks
Excellent investment or owner-occupant opportunity! This well-maintained 3-family home is ideally located in the heart of the city's East End, just minutes from Route 84, medical facilities, and within walking distance to schools, shopping and restaurants. All three spacious apartments feature beautiful hardwood floors, eat-in kitchens with ample pantry cabinet storage, along with washer hookups in each unit. Th property also offers plenty of off-street parking, a large private backyard perfect for outdoor enjoyment, and an oversized 2-car garage with multiple storage areas. This is a fantastic opportunity offering both convenience and strong rental potential in a sought-after location.
Key facts
- Eat-in kitchens
- Washer hookups
- East end location
Tags
Property features AI
Finance
- Other: Property located in Connecticut (New Haven County); Nearby amenities include basketball court, commuter bus, medical facilities, park, public transportation, shopping/mall, tennis courts, and walk-to-bus lines; Directions reference: East Main Street
- Financial info: No investor or income/expense details provided
Exterior
- Parking: Detached garage; 2-car garage; Paved and unpaved areas; Off-street parking; Total of 6 parking spaces
- Security: No security features provided
- Utilities: Public water connected; Public sewer connected; Hot water by natural gas; Fuel tank located above ground
- Home design: Multi-family property (3-family); Multi-family for sale
- Construction: Built with frame construction; Stone foundation; Asphalt shingle roof; Yellow and green exterior siding (vinyl and aluminum)
- Exterior features: Enclosed porch and open porch; Level lot
Interior
- Kitchen: No specific appliance details provided
- Bedrooms: 6 total bedrooms
- Flooring: No flooring details provided
- Bathrooms: 3 full bathrooms
- Heating & cooling: Baseboard heating; Heat sources: electric, natural gas, and oil
- Interior features: 16 total rooms; Full basement with storage, interior access, concrete floor and walk-out; Attic with storage space accessible via hatch; Ceiling fans; Window air conditioning units
- Laundry & utility: Basement washer/dryer hook-ups; In-unit hook-up in one unit; Washer/dryer present in some units
Neighborhood map
What this means for you Summary
Snapshot
- This is a 3 × 2-bed/1.0-bath units multifamily listed at $455k.
Deal economics
- At list price, monthly cash flow is $393 ($5k/yr) — positive. Per door: $131/mo.
- The deal already cash-flows at list — no discount required.
- Meets the 1% rule at list price ($5k rent vs $455k).
- Recommended offer: $428k (6.0% below list) — sets the bar for market timing.
- Cap rate 7.3% vs local median 3.6% in Waterbury — top-decile yield for the area; either an underpriced asset or a hidden risk that comps aren't pricing in. Stress-test before assuming the spread holds.
Location & tenants
- Location reads 79/100 on livability (#32 in CT, #2,205 nationally) — a middle-class / working-renter tenant base. Strengths: commute A+, cost of living A+, housing A+; Watch: schools D+, crime D, employment D.
- Waterbury School District (suburban): math 12% / reading 23% proficiency, ranked #148 of 153 in CT (top 97%) — low school quality limits family demand, transient renter base, plan for 1-2y turnover; 73% free/reduced lunch — lower-income household profile, screen leases tightly.
- Market conditions: Rents rising (+3.4%/yr); 82 active listings in the ZIP; 1 comparable units currently listed for rent nearby; 502 units permitted in Naugatuck Valley Planning Region in 2024 (171 in 5+ unit buildings).
- At $4,641/mo this rent would consume 103% of the median local household income ($54k/yr) (locally 1690% of renters already pay >50% of income on rent) — very limited rent-growth headroom before tenants either downsize or default.
Forward outlook
- Local home prices are declining (-3.0%/yr); year-one equity from $3k of loan paydown is wiped out by about $14k of value loss. Plan a longer hold.
Negotiation context
- It's been on market 76 days — a 6% lower offer ($428k) is reasonable based on typical stale-listing flexibility.
Risks & watch-outs
- Watch-outs: built in 1920 — expect roof / HVAC / electrical / plumbing capex.
- Climate carrying-cost: major wind risk, 27% chance of damaging wind over 30y; extreme-heat days projected 7→15/yr by 2055 (HVAC capex compounding) — expect insurance premiums to compound above CPI over the hold.
Questions for the listing agent
- It's been on market 76 days. Have you received any prior offers? Is the seller open to a 6% concession, seller financing, or rate buy-down credit?
- Can we see the unit-by-unit rent roll, current vacancy, and any below-market leases? What's the average tenancy length?
- What capital expenditures (roof, boiler, parking lot, exteriors) have been made in the last 5 years, and what's planned in the next 2?
- Built in 1920 — when were the roof, HVAC, electrical panel, plumbing, and water heater last replaced?
- Why hasn't it sold? Are there any deal-killer items the seller is aware of (foundation, flood, title, zoning, code violations)?
- Is there a deadline driving the sale (1031 exchange, divorce, estate, relocation)? That informs how much negotiation room exists.
- Schools are D-rated, which usually means shorter tenancies and higher turnover. Who's the typical renter profile here, and what's been the actual vacancy rate?
- Crime grade is D in this area — have there been break-ins, vandalism, or insurance claims at this property in the last 3 years? What carrier currently insures it and at what premium?
- The area grade is low — what's the realistic commute time and amenity access for the typical tenant pool here? Any planned neighborhood developments (good or bad) we should know about?
- What's the average days-on-market for RENTAL listings here right now (not sales)? A rising rental-DOM trend means longer vacancies and softer asking-rent achievability than the comps imply.
- What's the recent tenant-quality profile in this submarket — average credit score on applications, eviction rate, late-payment / NSF rate, and stable-employment percentage? A property-management company in the area should have these aggregated.
- How much new apartment / multifamily construction is in the pipeline within 1–3 miles? Heavy new supply (>2% of stock underway) typically softens rents 12–24 months out; light construction supports rent growth.
Investment metrics
- 1% rule
- 1.02% ✓
- Cap rate
- 7.33%
- Cash-on-cash
- 3.70%
- DSCR
- 1.16
- GRM
- 8.2
CMA / ARV
- ARV (on-the-fly)
- $448,119
- Comps found
- 6
Show comp detail 6 sales within ~0.75 mi
| Address | Dist | Beds/Ba | Sqft | Sold | Price | $/sf | Match |
|---|---|---|---|---|---|---|---|
| 92 Glenstone Rd | 0.61mi | 6/2.5 (+1) | 2,499 (+5%) | 1mo | $480,000 | $192 | 55 |
| 2824 E Main St | 0.05mi | 5/2.0 | 2,726 (+15%) | 17mo | $405,000 | $149 | 55 |
| 82 Middlefield Ave | 0.49mi | 6/2.0 (+1) | 2,432 (+3%) | 19mo | $460,000 | $189 | 48 |
| 81 Glenstone Rd | 0.58mi | 6/3.0 (+1) | 2,541 (+7%) | 10mo | $459,000 | $181 | 48 |
| 46 Kramer Ave | 0.29mi | 5/2.0 | 2,102 (-11%) | 24mo | $260,000 | $124 | 44 |
| 54 Vivian Dr | 0.63mi | 6/2.0 (+1) | 2,522 (+6%) | 19mo | $480,000 | $190 | 35 |
Match score weights: distance 35% · size 25% · config 20% · recency 20%. Top-matched comps best support the ARV.
Projected returns pro-forma
-3.0% appreciation · 3.37% rent growth · sell at horizon
- IRR
- -10.0%
- Equity multiple
- 0.63×
- Total profit
- $-46,832
- Equity at exit
- $67,842
- IRR
- -0.1%
- Equity multiple
- 0.99×
- Total profit
- $-795
- Equity at exit
- $39,340
Cash invested: $127,400 (down + closing). Projections, not guarantees.
Landlord ↔ Tenant lean methodology
- Overall (STATE)
- 27 Tenant-Leaning
- State Connecticut
- 27 Tenant-Leaning · D+7
- County
- — inherits STATE
- City
- — inherits STATE
ZIP-level market 06705
- Home prices YoY
- -11.0%
- Rents YoY
- 3.4%
- Active inventory
- 82
- Price-to-rent
- 24.5×
Monthly cashflow live
- Estimated rent
- $4,641 high interval (Pro) →
- Mortgage (P&I)
- −$2,386
- Tax from tax record
- −$698 /mo · $8,376/yr
- Insurance
- −$190
- HOA
- −$0
- Vacancy / Maint / Mgmt
- −$975
- Net cashflow
- $393
Break-even live
Sensitivity live
| Price | -10% $650 | -5% $522 | +0% $393 | +5% $264 | +10% $135 |
|---|---|---|---|---|---|
| Rent | -10% $26 | -5% $209 | +0% $393 | +5% $576 | +10% $759 |
| Rate | -1.0pp $622 | -0.5pp $508 | base $393 | +0.5pp $275 | +1.0pp $155 |
3-unit breakdown (identical units grouped — click to expand)
| Units | Beds | Baths | Est. rent |
|---|---|---|---|
| 3× units | 2 | 1 | $4,641 |
| #1 | 2 | 1 | $1,547 |
| #2 | 2 | 1 | $1,547 |
| #3 | 2 | 1 | $1,547 |
| Total (3 units) | $4,641 | ||
UW: 25.0% down · 7.5% · 30yr · 1.5% tax · 5.0% vac · 8.0% maint · 8.0% mgmt
Financing live
Cash to close
- Down payment
- $113,750
- Closing costs
- $13,650
- Reserves months
- —
- Total cash needed
- —
Loan-product check · same deal, 3 products live
Conventional
25% down · 7.5% · 30yr
- Down + closing
- —
- Monthly P&I
- —
- Monthly cashflow
- —
- DSCR
- —
- Eligible?
- —
Personal DTI + credit; lowest rate.
DSCR
20% down · 8.5% · 30yr
- Down + closing
- —
- Monthly P&I
- —
- Monthly cashflow
- —
- DSCR
- —
- Eligible?
- —
No personal income docs; deal must DSCR.
Hard money
10% down · 12.0% · 12mo
- Down + closing
- —
- Monthly P&I
- —
- Monthly cashflow
- —
- DSCR
- —
- Eligible?
- —
Short-term bridge; refi at stabilization.
Rent comps 1 comps
| Address | Beds | Baths | Sqft | Rent | $/sqft | DOM | Units | Dist |
|---|---|---|---|---|---|---|---|---|
| 14 Niagara St Waterbury, CT | 6.0 | 3.0 | 3156 | $1,700 | $0.54 | 4d | 1 | 1.50mi |
Listing history 6 events
-
2026-06-03statusdays on market $455,000 Under Contract 76 DOM
-
2026-06-03days on market $455,000 Under Contract - Continue to Show 75 DOM
-
2026-06-01days on market $455,000 Under Contract - Continue to Show 74 DOM
-
2026-05-31days on market $455,000 Under Contract - Continue to Show 73 DOM
-
2026-03-30historical Under Contract - Continue to Show
-
2026-03-19$455,000 Active
ⓘ Source: listings_history table (triggers on properties + properties_extension) + one-shot
backfill from property_details.listing_events for pre-trigger history.
Tax reassessment forecast CT · Partial reset (capped growth)
- Current annual tax
- $8,376 · $698/mo
- Projected year-2 tax
- $9,056 · $755/mo
- Expected delta
- +$680/yr (+$57/mo · 8.1%)
ⓘ Screening estimate from a state-policy table — verify with the county assessor before closing.
Climate risk First Street
- Flood 1/10 Low FEMA zone X (unshaded) · 0% chance over 30 yrs
- Wildfire 1/10 Low
- Heat 5/10 Major 7 d/yr ≥96°F today · 15 d/yr by 30 yrs out
- Wind 6/10 Major 27% chance of damaging wind over 30 yrs
- Air quality 3/10 Moderate 2 unhealthy d/yr today · 3 by 30 yrs out
Nearby sold comps map
Loading sold comps map…
Walkable amenities ~0.75 mi
Loading nearby amenities…
Taxation est. · year 1
- Rental income
- $55,692
- − Mortgage interest
- −$25,487
- − Property taxes
- −$8,376
- − Insurance
- −$2,275
- − Repairs & maintenance
- −$4,455
- − Management
- −$4,455
- − Depreciation
- −$13,236
- Taxable loss
- −$2,593
- Est. tax savings @ 24.0%
- +$622
- After-tax cash flow
- $5,335/yr
For passive investors: Depreciation is non-cash, so a rental often shows a tax loss while cash-flowing — sheltering income. Rental losses are passive: they offset passive income freely, and up to $25,000/yr can offset ordinary (W-2) income if you actively participate and your MAGI is under $100k (phasing out to $0 by $150k); unused losses carry forward. On sale, claimed depreciation is recaptured at up to 25%, and gains may owe capital-gains tax (a 1031 exchange can defer both). Figures are a year-1 estimate at your 24.0% rate — not tax advice; consult a CPA.
Schools (NCES district)
- District
- Waterbury School District
- NCES district ID
- 0904830
- Math proficiency
- 12% ▼ -7.00%
- Reading proficiency
- 23% ▼ -8.00%
- Median HH income
- $40,040
- Composite
- 14.85/100
- National rank
- #9380
- State rank
- #148 of 153 in CT
Livability — Waterbury
- Score
- 79/100
- State rank
- #32
- US rank
- #2205
Category grades
Schools grade is shown separately in the Schools card above.
Census & demographics
- Census place
- Waterbury, CT
- County
- New Haven County · 688,236 people
- City population
- 115,012
- Metro
- New Haven-Milford, CT
- Population (ZIP)
- 25,266
- Household income
- $53,954
- Rent vs Own
- Severe rent burden
- 1690.0
Population outlook (Naugatuck Valley County) Hauer SSP2
- By 2040
- 496,846
Race, ethnicity, and origin ACS 2023
- Neighborhood character
- Highly diverse neighborhood (Simpson 0.71)
- Race & ethnicity
- White 34% Hispanic / Latino 34% Black 22% Two or more races 14% Asian 4%
- Hispanic origin (detail)
- Mexican 2% Puerto Rican 22% Dominican 3%
- Common ancestry
- Lithuanian 6% Hispanic 3% Romanian 2%
- Foreign-born
- 19% · Canada, Jamaica, China
- Languages at home
- 66% English-only · Spanish 22% Other Indo-European 6% French/Haitian/Cajun 3%
Political lean MEDSL · Naugatuck Valley
- 2024 margin
- Lean R (+7.4) · D 45.6% · R 53.0% · Other 1.4%
- All cycles
- 2024: R+7.4
Not yet ingested
- Civics
- —
Market trends
- HPI YoY
- ▼ -37.50%
- Current HPI
- 304.4948
- Rent YoY
- ▲ 3.37%
- Metro
- New Haven-Milford, CT
- State GDP YoY
- ▲ 1.06%
- F500 in state
- 38
Industry mix (Fortune 500 HQ in CT)
| Industry | F500 HQs | Revenue |
|---|---|---|
| Industrial Machinery | 4 | $38B |
|
||
| Insurance | 3 | $71B |
|
||
| Financial Services | 2 | $25B |
|
||
| Transportation / Logistics | 2 | $18B |
|
||
| Healthcare | 1 | $247B |
|
||
| Telecommunications | 1 | $55B |
|
||
Price history
2 events — show timeline
- 2026-03-30 Contingent — Smart MLS
- 2026-03-19 Listed $455,000 Smart MLS
Property tax history
+4.0%/yrLatest (2023): $8,376 · +47.0% YoY. Source: county tax records.
Cash-flow waterfall
monthlySold comps — $/sqft
last 12 mo · ≤1 miLoading sold comps…