2844 Prescott St · Corpus Christi, TX
Flood risk 1/10 · Minimal
- FEMA flood zone
- X (unshaded)
- Chance of flooding over 30 yrs
- 0.0%
- Est. flood insurance / yr
- $507 – $1,088
Fire risk 1/10 · Minimal
- Est. fire insurance / yr
- $1,222 – $2,270
Heat risk 10/10 · Severe
- Hot days now (above 107°F)
- 7 days/yr
- Hot days in 30 yrs
- 26 days/yr
Wind risk 9/10 · Severe
- Chance of severe wind over 30 yrs
- 99.0%
Air-quality risk 1/10 · Minimal
- Unhealthy air days now
- 0 days/yr
- Unhealthy air days in 30 yrs
- 0 days/yr
Risk factors via First Street. Map © Google.
Why this score? — see what drove the D+ grade
The composite is a weighted blend of 9 inputs, each scored 0–100. Each bar is that input's sub-score; the figure is the points it added to the 100-point composite (weight × sub-score).
- Cash flow +21.8/30.0
- 1% rule +7.8/10.0
- DSCR +7.0/10.0
- Livability +3.9/5.0
- Rent growth +3.0/5.0
- Schools +2.8/10.0
- Condition / age +2.5/5.0
- ARV discount +0.0/15.0
- Appreciation +0.0/10.0
$85,000
🖨 Deal sheet (PDF) 📄 Offer letter ✓ Due diligence
Listing remarks
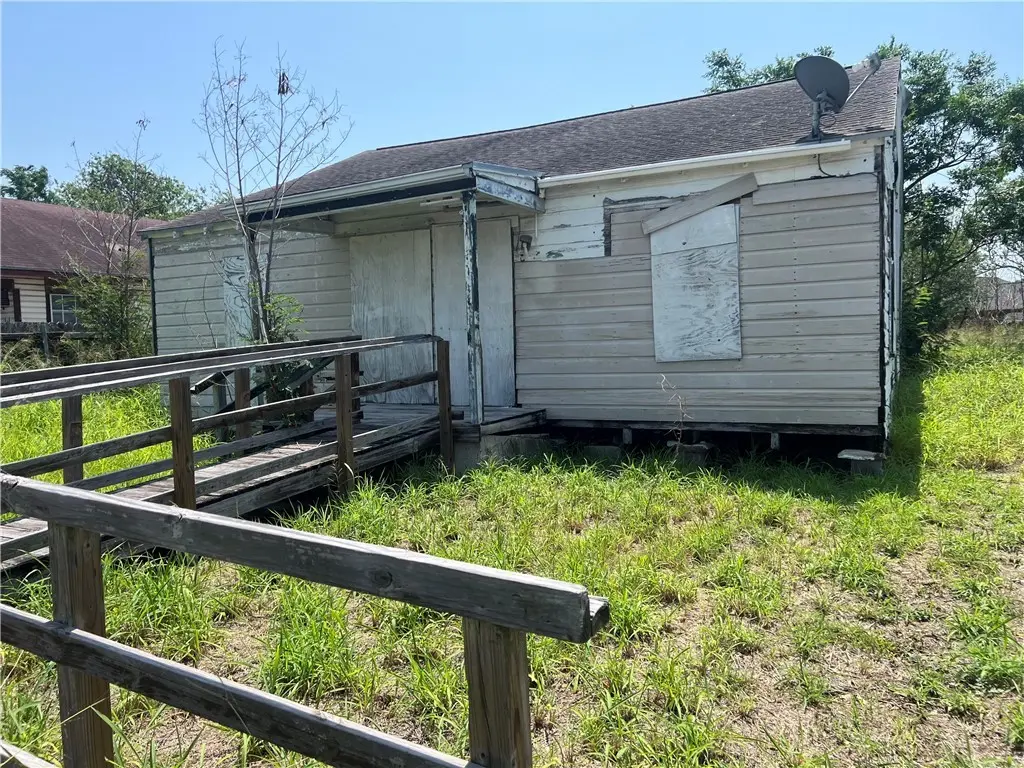
INVESTOR SPECIAL! – Duplex with Value-Add Potential. Great opportunity for investors looking for a value-add property with multiple exit strategies. This duplex needs updating and repairs but strong value add potential. Each unit has the potential to rent for approximately $1,200/month after renovations, creating a solid income-producing asset. Property could also be converted into a spacious 4-bedroom, 2-bath single-home depending on your investment goals.
Key facts
- 6,098 sq ft lot
- Built 1944
- Listed 30 days
Property features AI
Finance
- Other: Interior lot
Exterior
- Home design: Single-story home
- Construction: Wood siding; Shingle roof; Pillar/post/pier and slab foundation
- Exterior features: Open patio
Interior
- Flooring: Hardwood
- Bathrooms: 1 full bathroom
- Interior features: Hardwood flooring; No additional interior features listed
Neighborhood map
What this means for you Summary
Snapshot
- This is a 2-bed/1.0-bath single-family listed at $85k.
Deal economics
- At list price, monthly cash flow is $133 ($2k/yr) — positive.
- The deal already cash-flows at list — no discount required.
- Meets the 1% rule at list price ($1k rent vs $85k).
- Recommended offer: $82k (3.0% below list) — sets the bar for market timing.
- Cap rate 8.2% vs local median 3.6% in Corpus Christi — top-decile yield for the area; either an underpriced asset or a hidden risk that comps aren't pricing in. Stress-test before assuming the spread holds.
Location & tenants
- Location reads 78/100 on livability (#66 in TX, #2,404 nationally) — a middle-class / working-renter tenant base. Strengths: commute A+, cost of living A+, housing A+; Watch: crime F.
- Corpus Christi ISD (urban): math 31% / reading 35% proficiency, ranked #562 of 826 in TX (top 68%) — families likely to look elsewhere, expect single-tenant / working-renter base with shorter leases; 63% free/reduced lunch — lower-income household profile, screen leases tightly.
- Zoned schools: Windsor Park G/T (math 85% / reading 90%, grade A+, #6 of 4,322 statewide, top 0%, 609 students, 29% FRL); Adkins Middle (math 40% / reading 39%, grade F, #660 of 1,662 statewide, top 41%, 956 students, 48% FRL); Ray H S (math 49% / reading 47%, grade D, #571 of 1,632 statewide, top 36%, 1,640 students, 69% FRL).
- Zoned-school proficiency averages 58% at this address vs 33% district-wide (+25 pts) — the actual schools serving this property are materially stronger than the Corpus Christi ISD average implies; a family-tenant draw the district grade alone would hide.
- Market conditions: Rents rising (+1.9%/yr); 146 active listings in the ZIP; 23 comparable units currently listed for rent nearby; rentals lingering (median 45d on market — plan ~5-8 weeks vacancy on turnover, expect pricing pressure); 74% of comp listings sitting > 30 days — soft ceiling on asking rent; 1,397 units permitted in Nueces County in 2024 (47 in 5+ unit buildings).
Forward outlook
- Local home prices are declining (-3.0%/yr); year-one equity from $588 of loan paydown is wiped out by about $3k of value loss. Plan a longer hold.
- Nueces County population projected at +36% by 2050 — long-run rental-demand tailwind backs the buy-and-hold thesis.
Negotiation context
- It's been on market 31 days — a 3% lower offer ($82k) is reasonable based on typical stale-listing flexibility.
- Current owner paid $17k; list at $85k implies a 409% gain — meaningful room to come down on a strong offer.
Risks & watch-outs
- Watch-outs: property tax is 3.5% of price; built in 1944 — expect roof / HVAC / electrical / plumbing capex.
- Climate carrying-cost: severe wind risk, 99% chance of damaging wind over 30y; extreme-heat days projected 7→26/yr by 2055 (HVAC capex compounding) — expect insurance premiums to compound above CPI over the hold.
Questions for the listing agent
- It's been on market 31 days. Have you received any prior offers? Is the seller open to a 3% concession, seller financing, or rate buy-down credit?
- Built in 1944 — when were the roof, HVAC, electrical panel, plumbing, and water heater last replaced?
- Property tax is high relative to price — has the assessment been appealed recently, and will the sale trigger a re-assessment?
- Is there a deadline driving the sale (1031 exchange, divorce, estate, relocation)? That informs how much negotiation room exists.
- Crime grade is F in this area — have there been break-ins, vandalism, or insurance claims at this property in the last 3 years? What carrier currently insures it and at what premium?
- The area grade is low — what's the realistic commute time and amenity access for the typical tenant pool here? Any planned neighborhood developments (good or bad) we should know about?
- What's the average days-on-market for RENTAL listings here right now (not sales)? A rising rental-DOM trend means longer vacancies and softer asking-rent achievability than the comps imply.
- What's the recent tenant-quality profile in this submarket — average credit score on applications, eviction rate, late-payment / NSF rate, and stable-employment percentage? A property-management company in the area should have these aggregated.
- How much new for-sale + rental construction is in the pipeline within 1–3 miles? Heavy new supply typically softens prices + rents 12–24 months out; constrained supply supports both.
Investment metrics
- 1% rule
- 1.28% ✓
- Cap rate
- 8.17%
- Cash-on-cash
- 6.71%
- DSCR
- 1.30
- GRM
- 6.5
CMA / ARV
- ARV (on-the-fly)
- $61,056
- Comps found
- 3
Show comp detail 3 sales within ~0.75 mi
| Address | Dist | Beds/Ba | Sqft | Sold | Price | $/sf | Match |
|---|---|---|---|---|---|---|---|
| 2534 Tarlton St | 0.43mi | 2/1.0 | 595 (+3%) | 14mo | $60,000 | $101 | 63 |
| 3237 Eisenhower St | 0.68mi | 2/1.0 | 611 (+6%) | 4mo | $65,000 | $106 | 55 |
| 2750 Nogales St | 0.72mi | 2/1.0 | 660 (+15%) | 19mo | $109,900 | $167 | 26 |
Match score weights: distance 35% · size 25% · config 20% · recency 20%. Top-matched comps best support the ARV.
Projected returns pro-forma
-3.0% appreciation · 1.87% rent growth · sell at horizon
- IRR
- -7.4%
- Equity multiple
- 0.73×
- Total profit
- $-6,426
- Equity at exit
- $12,674
- IRR
- 0.5%
- Equity multiple
- 1.03×
- Total profit
- $812
- Equity at exit
- $7,349
Cash invested: $23,800 (down + closing). Projections, not guarantees.
Landlord ↔ Tenant lean methodology
- Overall (STATE)
- 87 Strongly Landlord-Friendly
- State Texas
- 87 Strongly Landlord-Friendly · R+5
- County
- — inherits STATE
- City
- — inherits STATE
ZIP-level market 78404
- Rents YoY
- 1.9%
- Active inventory
- 146
- Price-to-rent
- 6.5×
Monthly cashflow live
- Estimated rent
- $1,091 high interval (Pro) →
- Mortgage (P&I)
- −$446
- Tax from tax record
- −$248 /mo · $2,974/yr
- Insurance
- −$35
- HOA
- −$0
- Vacancy / Maint / Mgmt
- −$229
- Net cashflow
- $133
Break-even live
Sensitivity live
| Price | -10% $181 | -5% $157 | +0% $133 | +5% $109 | +10% $85 |
|---|---|---|---|---|---|
| Rent | -10% $47 | -5% $90 | +0% $133 | +5% $176 | +10% $219 |
| Rate | -1.0pp $176 | -0.5pp $155 | base $133 | +0.5pp $111 | +1.0pp $89 |
UW: 25.0% down · 7.5% · 30yr · 1.5% tax · 5.0% vac · 8.0% maint · 8.0% mgmt
Financing live
Cash to close
- Down payment
- $21,250
- Closing costs
- $2,550
- Reserves months
- —
- Total cash needed
- —
Loan-product check · same deal, 3 products live
Conventional
25% down · 7.5% · 30yr
- Down + closing
- —
- Monthly P&I
- —
- Monthly cashflow
- —
- DSCR
- —
- Eligible?
- —
Personal DTI + credit; lowest rate.
DSCR
20% down · 8.5% · 30yr
- Down + closing
- —
- Monthly P&I
- —
- Monthly cashflow
- —
- DSCR
- —
- Eligible?
- —
No personal income docs; deal must DSCR.
Hard money
10% down · 12.0% · 12mo
- Down + closing
- —
- Monthly P&I
- —
- Monthly cashflow
- —
- DSCR
- —
- Eligible?
- —
Short-term bridge; refi at stabilization.
Rent comps 23 comps
| Address | Beds | Baths | Sqft | Rent | $/sqft | DOM | Units | Dist |
|---|---|---|---|---|---|---|---|---|
| 3150 Elgin St Corpus Christi, TX | 2.0 | 1.0 | 616 | $925 | $1.50 | 45d | 1 | 0.70mi |
| 1808 Morgan Ave Corpus Christi, TX | 1.0 | 1.0 | 667 | $975 | $1.46 | 45d | 1 | 0.83mi |
| 1802 Morgan Ave Unit 1804 Corpus Christi, TX | 1.0 | 1.0 | 667 | $695 | $1.04 | 45d | 1 | 0.83mi |
| 1114 25th St Corpus Christi, TX | 1.0–2.0 | 1.0 | 712 | $1,050 | $1.47 | 15d | 6 | 0.86mi |
| 1800 S Staples St Corpus Christi, TX | 1.0 | 1.0 | 585 | $1,015 | $1.74 | 45d | 1 | 0.90mi |
| 815 Ohio Ave Unit 3 Corpus Christi, TX | 2.0 | 1.0 | 748 | $985 | $1.32 | 45d | 1 | 0.97mi |
| 637 Mohawk St Unit MA4 Corpus Christi, TX | 1.0 | 1.0 | 500 | $630 | $1.26 | 45d | 1 | 0.99mi |
| 801 18th St Corpus Christi, TX | 1.0 | 1.0 | 600 | $895 | $1.49 | 22d | 1 | 1.09mi |
| 2937 Ruth St Corpus Christi, TX | 2.0 | 1.0 | 676 | $950 | $1.41 | 45d | 1 | 1.10mi |
| 1124 Morgan Ave Unit 1268437P Corpus Christi, TX | 2.0 | 1.0 | 721 | $2,081 | $2.89 | 45d | 1 | 1.11mi |
| 510 Cheyenne St Corpus Christi, TX | 1.0 | 1.0 | 420 | $699 | $1.66 | 45d | 1 | 1.12mi |
| 1112 Morgan Ave Unit 1268432P Corpus Christi, TX | 1.0 | 1.0 | 656 | $1,632 | $2.49 | 45d | 1 | 1.12mi |
| 1116 Morgan Ave Unit 1268424P Corpus Christi, TX | 1.0 | 1.0 | 656 | $1,454 | $2.22 | 45d | 1 | 1.13mi |
| 1116 Morgan Ave Unit 1268439P Corpus Christi, TX | 1.0 | 1.0 | 656 | $1,743 | $2.66 | 45d | 1 | 1.13mi |
| 1402 Devon Dr Corpus Christi, TX | 1.0 | 1.0 | 540 | $795 | $1.47 | 15d | 1 | 1.29mi |
| 821 S Alameda St Unit 1 Corpus Christi, TX | 1.0 | 1.0 | 480 | $970 | $2.02 | 45d | 1 | 1.31mi |
| 1005 Furman Ave #2 Corpus Christi, TX | 1.0 | 1.0 | 480 | $995 | $2.07 | 45d | 1 | 1.39mi |
| 826 Hancock Ave Unit 1 Corpus Christi, TX | 1.0 | 1.0 | 700 | $850 | $1.21 | 22d | 1 | 1.41mi |
| 826 Hancock Ave Unit 3 Corpus Christi, TX | 1.0 | 1.0 | 700 | $800 | $1.14 | 22d | 1 | 1.41mi |
| 3115 Agnes St Corpus Christi, TX | 2.0 | 1.0 | 428 | $828 | $1.93 | 45d | 3 | 1.41mi |
| 901 Furman Ave Unit F Corpus Christi, TX | 1.0 | 1.0 | 560 | $700 | $1.25 | 45d | 1 | 1.43mi |
| 901 Furman Ave Unit B Corpus Christi, TX | 1.0 | 1.0 | 659 | $750 | $1.14 | 22d | 1 | 1.43mi |
| 901 Furman Ave Unit D Corpus Christi, TX | 1.0 | 1.0 | 521 | $850 | $1.63 | 45d | 1 | 1.43mi |
Listing history 20 events
-
2026-06-21days on market $85,000 Active 31 DOM
-
2026-06-18days on market $85,000 Active 28 DOM
-
2026-06-17days on market $85,000 Active 27 DOM
-
2026-06-16days on market $85,000 Active 26 DOM
-
2026-06-15days on market $85,000 Active 25 DOM
-
2026-06-14days on market $85,000 Active 23 DOM
-
2026-06-10days on market $85,000 Active 20 DOM
-
2026-06-09days on market $85,000 Active 19 DOM
-
2026-06-08days on market $85,000 Active 18 DOM
-
2026-06-07days on market $85,000 Active 17 DOM
-
2026-06-05days on market $85,000 Active 14 DOM
-
2026-06-03days on market $85,000 Active 13 DOM
-
2026-06-02days on market $85,000 Active 12 DOM
-
2026-06-01days on market $85,000 Active 11 DOM
-
2026-05-31days on market $85,000 Active 10 DOM
-
2026-05-30days on market $85,000 Active 9 DOM
-
2026-05-21$85,000 Active
-
2015-03-27soldstatus
-
2006-05-03soldstatus
-
1989-05-09soldstatus $16,700
ⓘ Source: listings_history table (triggers on properties + properties_extension) + one-shot
backfill from property_details.listing_events for pre-trigger history.
Tax reassessment forecast TX · Resets to sale price
- Current annual tax
- $2,974 · $248/mo
- Projected year-2 tax
- $2,974 · $248/mo
- Expected delta
- $0/yr ($0/mo · 0.0%)
ⓘ Screening estimate from a state-policy table — verify with the county assessor before closing.
Climate risk First Street
- Flood 1/10 Low FEMA zone X (unshaded) · 0% chance over 30 yrs
- Wildfire 1/10 Low
- Heat 10/10 Extreme 7 d/yr ≥107°F today · 26 d/yr by 30 yrs out
- Wind 9/10 Extreme 99% chance of damaging wind over 30 yrs
- Air quality 1/10 Low 0 unhealthy d/yr today · 0 by 30 yrs out
Nearby sold comps map
Loading sold comps map…
Walkable amenities ~0.75 mi
Loading nearby amenities…
Taxation est. · year 1
- Rental income
- $13,094
- − Mortgage interest
- −$4,761
- − Property taxes
- −$2,974
- − Insurance
- −$425
- − Repairs & maintenance
- −$1,048
- − Management
- −$1,048
- − Depreciation
- −$2,473
- Taxable income
- $366
- Est. tax owed @ 24.0%
- −$88
- After-tax cash flow
- $1,508/yr
For passive investors: Depreciation is non-cash, so a rental often shows a tax loss while cash-flowing — sheltering income. Rental losses are passive: they offset passive income freely, and up to $25,000/yr can offset ordinary (W-2) income if you actively participate and your MAGI is under $100k (phasing out to $0 by $150k); unused losses carry forward. On sale, claimed depreciation is recaptured at up to 25%, and gains may owe capital-gains tax (a 1031 exchange can defer both). Figures are a year-1 estimate at your 24.0% rate — not tax advice; consult a CPA.
Schools (NCES district)
- District
- Corpus Christi ISD
- NCES district ID
- 4815270
- Math proficiency
- 31% ▼ -18.00%
- Reading proficiency
- 35% ▼ -7.00%
- Median HH income
- $45,672
- Composite
- 28.27/100
- National rank
- #6793
- State rank
- #562 of 826 in TX
Livability — Corpus Christi
- Score
- 78/100
- State rank
- #66
- US rank
- #2404
Category grades
Schools grade is shown separately in the Schools card above.
Census & demographics
- Census place
- Corpus Christi, TX
- County
- Nueces County · 296,836 people
- City population
- 296,836
- Metro
- Corpus Christi, TX
- Population (ZIP)
- 12,635
- Household income
- $61,280
- Rent vs Own
- Severe rent burden
- 596.0
Population outlook (Nueces County) Hauer SSP2
- Today (2025)
- 418,037 people
- By 2030
- 447,123 · +7.0%
- By 2040
- 505,911 · +21.0%
- By 2050
- 567,522 · +35.8%
- By 2075
- 729,686 · +74.6%
- By 2100
- 847,087 · +102.6%
Race, ethnicity, and origin ACS 2023
- Neighborhood character
- Majority Hispanic (62%)
- Race & ethnicity
- Hispanic / Latino 62% White 32% Two or more races 29% Black 4%
- Hispanic origin (detail)
- Mexican 56%
- Common ancestry
- Slovak 3% Italian 2% Lithuanian 1%
- Foreign-born
- 9% · Canada
- Languages at home
- 61% English-only · Spanish 39%
Political lean MEDSL · Nueces
- 2024 margin
- R (+11.5) · D 43.8% · R 55.3%
- 2008→2024 swing
- -7.1pp toward R · 2008: -4.4pp · 2024: -11.5pp
- All cycles
- 2024: R+11.5 2020: R+2.9 2016: R+1.5 2012: R+3.2 2008: R+4.4
Not yet ingested
- Civics
- —
Market trends
- HPI YoY
- ▼ -211.10%
- Current HPI
- 177.4759
- Rent YoY
- ▲ 1.87%
- Metro
- Corpus Christi, TX
- State GDP YoY
- ▲ 3.95%
- F500 in state
- 110
Industry mix (Fortune 500 HQ in TX)
| Industry | F500 HQs | Revenue |
|---|---|---|
| Energy | 16 | $1,198B |
|
||
| Technology | 5 | $198B |
|
||
| Engineering / Construction | 4 | $72B |
|
||
| Energy Services | 3 | $60B |
|
||
| Utilities | 3 | $41B |
|
||
| Healthcare | 2 | $330B |
|
||
Price history
+409.0% since first listed4 events — show timeline
- 2026-05-21 Listed $85,000 CBMLS
- 2015-03-27 Sold (Public Records) — Public Records
- 2006-05-03 Sold (Public Records) — Public Records
- 1989-05-09 Sold (Public Records) $16,700 Public Records
Property tax history
+6.6%/yrLatest (2025): $2,974 · +22.1% YoY. Source: county tax records.
Cash-flow waterfall
monthlySold comps — $/sqft
last 12 mo · ≤1 miLoading sold comps…