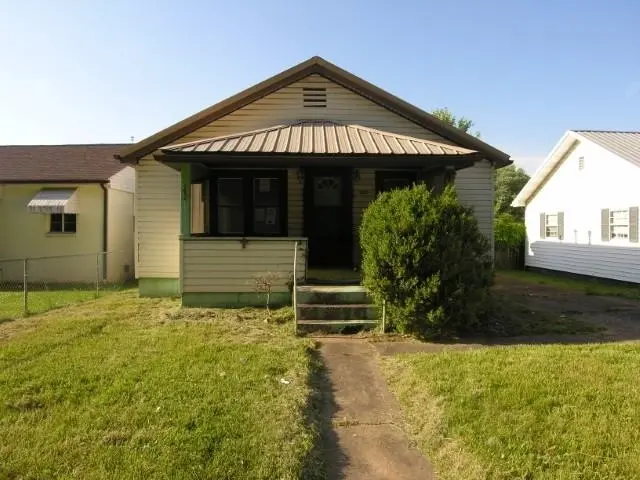
3610 Riverside Dr · Huntington, WV
Flood risk 1/10 · Minimal
- FEMA flood zone
- X
- Chance of flooding over 30 yrs
- 0.0%
- Est. flood insurance / yr
- $507 – $1,088
Fire risk 4/10 · Minor
- Est. fire insurance / yr
- $787 – $1,461
Heat risk 5/10 · Moderate
- Hot days now (above 102°F)
- 7 days/yr
- Hot days in 30 yrs
- 19 days/yr
Wind risk 2/10 · Minimal
- Chance of severe wind over 30 yrs
- 1.0%
Air-quality risk 2/10 · Minimal
- Unhealthy air days now
- 0 days/yr
- Unhealthy air days in 30 yrs
- 1 days/yr
Risk factors via First Street. Map © Google.
Why this score? — see what drove the B+ grade
The composite is a weighted blend of 9 inputs, each scored 0–100. Each bar is that input's sub-score; the figure is the points it added to the 100-point composite (weight × sub-score).
- Cash flow +30.0/30.0
- ARV discount +13.2/15.0
- 1% rule +10.0/10.0
- DSCR +10.0/10.0
- Livability +4.0/5.0
- Schools +3.0/10.0
- Rent growth +2.5/5.0
- Condition / age +2.5/5.0
- Appreciation +0.0/10.0
$44,900
🖨 Deal sheet (PDF) 📄 Offer letter ✓ Due diligence
Listing remarks
Altizer Rancher With deep 200 Foot Lot Parking in alley as well. Two Out Buildings Country Front Porch, Offering Living room, Big Owners bedroom with closet, 2 bedrooms, Full bath, Metal Roof Gas HWT, Windows were replaced, Central AC Wiring Box at Back Door. Near Altizer School Inside the Flood wall. Off street Parking in Front as well. Seller will look at offers 7 days after listed.
Key facts
- Metal roof
- Deep 200 foot lot
- Parking in alley
Tags
Property features AI
Finance
- Other: Directions: Riverside Drive on Main Drive
Exterior
- Parking: Off-street parking
- Utilities: Public water; Public sewer
- Home design: Single-family residence; Single-story
- Construction: Vinyl and wood siding; Metal roof
- Exterior features: Front porch; Storm door(s); Chain link fencing; Level lot
Interior
- Kitchen: Refrigerator
- Bathrooms: 1 full bathroom
- Heating & cooling: Electric central heating
- Interior features: Insulated windows; Crawl space basement
Neighborhood map
What this means for you Summary
Snapshot
- This is a 2-bed/1.0-bath single-family listed at $45k.
Deal economics
- At list price, monthly cash flow is $612 ($7k/yr) — positive.
- The deal already cash-flows at list — no discount required.
- Meets the 1% rule at list price ($1k rent vs $45k).
- Cap rate 22.6% vs local median 6.4% in Huntington — top-decile yield for the area; either an underpriced asset or a hidden risk that comps aren't pricing in. Stress-test before assuming the spread holds.
Location & tenants
- Location reads 79/100 on livability (#16 in WV, #2,045 nationally) — a middle-class / working-renter tenant base. Strengths: amenities A+, commute A+, cost of living A+; Watch: crime F, employment F.
- Cabell County Schools (urban): math 31% / reading 42% proficiency, ranked #13 of 55 in WV (top 24%) — families likely to look elsewhere, expect single-tenant / working-renter base with shorter leases.
- Zoned schools: Altizer Elementary School (math 32% / reading 37%, grade F, #148 of 377 statewide, top 49%, 202 students, 0% FRL); Huntington East Middle School (math 18% / reading 32%, grade F, #81 of 109 statewide, top 76%, 585 students, 0% FRL); Huntington High School (math 26% / reading 50%, grade F, #31 of 110 statewide, top 28%, 1,704 students, 0% FRL) — zoned schools average 0% FRL vs 47% district-wide (47 pts lower); this property's tenant base skews higher-income than the district average.
- Market conditions: 164 active listings in the ZIP; 61 units permitted in Cabell County in 2024 (5 in 5+ unit buildings).
Forward outlook
- Local home prices are declining (-3.0%/yr); year-one equity from $310 of loan paydown is wiped out by about $1k of value loss. Plan a longer hold.
- At projected returns (-3.0% appreciation + 3.0% rent growth), your $13k cash investment doubles in ~2 years — after that, you're playing with house money.
Negotiation context
- Only 8 days on market — expect competitive offers; lowballing is unlikely to land.
Risks & watch-outs
- Watch-outs: built in 1950 — expect roof / HVAC / electrical / plumbing capex.
- Climate carrying-cost: extreme-heat days projected 7→19/yr by 2055 (HVAC capex compounding) — expect insurance premiums to compound above CPI over the hold.
Questions for the listing agent
- Built in 1950 — when were the roof, HVAC, electrical panel, plumbing, and water heater last replaced?
- Is there a deadline driving the sale (1031 exchange, divorce, estate, relocation)? That informs how much negotiation room exists.
- Crime grade is F in this area — have there been break-ins, vandalism, or insurance claims at this property in the last 3 years? What carrier currently insures it and at what premium?
- What's the average days-on-market for RENTAL listings here right now (not sales)? A rising rental-DOM trend means longer vacancies and softer asking-rent achievability than the comps imply.
- What's the recent tenant-quality profile in this submarket — average credit score on applications, eviction rate, late-payment / NSF rate, and stable-employment percentage? A property-management company in the area should have these aggregated.
- How much new for-sale + rental construction is in the pipeline within 1–3 miles? Heavy new supply typically softens prices + rents 12–24 months out; constrained supply supports both.
Investment metrics
- 1% rule
- 2.70% ✓
- Cap rate
- 22.64%
- Cash-on-cash
- 58.40%
- DSCR
- 3.60
- GRM
- 3.1
CMA / ARV
- ARV (on-the-fly)
- $51,414
- Comps found
- 5
Show comp detail 5 sales within ~0.75 mi
| Address | Dist | Beds/Ba | Sqft | Sold | Price | $/sf | Match |
|---|---|---|---|---|---|---|---|
| 3632 R Riverside Dr | 0.03mi | 2/1.0 | 868 (-4%) | 2mo | $8,500 | $10 | 90 |
| 3616 Crane Ave | 0.09mi | 2/1.0 | 952 (+6%) | 7mo | $123,500 | $130 | 81 |
| 1124 Norway Ave | 0.43mi | 2/1.0 | 916 (+2%) | 12mo | $52,000 | $57 | 68 |
| 305 Lawson Hts | 0.47mi | 3/1.0 (+1) | 925 (+2%) | 16mo | $115,520 | $125 | 56 |
| 3316 River Ave | 0.38mi | 2/1.0 | 1,014 (+12%) | 21mo | $25,000 | $25 | 44 |
Match score weights: distance 35% · size 25% · config 20% · recency 20%. Top-matched comps best support the ARV.
Projected returns pro-forma
-3.0% appreciation · 3.0% rent growth · sell at horizon
- IRR
- 57.0%
- Equity multiple
- 3.52×
- Total profit
- $31,733
- Equity at exit
- $6,695
- IRR
- 61.9%
- Equity multiple
- 7.20×
- Total profit
- $77,975
- Equity at exit
- $3,882
Cash invested: $12,572 (down + closing). Projections, not guarantees.
Landlord ↔ Tenant lean methodology
- Overall (STATE)
- 83 Strongly Landlord-Friendly
- State West Virginia
- 83 Strongly Landlord-Friendly · R+22
- County
- — inherits STATE
- City
- — inherits STATE
ZIP-level market 25705
- Home prices YoY
- -24.9%
- Active inventory
- 164
- Price-to-rent
- 3.1×
Monthly cashflow live
- Estimated rent
- $1,213 medium interval (Pro) →
- Mortgage (P&I)
- −$235
- Tax from tax record
- −$93 /mo · $1,110/yr
- Insurance
- −$19
- HOA
- −$0
- Vacancy / Maint / Mgmt
- −$255
- Net cashflow
- $612
Break-even live
Sensitivity live
| Price | -10% $637 | -5% $625 | +0% $612 | +5% $599 | +10% $586 |
|---|---|---|---|---|---|
| Rent | -10% $516 | -5% $564 | +0% $612 | +5% $660 | +10% $708 |
| Rate | -1.0pp $634 | -0.5pp $623 | base $612 | +0.5pp $600 | +1.0pp $588 |
UW: 25.0% down · 7.5% · 30yr · 1.5% tax · 5.0% vac · 8.0% maint · 8.0% mgmt
Financing live
Cash to close
- Down payment
- $11,225
- Closing costs
- $1,347
- Reserves months
- —
- Total cash needed
- —
Loan-product check · same deal, 3 products live
Conventional
25% down · 7.5% · 30yr
- Down + closing
- —
- Monthly P&I
- —
- Monthly cashflow
- —
- DSCR
- —
- Eligible?
- —
Personal DTI + credit; lowest rate.
DSCR
20% down · 8.5% · 30yr
- Down + closing
- —
- Monthly P&I
- —
- Monthly cashflow
- —
- DSCR
- —
- Eligible?
- —
No personal income docs; deal must DSCR.
Hard money
10% down · 12.0% · 12mo
- Down + closing
- —
- Monthly P&I
- —
- Monthly cashflow
- —
- DSCR
- —
- Eligible?
- —
Short-term bridge; refi at stabilization.
Listing history 1 events
-
2026-05-20$44,900 Active
ⓘ Source: listings_history table (triggers on properties + properties_extension) + one-shot
backfill from property_details.listing_events for pre-trigger history.
Tax reassessment forecast WV · Resets to sale price
- Current annual tax
- $1,110 · $93/mo
- Projected year-2 tax
- $1,110 · $93/mo
- Expected delta
- $0/yr ($0/mo · 0.0%)
ⓘ Screening estimate from a state-policy table — verify with the county assessor before closing.
Climate risk First Street
- Flood 1/10 Low FEMA zone X · 0% chance over 30 yrs
- Wildfire 4/10 Moderate
- Heat 5/10 Major 7 d/yr ≥102°F today · 19 d/yr by 30 yrs out
- Wind 2/10 Low 100% chance of damaging wind over 30 yrs
- Air quality 2/10 Low 0 unhealthy d/yr today · 1 by 30 yrs out
Nearby sold comps map
Loading sold comps map…
Walkable amenities ~0.75 mi
Loading nearby amenities…
Taxation est. · year 1
- Rental income
- $14,560
- − Mortgage interest
- −$2,515
- − Property taxes
- −$1,110
- − Insurance
- −$224
- − Repairs & maintenance
- −$1,165
- − Management
- −$1,165
- − Depreciation
- −$1,306
- Taxable income
- $7,074
- Est. tax owed @ 24.0%
- −$1,698
- After-tax cash flow
- $5,644/yr
For passive investors: Depreciation is non-cash, so a rental often shows a tax loss while cash-flowing — sheltering income. Rental losses are passive: they offset passive income freely, and up to $25,000/yr can offset ordinary (W-2) income if you actively participate and your MAGI is under $100k (phasing out to $0 by $150k); unused losses carry forward. On sale, claimed depreciation is recaptured at up to 25%, and gains may owe capital-gains tax (a 1031 exchange can defer both). Figures are a year-1 estimate at your 24.0% rate — not tax advice; consult a CPA.
Schools (NCES district)
- District
- Cabell County Schools
- NCES district ID
- 5400180
- Math proficiency
- 31% ▼ -7.00%
- Reading proficiency
- 42% ▼ -6.00%
- Median HH income
- $36,426
- Composite
- 30.26/100
- National rank
- #6285
- State rank
- #13 of 55 in WV
Livability — Huntington
- Score
- 79/100
- State rank
- #16
- US rank
- #2045
Category grades
Schools grade is shown separately in the Schools card above.
Census & demographics
- Census place
- Huntington, WV
- City population
- 25,795
- Population (ZIP)
- 20,668
Population outlook (Cabell County) Hauer SSP2
- Today (2025)
- 97,574 people
- By 2030
- 98,060 · +0.5%
- By 2040
- 98,817 · +1.3%
- By 2050
- 100,185 · +2.7%
- By 2075
- 105,895 · +8.5%
- By 2100
- 105,948 · +8.6%
Race, ethnicity, and origin ACS 2023
- Neighborhood character
- Predominantly White (89%)
- Race & ethnicity
- White 89% Black 5% Two or more races 4% Hispanic / Latino 2% Asian 1%
- Common ancestry
- Slovak 3% Serbian 2% Lithuanian 2%
- Foreign-born
- 2%
- Languages at home
- 97% English-only · Spanish 1%
Political lean MEDSL · Cabell
- 2024 margin
- Strong R (+21.9) · D 38.0% · R 59.9% · Other 2.0%
- 2008→2024 swing
- -11.8pp toward R · 2008: -10.1pp · 2024: -21.9pp
- All cycles
- 2024: R+21.9 2020: R+18.0 2016: R+25.5 2012: R+13.9 2008: R+10.1
Not yet ingested
- Civics
- —
Market trends
- HPI YoY
- ▼ -57.08%
- Current HPI
- 171.7797
- Rent YoY
- —
- Metro
- —
- State GDP YoY
- —
- F500 in state
- 0
Price history
1 event — show timeline
- 2026-05-20 Listed $44,900 HBRMLS
Property tax history
+17.2%/yrLatest (2025): $1,110 · +9.5% YoY. Source: county tax records.
Cash-flow waterfall
monthlySold comps — $/sqft
last 12 mo · ≤1 miLoading sold comps…