 Multi-family
4221 Siskiyou Ave · Dunsmuir, CA
Flood risk No data
- FEMA flood zone
- —
- Chance of flooding over 30 yrs
- —
- Est. flood insurance / yr
- —
Fire risk No data
- Est. fire insurance / yr
- —
Heat risk No data
- Hot days now (above threshold)
- —
- Hot days in 30 yrs
- —
Wind risk No data
- Chance of severe wind over 30 yrs
- —
Air-quality risk No data
- Unhealthy air days now
- —
- Unhealthy air days in 30 yrs
- —
Risk factors via First Street. Map © Google.
Why this score? — see what drove the B- grade
The composite is a weighted blend of 9 inputs, each scored 0–100. Each bar is that input's sub-score; the figure is the points it added to the 100-point composite (weight × sub-score).
- Cash flow +30.0/30.0
- 1% rule +10.0/10.0
- DSCR +10.0/10.0
- ARV discount +7.5/15.0
- Schools +4.1/10.0
- Livability +2.7/5.0
- Rent growth +2.5/5.0
- Condition / age +1.0/5.0
- Appreciation +0.0/10.0
$449,000
🖨 Deal sheet (PDF) 📄 Offer letter ✓ Due diligence
Multi-family units
County records classify this as Multi-Family (5+ Unit). Listing-text estimate: 1 unit. estimate disagrees with records
5+ unit building — per-unit beds/baths from public records are typically unavailable; the breakdown below (if shown) is an estimate from the listing text.
Listing remarks
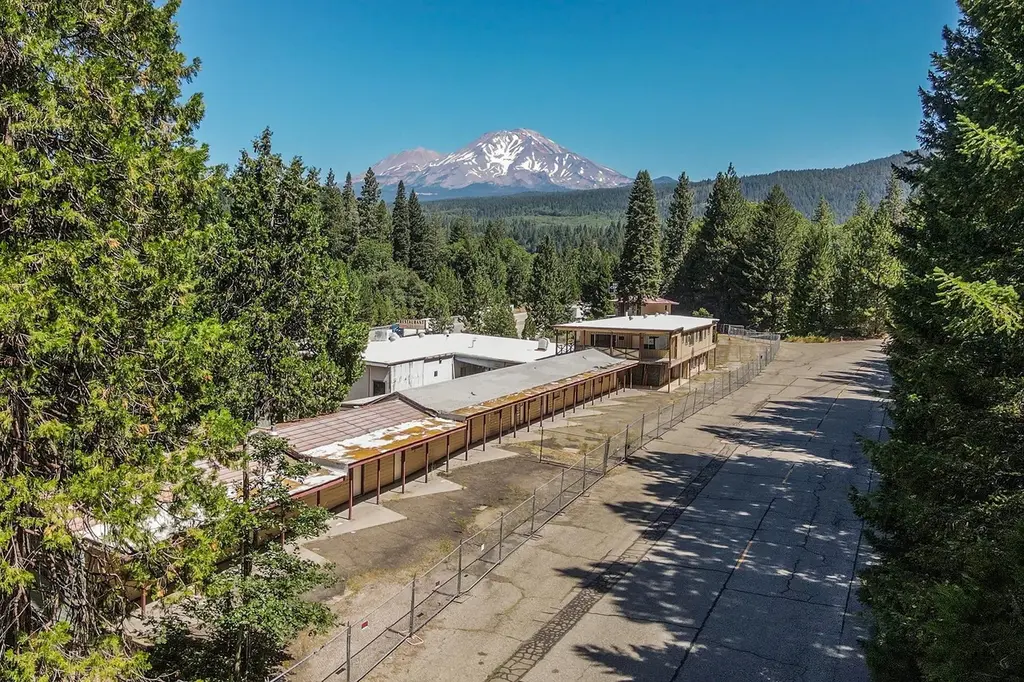
OWNER MAY CARRY! Positioned for maximum exposure along I-5, this well-known Siskiyou County property presents a compelling opportunity for investors and visionaries alike. Located midway between San Francisco and Portland, the site captures steady traffic and showcases stunning views of Mt. Shasta, a backdrop that elevates its potential. The property includes 26 guest accommodations, along with a spacious 3-bedroom, 3-bath residence and a separate 1-bedroom manager’s unit. Existing features such as a diner, bar, banquet space, and chapel provide a strong foundation for a wide range of uses. An additional large open area offers flexibility for events, fitness, or entertainment concepts
Key facts
- Guest accommodations
- Large open area
- 1.5 acre lot
Tags
Property features AI
Exterior
- Home design: Multi-family residential income property; 2 stories; Zoned C-2 / MU-3
- Construction: Block, brick, and wood siding construction
- Exterior features: Level and sloped lot; Lot dimensions approximately 129 x 651
Interior
- Interior features: Full basement
Neighborhood map
What this means for you Summary
Snapshot
- This is a ?-bed/5.0-bath multifamily listed at $449k. Condition is rated poor.
Deal economics
- At list price, monthly cash flow is $8k ($91k/yr) — positive.
- The deal already cash-flows at list — no discount required.
- Meets the 1% rule at list price ($14k rent vs $449k).
- Recommended offer: $422k (6.0% below list) — sets the bar for market timing.
- Cap rate 26.5% vs local median 3.8% in Dunsmuir — top-decile yield for the area; either an underpriced asset or a hidden risk that comps aren't pricing in. Stress-test before assuming the spread holds.
Location & tenants
- Location reads 53/100 on livability (#967 in CA) — a working-class tenant base; expect higher turnover. Strengths: housing A-; Watch: cost of living D+, crime F, amenities F.
- Dunsmuir Joint Union High (rural): math 25% / reading 75% proficiency, ranked #163 of 517 in CA (top 32%) — acceptable for families but not a draw, mixed tenant base, ~2y average lease.
- Zoned schools: Dunsmuir Elementary (math 15% / reading 24%, grade F, #1,256 of 1,571 statewide, top 81%, 93 students, 89% FRL); Dunsmuir High (math 24% / reading 75%, grade D+, #332 of 1,170 statewide, top 30%, 66 students, 74% FRL).
- Zoned-school proficiency averages 35% at this address vs 50% district-wide (-15 pts) — the specific schools serving this property underperform the Dunsmuir Joint Union High average; the district grade overstates school quality for this exact location.
- Market conditions: 36 active listings in the ZIP; 50 units permitted in Siskiyou County in 2024 (0 in 5+ unit buildings).
Forward outlook
- Local home prices are declining (-3.0%/yr); year-one equity from $3k of loan paydown is wiped out by about $13k of value loss. Plan a longer hold.
- Siskiyou County population projected at -26% by 2050 — secular population decline; favor cash flow + early exit over multi-decade hold.
- At projected returns (-3.0% appreciation + 3.0% rent growth), your $126k cash investment doubles in ~2 years — after that, you're playing with house money.
Negotiation context
- It's been on market 65 days — a 6% lower offer ($422k) is reasonable based on typical stale-listing flexibility.
- 4 sale attempts since 9y ago with the ask held roughly flat each time — persistent listings suggest the price (not the market) is what's stuck; bring a comps-based counter.
- Current owner paid $340k; 32% above their basis — modest negotiation headroom, anchor on the comps not their cost.
Risks & watch-outs
- Watch-outs: built in 1950 — expect roof / HVAC / electrical / plumbing capex.
Questions for the listing agent
- It's been on market 65 days. Have you received any prior offers? Is the seller open to a 6% concession, seller financing, or rate buy-down credit?
- Have any recent inspections been done? Can we get a copy of the seller's disclosures and any deferred-maintenance estimates?
- Built in 1950 — when were the roof, HVAC, electrical panel, plumbing, and water heater last replaced?
- Why hasn't it sold? Are there any deal-killer items the seller is aware of (foundation, flood, title, zoning, code violations)?
- Is there a deadline driving the sale (1031 exchange, divorce, estate, relocation)? That informs how much negotiation room exists.
- Schools are D-rated, which usually means shorter tenancies and higher turnover. Who's the typical renter profile here, and what's been the actual vacancy rate?
- Crime grade is F in this area — have there been break-ins, vandalism, or insurance claims at this property in the last 3 years? What carrier currently insures it and at what premium?
- What's the average days-on-market for RENTAL listings here right now (not sales)? A rising rental-DOM trend means longer vacancies and softer asking-rent achievability than the comps imply.
- What's the recent tenant-quality profile in this submarket — average credit score on applications, eviction rate, late-payment / NSF rate, and stable-employment percentage? A property-management company in the area should have these aggregated.
- How much new apartment / multifamily construction is in the pipeline within 1–3 miles? Heavy new supply (>2% of stock underway) typically softens rents 12–24 months out; light construction supports rent growth.
Investment metrics
- 1% rule
- 3.01% ✓
- Cap rate
- 26.52%
- Cash-on-cash
- 72.26%
- DSCR
- 4.21
- GRM
- 2.8
CMA / ARV
No comps found within radius.
Projected returns pro-forma
-3.0% appreciation · 3.0% rent growth · sell at horizon
- IRR
- 72.0%
- Equity multiple
- 4.26×
- Total profit
- $409,581
- Equity at exit
- $66,947
- IRR
- 75.9%
- Equity multiple
- 8.78×
- Total profit
- $978,310
- Equity at exit
- $38,821
Cash invested: $125,720 (down + closing). Projections, not guarantees.
Landlord ↔ Tenant lean methodology
- Overall (STATE)
- 18 Strongly Tenant-Friendly
- State California
- 18 Strongly Tenant-Friendly · D+13
- County
- — inherits STATE
- City
- — inherits STATE
ZIP-level market 96025
- Active inventory
- 36
- Price-to-rent
- 27.7×
Monthly cashflow live
- Estimated rent
- $13,510 medium interval (Pro) →
- Mortgage (P&I)
- −$2,355
- Tax est. 1.5%
- −$561 /mo · $6,735/yr
- Insurance
- −$187
- HOA
- −$0
- Vacancy / Maint / Mgmt
- −$2,837
- Net cashflow
- $7,570
Break-even live
Sensitivity live
| Price | -10% $7,880 | -5% $7,725 | +0% $7,570 | +5% $7,415 | +10% $7,260 |
|---|---|---|---|---|---|
| Rent | -10% $6,503 | -5% $7,036 | +0% $7,570 | +5% $8,104 | +10% $8,637 |
| Rate | -1.0pp $7,796 | -0.5pp $7,684 | base $7,570 | +0.5pp $7,454 | +1.0pp $7,335 |
10-unit breakdown (identical units grouped — click to expand)
| Units | Beds | Baths | Est. rent |
|---|---|---|---|
| 10× units | 1 | 1 | $13,510 |
| #1 | 1 | 1 | $1,351 |
| #2 | 1 | 1 | $1,351 |
| #3 | 1 | 1 | $1,351 |
| #4 | 1 | 1 | $1,351 |
| #5 | 1 | 1 | $1,351 |
| #6 | 1 | 1 | $1,351 |
| #7 | 1 | 1 | $1,351 |
| #8 | 1 | 1 | $1,351 |
| #9 | 1 | 1 | $1,351 |
| #10 | 1 | 1 | $1,351 |
| Total (10 units) | $13,510 | ||
UW: 25.0% down · 7.5% · 30yr · 1.5% tax · 5.0% vac · 8.0% maint · 8.0% mgmt
Financing live
Cash to close
- Down payment
- $112,250
- Closing costs
- $13,470
- Reserves months
- —
- Total cash needed
- —
Loan-product check · same deal, 3 products live
Conventional
25% down · 7.5% · 30yr
- Down + closing
- —
- Monthly P&I
- —
- Monthly cashflow
- —
- DSCR
- —
- Eligible?
- —
Personal DTI + credit; lowest rate.
DSCR
20% down · 8.5% · 30yr
- Down + closing
- —
- Monthly P&I
- —
- Monthly cashflow
- —
- DSCR
- —
- Eligible?
- —
No personal income docs; deal must DSCR.
Hard money
10% down · 12.0% · 12mo
- Down + closing
- —
- Monthly P&I
- —
- Monthly cashflow
- —
- DSCR
- —
- Eligible?
- —
Short-term bridge; refi at stabilization.
Listing history 27 events
-
2026-06-21days on market $449,000 Active 65 DOM
-
2026-06-19days on market $449,000 Active 63 DOM
-
2026-06-18days on market $449,000 Active 62 DOM
-
2026-06-17days on market $449,000 Active 61 DOM
-
2026-06-16days on market $449,000 Active 60 DOM
-
2026-06-15days on market $449,000 Active 59 DOM
-
2026-06-14days on market $449,000 Active 57 DOM
-
2026-06-12days on market $449,000 Active 56 DOM
-
2026-06-09days on market $449,000 Active 53 DOM
-
2026-06-08days on market $449,000 Active 52 DOM
-
2026-06-07days on market $449,000 Active 51 DOM
-
2026-06-07days on market $449,000 Active 50 DOM
-
2026-06-04days on market $449,000 Active 47 DOM
-
2026-06-02days on market $449,000 Active 46 DOM
-
2026-06-01days on market $449,000 Active 45 DOM
-
2026-05-31days on market $449,000 Active 44 DOM
-
2026-05-31days on market $449,000 Active 43 DOM
-
2026-04-15$449,000 Active
-
2025-10-27price $499,000
-
2025-06-20price $549,000
-
2024-08-08price $659,000
-
2024-05-18$699,000 Active
-
2024-04-11price $699,000
-
2020-11-17soldstatus $340,000
-
2018-05-12$330,000
-
2017-12-26soldstatus $140,000
-
2017-07-22$199,000
ⓘ Source: listings_history table (triggers on properties + properties_extension) + one-shot
backfill from property_details.listing_events for pre-trigger history.
Nearby sold comps map
Loading sold comps map…
Walkable amenities ~0.75 mi
Loading nearby amenities…
Taxation est. · year 1
- Rental income
- $162,120
- − Mortgage interest
- −$25,151
- − Property taxes
- −$6,735
- − Insurance
- −$2,245
- − Repairs & maintenance
- −$12,970
- − Management
- −$12,970
- − Depreciation
- −$13,062
- Taxable income
- $88,988
- Est. tax owed @ 24.0%
- −$21,357
- After-tax cash flow
- $69,482/yr
For passive investors: Depreciation is non-cash, so a rental often shows a tax loss while cash-flowing — sheltering income. Rental losses are passive: they offset passive income freely, and up to $25,000/yr can offset ordinary (W-2) income if you actively participate and your MAGI is under $100k (phasing out to $0 by $150k); unused losses carry forward. On sale, claimed depreciation is recaptured at up to 25%, and gains may owe capital-gains tax (a 1031 exchange can defer both). Figures are a year-1 estimate at your 24.0% rate — not tax advice; consult a CPA.
Condition & rehab AI · 10 photos
This multi-family property requires extensive rehabilitation to improve its condition and increase its value. Significant repairs and maintenance are needed across all systems and areas, with a focus on the kitchen, bath, roof, exterior, flooring, interior walls/paint, HVAC/mechanicals, and landscaping. Comprehensive rehabilitation would significantly enhance its resale and rental potential.
Repairs flagged
- Major Kitchen — Exposed framing and no visible fixtures
- Major Bath — Exposed framing and no visible fixtures
- Major Roof — Weathered and aged
- Major Exterior — Peeling paint and exposed framing
- Major Flooring — Exposed subfloor
- Major Interior walls/paint — Exposed framing and no visible walls
- Major HVAC/mechanicals — Exposed ductwork
- Major Landscaping — Overgrown vegetation and unkempt appearance
Value-add opportunities
- Both Rehabilitation of all systems and areas — Comprehensive renovation would improve both resale and rental value
- Both Landscaping and curb appeal improvements — Enhanced appearance would attract more buyers and renters
- Both HVAC and mechanical upgrades — Modern systems would improve comfort and energy efficiency
- Both Kitchen and bathroom updates — Functional and stylish kitchens and bathrooms would attract more buyers and renters
Renovation cost estimate screening
| Repair item | Severity | Est. cost |
|---|---|---|
| Kitchen · Exposed framing and no visible fixtures | Major | $15,000–50,000 |
| Bath · Exposed framing and no visible fixtures | Major | $15,000–50,000 |
| Roof · Weathered and aged | Major | $15,000–50,000 |
| Exterior · Peeling paint and exposed framing | Major | $15,000–50,000 |
| Flooring · Exposed subfloor | Major | $15,000–50,000 |
| Interior walls/paint · Exposed framing and no visible walls | Major | $15,000–50,000 |
| HVAC/mechanicals · Exposed ductwork | Major | $15,000–50,000 |
| Landscaping · Overgrown vegetation and unkempt appearance | Major | $15,000–50,000 |
| Total estimated repair cost · 8 items | $120,000–400,000 |
Value-add ROI direction
- Both Rehabilitation of all systems and areas — Comprehensive renovation would improve both resale and rental value ↑
- Both Landscaping and curb appeal improvements — Enhanced appearance would attract more buyers and renters ↑
- Both HVAC and mechanical upgrades — Modern systems would improve comfort and energy efficiency ↑
- Both Kitchen and bathroom updates — Functional and stylish kitchens and bathrooms would attract more buyers and renters ↑
ⓘ Cost ranges are severity-bucket heuristics (US national rule-of-thumb). Get contractor quotes + a written scope before underwriting a rehab budget.
Schools (NCES district)
- District
- Dunsmuir Joint Union High
- NCES district ID
- 0611700
- Math proficiency
- 25% ▲ 25.00%
- Reading proficiency
- 75% ▲ 75.00%
- Median HH income
- $32,255
- Composite
- 40.88/100
- National rank
- #3620
- State rank
- #163 of 517 in CA
Livability — Dunsmuir
- Score
- 53/100
- State rank
- #967
- US rank
- #24546
Category grades
Schools grade is shown separately in the Schools card above.
Census & demographics
- Census place
- Dunsmuir, CA
- Population (ZIP)
- 2,150
Population outlook (Siskiyou County) Hauer SSP2
- Today (2025)
- 39,337 people
- By 2030
- 36,930 · -6.1%
- By 2040
- 32,367 · -17.7%
- By 2050
- 29,030 · -26.2%
- By 2075
- 23,534 · -40.2%
- By 2100
- 19,312 · -50.9%
Race, ethnicity, and origin ACS 2023
- Neighborhood character
- Predominantly White (76%)
- Race & ethnicity
- White 76% Two or more races 13% Hispanic / Latino 12% Asian 1% Black 1% Native American 1%
- Hispanic origin (detail)
- Mexican 9%
- Common ancestry
- Italian 4% Romanian 4% Lithuanian 3%
- Foreign-born
- 6% · Canada, China, South Korea
- Languages at home
- 94% English-only · Spanish 4% Other Indo-European 1%
Political lean MEDSL · Siskiyou
- 2024 margin
- R (+19.2) · D 38.8% · R 58.0% · Other 3.2%
- 2008→2024 swing
- -8.8pp toward R · 2008: -10.4pp · 2024: -19.2pp
- All cycles
- 2024: R+19.2 2020: R+15.8 2016: R+20.7 2012: R+15.6 2008: R+10.4
Not yet ingested
- Civics
- —
Market trends
- HPI YoY
- ▼ -140.66%
- Current HPI
- 144.676
- Rent YoY
- —
- Metro
- —
- State GDP YoY
- ▲ 3.21%
- F500 in state
- 116
Industry mix (Fortune 500 HQ in CA)
| Industry | F500 HQs | Revenue |
|---|---|---|
| Technology | 27 | $1,492B |
|
||
| Financial Services | 3 | $174B |
|
||
| Retail | 3 | $44B |
|
||
| Insurance | 3 | $26B |
|
||
| Media / Entertainment | 2 | $115B |
|
||
| Pharmaceuticals / Biotech | 2 | $62B |
|
||
Price history
+125.6% since first listed10 events — show timeline
- 2026-04-15 Listed $449,000 SMLS
- 2025-10-27 Price Changed $499,000 SMLS
- 2025-06-20 Price Changed $549,000 SMLS
- 2024-08-08 Price Changed $659,000 SAOR
- 2024-05-18 Listed $699,000 SAOR
- 2024-04-11 Price Changed $699,000 SMLS
- 2020-11-17 Sold (MLS) $340,000 SMLS
- 2018-05-12 Listed $330,000 SMLS
- 2017-12-26 Sold (MLS) $140,000 SAOR
- 2017-07-22 Listed $199,000 SAOR
Cash-flow waterfall
monthlySold comps — $/sqft
last 12 mo · ≤1 miLoading sold comps…