501 Spring St · Mound City, MO
Flood risk 1/10 · Minimal
- FEMA flood zone
- —
- Chance of flooding over 30 yrs
- 0.0%
- Est. flood insurance / yr
- —
Fire risk 2/10 · Minimal
- Est. fire insurance / yr
- $1,054 – $1,958
Heat risk 3/10 · Minor
- Hot days now (above 106°F)
- 7 days/yr
- Hot days in 30 yrs
- 16 days/yr
Wind risk 2/10 · Minimal
- Chance of severe wind over 30 yrs
- —
Air-quality risk 1/10 · Minimal
- Unhealthy air days now
- 0 days/yr
- Unhealthy air days in 30 yrs
- 0 days/yr
Risk factors via First Street. Map © Google.
Why this score? — see what drove the A- grade
The composite is a weighted blend of 9 inputs, each scored 0–100. Each bar is that input's sub-score; the figure is the points it added to the 100-point composite (weight × sub-score).
- Cash flow +30.0/30.0
- ARV discount +15.0/15.0
- 1% rule +10.0/10.0
- DSCR +10.0/10.0
- Appreciation +5.0/10.0
- Schools +5.0/10.0
- Livability +3.2/5.0
- Rent growth +2.5/5.0
- Condition / age +2.5/5.0
$42,900
🖨 Deal sheet 📄 Offer letter ✓ Due diligence
Listing remarks MLS
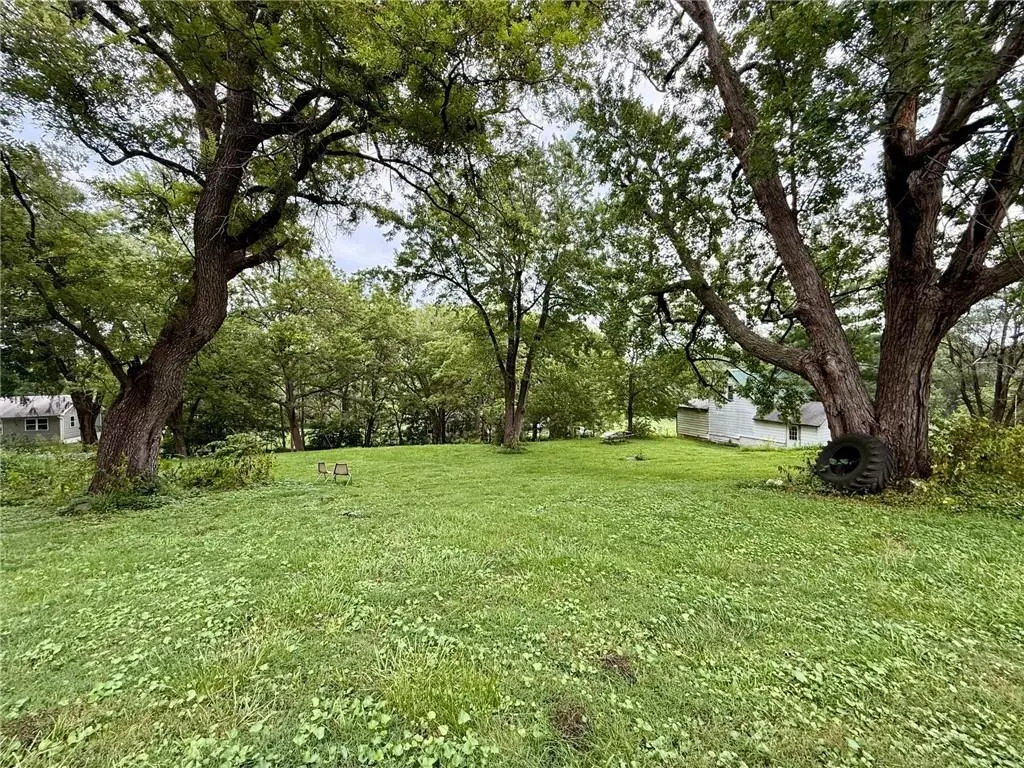
This generous property stretches from block to block, east to west with 6 lots totaling . 88 of an acre, offers ample space and privacy. Beautiful mature trees create a peaceful setting and the perfect backdrop for your dream home. The lot also includes a garage, ideal for storage or future use. Located in the quaint Mound City school district, home of the Panthers, it offers small-town charm with a welcoming community feel. The existing home provides flexibility. Whether you envision a brand-new build or a creative renovation, this lot is a rare find with sewer and water service on the property for 3 units this has endless potential!
Key facts
- 6,534 sq ft lot
- Garage
- Built 1920
Neighborhood map
What this means for you Summary
Snapshot
- This is a 2-bed/1.0-bath other listed at $43k.
Deal economics
- At list price, monthly cash flow is $589 ($7k/yr) — positive.
- The deal already cash-flows at list — no discount required.
- Meets the 1% rule at list price ($1k rent vs $43k).
- Recommended offer: $38k (12.0% below list) — sets the bar for market timing.
Location & tenants
- Location reads 65/100 on livability (#272 in MO) — a middle-class / working-renter tenant base. Strengths: cost of living A+, housing A-, crime B+; Watch: amenities F, commute F, health & safety F.
- Mound City R-II (rural): math 50% / reading 65% proficiency, ranked #48 of 535 in MO (top 9%) — acceptable for families but not a draw, mixed tenant base, ~2y average lease.
- Market conditions: 8 active listings in the ZIP.
Forward outlook
- In year one you build about $2k of equity ($297 loan paydown + $1k appreciation (3.0% local appreciation)).
- Holt County population projected at -42% by 2050 — secular population decline; favor cash flow + early exit over multi-decade hold.
- At projected returns (3.0% appreciation + 3.0% rent growth), your $12k cash investment doubles in ~2 years — after that, you're playing with house money.
Negotiation context
- It's been on market 313 days — a 12% lower offer ($38k) is reasonable based on typical stale-listing flexibility.
- 3 sale attempts since 2y ago; this cycle's ask has dropped $12k (22%) from the opening price — seller is motivated, your offer sets the floor, not the list.
Risks & watch-outs
- Watch-outs: built in 1920 — expect roof / HVAC / electrical / plumbing capex.
Questions for the listing agent
- It's been on market 313 days. Have you received any prior offers? Is the seller open to a 12% concession, seller financing, or rate buy-down credit?
- Built in 1920 — when were the roof, HVAC, electrical panel, plumbing, and water heater last replaced?
- Why hasn't it sold? Are there any deal-killer items the seller is aware of (foundation, flood, title, zoning, code violations)?
- Is there a deadline driving the sale (1031 exchange, divorce, estate, relocation)? That informs how much negotiation room exists.
- Schools are B-rated — typically a magnet for longer-tenancy family renters. What's the average tenant stay here, and is there a school-zone premium baked into asking?
- What's the average days-on-market for RENTAL listings here right now (not sales)? A rising rental-DOM trend means longer vacancies and softer asking-rent achievability than the comps imply.
- What's the recent tenant-quality profile in this submarket — average credit score on applications, eviction rate, late-payment / NSF rate, and stable-employment percentage? A property-management company in the area should have these aggregated.
- How much new for-sale + rental construction is in the pipeline within 1–3 miles? Heavy new supply typically softens prices + rents 12–24 months out; constrained supply supports both.
Investment metrics
- 1% rule
- 2.51% ✓
- Cap rate
- 22.77%
- Cash-on-cash
- 58.85%
- DSCR
- 3.62
- GRM
- 3.3
CMA / ARV
- ARV (median comp)
- $80,188
- List price
- $42,900
- Delta
- -46.50%
- Verdict
- UNDERPRICED
- Comps
- 12 within 1.0 mi
Projected returns pro-forma
3.0% appreciation · 3.0% rent growth · sell at horizon
- IRR
- 63.7%
- Equity multiple
- 4.55×
- Total profit
- $42,682
- Equity at exit
- $19,290
- IRR
- 63.3%
- Equity multiple
- 9.27×
- Total profit
- $99,361
- Equity at exit
- $29,728
Cash invested: $12,012 (down + closing). Projections, not guarantees.
Landlord ↔ Tenant lean methodology
- Overall (STATE)
- 81 Strongly Landlord-Friendly
- State Missouri
- 81 Strongly Landlord-Friendly · R+10
- County
- — inherits STATE
- City
- — inherits STATE
ZIP-level market 64470
- Active inventory
- 8
- Price-to-rent
- 3.3×
Monthly cashflow live
- Estimated rent
- $1,076 medium interval (Pro) →
- Mortgage (P&I)
- −$225
- Tax from tax record
- −$18 /mo · $213/yr
- Insurance
- −$18
- HOA
- −$0
- Vacancy / Maint / Mgmt
- −$226
- Net cashflow
- $589
Break-even live
UW: 25.0% down · 7.5% · 30yr · 1.5% tax · 5.0% vac · 8.0% maint · 8.0% mgmt
Financing live
Cash to close
- Down payment
- $10,725
- Closing costs
- $1,287
- Reserves months
- —
- Total cash needed
- —
Loan-product check · same deal, 3 products live
Conventional
25% down · 7.5% · 30yr
- Down + closing
- —
- Monthly P&I
- —
- Monthly cashflow
- —
- DSCR
- —
- Eligible?
- —
Personal DTI + credit; lowest rate.
DSCR
20% down · 8.5% · 30yr
- Down + closing
- —
- Monthly P&I
- —
- Monthly cashflow
- —
- DSCR
- —
- Eligible?
- —
No personal income docs; deal must DSCR.
Hard money
10% down · 12.0% · 12mo
- Down + closing
- —
- Monthly P&I
- —
- Monthly cashflow
- —
- DSCR
- —
- Eligible?
- —
Short-term bridge; refi at stabilization.
Listing history 24 events
-
2026-06-18days on market $42,900 Active 313 DOM
-
2026-06-17days on market $42,900 Active 312 DOM
-
2026-06-16days on market $42,900 Active 311 DOM
-
2026-06-15days on market $42,900 Active 310 DOM
-
2026-06-13days on market $42,900 Active 308 DOM
-
2026-06-12days on market $42,900 Active 307 DOM
-
2026-06-09days on market $42,900 Active 304 DOM
-
2026-06-08days on market $42,900 Active 303 DOM
-
2026-06-07days on market $42,900 Active 302 DOM
-
2026-06-05days on market $42,900 Active 300 DOM
-
2026-06-04days on market $42,900 Active 298 DOM
-
2026-06-02days on market $42,900 Active 297 DOM
-
2026-06-01days on market $42,900 Active 296 DOM
-
2026-05-31days on market $42,900 Active 295 DOM
-
2025-11-04price $42,900 642-char remark
Show marketing remark (642 chars)
This generous property stretches from block to block, east to west with 6 lots totaling . 88 of an acre, offers ample space and privacy. Beautiful mature trees create a peaceful setting and the perfect backdrop for your dream home. The lot also includes a garage, ideal for storage or future use. Located in the quaint Mound City school district, home of the Panthers, it offers small-town charm with a welcoming community feel. The existing home provides flexibility. Whether you envision a brand-new build or a creative renovation, this lot is a rare find with sewer and water service on the property for 3 units this has endless potential!
-
2025-09-05price $49,900 642-char remark
Show marketing remark (642 chars)
This generous property stretches from block to block, east to west with 6 lots totaling . 88 of an acre, offers ample space and privacy. Beautiful mature trees create a peaceful setting and the perfect backdrop for your dream home. The lot also includes a garage, ideal for storage or future use. Located in the quaint Mound City school district, home of the Panthers, it offers small-town charm with a welcoming community feel. The existing home provides flexibility. Whether you envision a brand-new build or a creative renovation, this lot is a rare find with sewer and water service on the property for 3 units this has endless potential!
-
2025-08-09$55,000 Active 642-char remark
Show marketing remark (642 chars)
This generous property stretches from block to block, east to west with 6 lots totaling . 88 of an acre, offers ample space and privacy. Beautiful mature trees create a peaceful setting and the perfect backdrop for your dream home. The lot also includes a garage, ideal for storage or future use. Located in the quaint Mound City school district, home of the Panthers, it offers small-town charm with a welcoming community feel. The existing home provides flexibility. Whether you envision a brand-new build or a creative renovation, this lot is a rare find with sewer and water service on the property for 3 units this has endless potential!
-
2025-05-21historical
-
2024-12-03status Active
-
2024-11-22historical
-
2024-09-25price $60,000
-
2024-06-28price $70,000
-
2024-05-22$80,000 Active
-
2010-01-15soldstatus
ⓘ Source: listings_history table (triggers on properties + properties_extension) + one-shot
backfill from property_details.listing_events for pre-trigger history.
Tax reassessment forecast MO · Resets to sale price
- Current annual tax
- $213 · $18/mo
- Projected year-2 tax
- $416 · $35/mo
- Expected delta
- +$203/yr (+$17/mo · 95.0%)
ⓘ Screening estimate from a state-policy table — verify with the county assessor before closing.
Climate risk First Street
- Flood 1/10 Low 0% chance over 30 yrs
- Wildfire 2/10 Low
- Heat 3/10 Moderate 7 d/yr ≥106°F today · 16 d/yr by 30 yrs out
- Wind 2/10 Low
- Air quality 1/10 Low 0 unhealthy d/yr today · 0 by 30 yrs out
Nearby sold comps map
Loading sold comps map…
Walkable amenities ~0.75 mi
Loading nearby amenities…
Taxation est. · year 1
- Rental income
- $12,907
- − Mortgage interest
- −$2,403
- − Property taxes
- −$213
- − Insurance
- −$214
- − Repairs & maintenance
- −$1,033
- − Management
- −$1,033
- − Depreciation
- −$1,248
- Taxable income
- $6,763
- Est. tax owed @ 24.0%
- −$1,623
- After-tax cash flow
- $5,446/yr
For passive investors: Depreciation is non-cash, so a rental often shows a tax loss while cash-flowing — sheltering income. Rental losses are passive: they offset passive income freely, and up to $25,000/yr can offset ordinary (W-2) income if you actively participate and your MAGI is under $100k (phasing out to $0 by $150k); unused losses carry forward. On sale, claimed depreciation is recaptured at up to 25%, and gains may owe capital-gains tax (a 1031 exchange can defer both). Figures are a year-1 estimate at your 24.0% rate — not tax advice; consult a CPA.
Schools (NCES district)
- District
- Mound City R-II
- NCES district ID
- 2921480
- Math proficiency
- 50% ▬ 0.00%
- Reading proficiency
- 65% ▲ 10.00%
- Median HH income
- $45,850
- Composite
- 50.29/100
- National rank
- #4055
- State rank
- #48 of 535 in MO
Livability — Mound City
- Score
- 65/100
- State rank
- #272
- US rank
- #12787
Category grades
Schools grade is shown separately in the Schools card above.
Census & demographics
- Census place
- Mound City, MO
- Population (ZIP)
- 1,574
Population outlook (Holt County) Hauer SSP2
- Today (2025)
- 3,689 people
- By 2030
- 3,318 · -10.1%
- By 2040
- 2,666 · -27.7%
- By 2050
- 2,151 · -41.7%
- By 2075
- 1,390 · -62.3%
- By 2100
- 995 · -73.0%
Race, ethnicity, and origin ACS 2023
- Neighborhood character
- Predominantly White (95%)
- Race & ethnicity
- White 95% Two or more races 3% Hispanic / Latino 1%
- Common ancestry
- Italian 2% Slovak 1% Serbian 1%
- Foreign-born
- 0%
- Languages at home
- 99% English-only · Spanish 1%
Political lean MEDSL · Holt
- 2024 margin
- Solid R (+69.1) · D 15.2% · R 84.3%
- 2008→2024 swing
- -31.4pp toward R · 2008: -37.7pp · 2024: -69.1pp
- All cycles
- 2024: R+69.1 2020: R+69.9 2016: R+67.3 2012: R+50.8 2008: R+37.7
Not yet ingested
- Civics
- —
Market trends
- HPI YoY
- —
- Current HPI
- —
- Rent YoY
- —
- Metro
- —
- State GDP YoY
- ▲ 1.84%
- F500 in state
- 20
Industry mix (Fortune 500 HQ in MO)
| Industry | F500 HQs | Revenue |
|---|---|---|
| Healthcare | 1 | $163B |
|
||
| Insurance | 1 | $21B |
|
||
| Industrial Technology | 1 | $17B |
|
||
| Retail | 1 | $16B |
|
||
| Industrial Distribution | 1 | $10B |
|
||
| Utilities | 1 | $9B |
|
||
Price history
-46.4% since first listed10 events — show timeline
- 2025-11-04 Price Changed $42,900 Heartland MLS as Distributed by MLS Grid
- 2025-09-05 Price Changed $49,900 Heartland MLS as Distributed by MLS Grid
- 2025-08-09 Listed $55,000 Heartland MLS as Distributed by MLS Grid
- 2025-05-21 Listing Removed — Heartland MLS as Distributed by MLS Grid
- 2024-12-03 Relisted — Heartland MLS as Distributed by MLS Grid
- 2024-11-22 Listing Removed — Heartland MLS as Distributed by MLS Grid
- 2024-09-25 Price Changed $60,000 Heartland MLS as Distributed by MLS Grid
- 2024-06-28 Price Changed $70,000 Heartland MLS as Distributed by MLS Grid
- 2024-05-22 Listed $80,000 Heartland MLS as Distributed by MLS Grid
- 2010-01-15 Sold (Public Records) — Public Records
Property tax history
+1.2%/yrLatest (2025): $213 · +9.9% YoY. Source: county tax records.
Cash-flow waterfall
monthlySold comps — $/sqft
last 12 mo · ≤1 miLoading sold comps…