 5-Plex
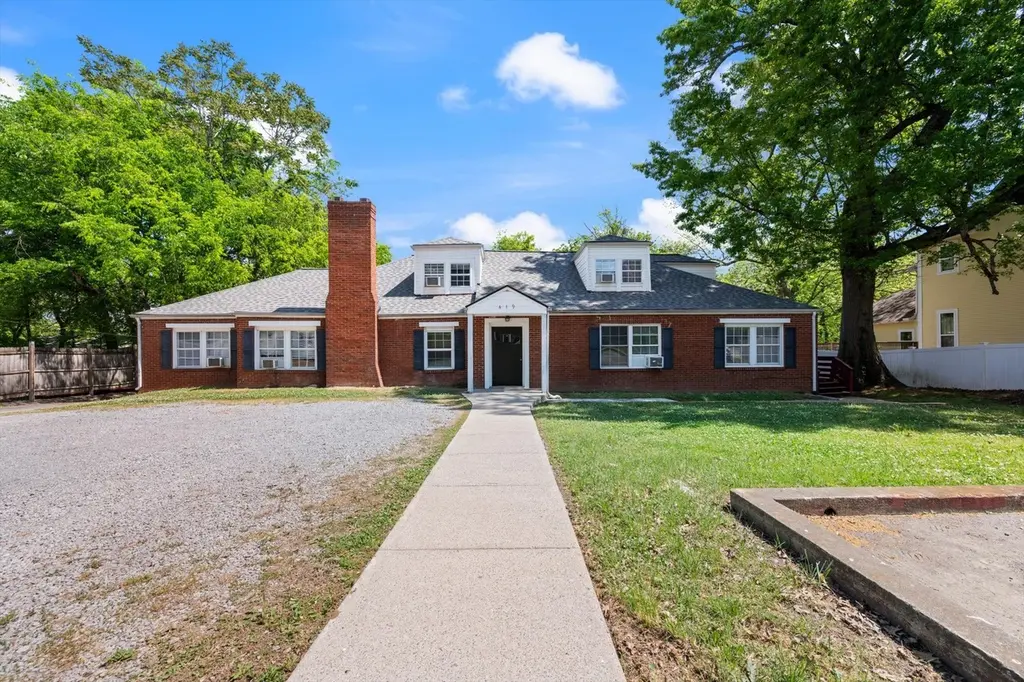
419 Belmont Ave · Shelbyville, TN
Flood risk 1/10 · Minimal
- FEMA flood zone
- X (unshaded)
- Chance of flooding over 30 yrs
- 0.0%
- Est. flood insurance / yr
- $473 – $860
Fire risk 1/10 · Minimal
- Est. fire insurance / yr
- $949 – $1,763
Heat risk 5/10 · Moderate
- Hot days now (above 105°F)
- 7 days/yr
- Hot days in 30 yrs
- 20 days/yr
Wind risk 4/10 · Minor
- Chance of severe wind over 30 yrs
- 10.0%
Air-quality risk 2/10 · Minimal
- Unhealthy air days now
- 1 days/yr
- Unhealthy air days in 30 yrs
- 1 days/yr
Risk factors via First Street. Map © Google.
Why this score? — see what drove the C grade
The composite is a weighted blend of 9 inputs, each scored 0–100. Each bar is that input's sub-score; the figure is the points it added to the 100-point composite (weight × sub-score).
- Cash flow +29.4/30.0
- DSCR +10.0/10.0
- 1% rule +7.3/10.0
- Livability +3.2/5.0
- Rent growth +2.5/5.0
- Condition / age +2.5/5.0
- Schools +2.0/10.0
- ARV discount +0.0/15.0
- Appreciation +0.0/10.0
$499,900
🖨 Deal sheet (PDF) 📄 Offer letter ✓ Due diligence
Multi-family units
County records classify this as Multi-Family (5+ Unit). Listing-text estimate: 5 units. confirmed
5+ unit building — per-unit beds/baths from public records are typically unavailable; the breakdown below (if shown) is an estimate from the listing text.
Listing remarks MLS
Five unit apartment building in town. Unit 5 is a studio unit rented for $650/month Recent updates (past 3 years) include a new roof, kitchen & bath updates. New wood framing replaced/repaired where needed due to a previous poor drainage issue in rim joist & floor. New foundation drains installed. Main sewage pipe replaced to street. Large parking area. Free trash pick-up. Incredibly convenient location.
Key facts
- Major improvements
- Strong rental appeal
- 0.35 acre lot
Tags
Property features AI
Finance
- Financial info: Gross income reported at $45,775; Net operating income reported at $29,640; Owner pays electricity and water; Tenant pays: none listed
Exterior
- Parking: Parking lot; no covered spaces listed
- Security: Smoke detectors
- Utilities: Public water; Public sewer; Water available
- Home design: Multi-family residential income property; Attached property; Two levels
- Construction: Brick construction; Shingle roof; Approximate year built (not specified)
- Exterior features: Parking lot; Lot dimensions approximately 102.5 x 150 (irregular)
Interior
- Bedrooms: Five units total: two 1-bedroom units and three 2-bedroom units
- Flooring: Wood flooring; Tile flooring
- Bathrooms: Each unit has one bathroom
- Heating & cooling: Baseboard heating; Wall/Window unit(s) for cooling
- Interior features: Wood and tile flooring; Baseboard heating; Wall/window cooling units; Smoke detectors
- Laundry & utility: No on-site laundry features (none listed)
Neighborhood map
What this means for you Summary
Snapshot
- This is a 2×2.0bd/1.0ba + 2×1.0bd/1.0ba + 1×?bd/1.0ba units multifamily listed at $500k.
Deal economics
- At list price, monthly cash flow is $2k ($21k/yr) — positive. Per door: $356/mo.
- The deal already cash-flows at list — no discount required.
- Meets the 1% rule at list price ($6k rent vs $500k).
- Recommended offer: $470k (6.0% below list) — sets the bar for market timing.
- Cap rate 10.6% vs local median 3.6% in Shelbyville — top-decile yield for the area; either an underpriced asset or a hidden risk that comps aren't pricing in. Stress-test before assuming the spread holds.
Location & tenants
- Location reads 64/100 on livability (#183 in TN) — a middle-class / working-renter tenant base. Strengths: cost of living A+, housing A+; Watch: health & safety C-, crime D, employment D.
- Bedford County (rural): math 24% / reading 23% proficiency, ranked #97 of 139 in TN (top 70%) — low school quality limits family demand, transient renter base, plan for 1-2y turnover.
- Zoned schools: East Side Elementary (math 13% / reading 17%, grade F, #749 of 952 statewide, top 79%, 424 students, 0% FRL); Harris Middle School (math 16% / reading 13%, grade F, #231 of 333 statewide, top 70%, 963 students, 0% FRL); Shelbyville Central High School (math 2% / reading 28%, grade F, #236 of 332 statewide, top 71%, 1,553 students, 0% FRL) — zoned schools average 0% FRL vs 56% district-wide (56 pts lower); this property's tenant base skews higher-income than the district average.
- Market conditions: 354 active listings in the ZIP; 630 units permitted in Bedford County in 2024 (6 in 5+ unit buildings).
Forward outlook
- Local home prices are declining (-3.0%/yr); year-one equity from $3k of loan paydown is wiped out by about $15k of value loss. Plan a longer hold.
- Bedford County population projected at +16% by 2050 — long-run rental-demand tailwind backs the buy-and-hold thesis.
- At projected returns (-3.0% appreciation + 3.0% rent growth), your $140k cash investment doubles in ~8 years — after that, you're playing with house money.
Negotiation context
- It's been on market 63 days — a 6% lower offer ($470k) is reasonable based on typical stale-listing flexibility.
- 9 sale attempts since 9y ago; this cycle's ask is 58712% above the opening price — seller raised mid-cycle; expect resistance to lowballs.
- Current owner paid $265k; list at $500k implies a 89% gain — meaningful room to come down on a strong offer.
Risks & watch-outs
- Watch-outs: built in 1948 — expect roof / HVAC / electrical / plumbing capex.
- Climate carrying-cost: extreme-heat days projected 7→20/yr by 2055 (HVAC capex compounding) — expect insurance premiums to compound above CPI over the hold.
Questions for the listing agent
- It's been on market 63 days. Have you received any prior offers? Is the seller open to a 6% concession, seller financing, or rate buy-down credit?
- Can we see the unit-by-unit rent roll, current vacancy, and any below-market leases? What's the average tenancy length?
- What capital expenditures (roof, boiler, parking lot, exteriors) have been made in the last 5 years, and what's planned in the next 2?
- Built in 1948 — when were the roof, HVAC, electrical panel, plumbing, and water heater last replaced?
- Why hasn't it sold? Are there any deal-killer items the seller is aware of (foundation, flood, title, zoning, code violations)?
- Is there a deadline driving the sale (1031 exchange, divorce, estate, relocation)? That informs how much negotiation room exists.
- Schools are F-rated, which usually means shorter tenancies and higher turnover. Who's the typical renter profile here, and what's been the actual vacancy rate?
- Crime grade is D in this area — have there been break-ins, vandalism, or insurance claims at this property in the last 3 years? What carrier currently insures it and at what premium?
- What's the average days-on-market for RENTAL listings here right now (not sales)? A rising rental-DOM trend means longer vacancies and softer asking-rent achievability than the comps imply.
- What's the recent tenant-quality profile in this submarket — average credit score on applications, eviction rate, late-payment / NSF rate, and stable-employment percentage? A property-management company in the area should have these aggregated.
- How much new apartment / multifamily construction is in the pipeline within 1–3 miles? Heavy new supply (>2% of stock underway) typically softens rents 12–24 months out; light construction supports rent growth.
Investment metrics
- 1% rule
- 1.23% ✓
- Cap rate
- 10.56%
- Cash-on-cash
- 15.26%
- DSCR
- 1.68
- GRM
- 6.8
CMA / ARV
- ARV (median comp)
- $385,000
- List price
- $499,900
- Delta
- 29.84%
- Verdict
- OVERPRICED
- Comps
- 1 within 2.0 mi
Projected returns pro-forma
-3.0% appreciation · 3.0% rent growth · sell at horizon
- IRR
- 5.9%
- Equity multiple
- 1.23×
- Total profit
- $32,185
- Equity at exit
- $74,537
- IRR
- 15.3%
- Equity multiple
- 2.24×
- Total profit
- $173,386
- Equity at exit
- $43,222
Cash invested: $139,972 (down + closing). Projections, not guarantees.
Landlord ↔ Tenant lean methodology
- Overall (STATE)
- 87 Strongly Landlord-Friendly
- State Tennessee
- 87 Strongly Landlord-Friendly · R+13
- County
- — inherits STATE
- City
- — inherits STATE
ZIP-level market 37160
- Home prices YoY
- -23.1%
- Active inventory
- 354
- Price-to-rent
- 32.1×
Monthly cashflow live
- Estimated rent
- $6,145 medium interval (Pro) →
- Mortgage (P&I)
- −$2,622
- Tax from tax record
- −$245 /mo · $2,944/yr
- Insurance
- −$208
- HOA
- −$0
- Vacancy / Maint / Mgmt
- −$1,290
- Net cashflow
- $1,779
Break-even live
Sensitivity live
| Price | -10% $2,062 | -5% $1,921 | +0% $1,779 | +5% $1,638 | +10% $1,496 |
|---|---|---|---|---|---|
| Rent | -10% $1,294 | -5% $1,537 | +0% $1,779 | +5% $2,022 | +10% $2,265 |
| Rate | -1.0pp $2,031 | -0.5pp $1,907 | base $1,779 | +0.5pp $1,650 | +1.0pp $1,518 |
5-unit breakdown (identical units grouped — click to expand)
| Units | Beds | Baths | Est. rent |
|---|---|---|---|
| 2× units | 2.0 | 1 | $2,596 |
| #1 | 2.0 | 1 | $1,298 |
| #2 | 2.0 | 1 | $1,298 |
| 2× units | 1.0 | 1 | $2,384 |
| #3 | 1.0 | 1 | $1,192 |
| #4 | 1.0 | 1 | $1,192 |
| 1× unit | 0.0 | 1 | $1,163 |
| Total (5 units) | $6,145 | ||
UW: 25.0% down · 7.5% · 30yr · 1.5% tax · 5.0% vac · 8.0% maint · 8.0% mgmt
Financing live
Cash to close
- Down payment
- $124,975
- Closing costs
- $14,997
- Reserves months
- —
- Total cash needed
- —
Loan-product check · same deal, 3 products live
Conventional
25% down · 7.5% · 30yr
- Down + closing
- —
- Monthly P&I
- —
- Monthly cashflow
- —
- DSCR
- —
- Eligible?
- —
Personal DTI + credit; lowest rate.
DSCR
20% down · 8.5% · 30yr
- Down + closing
- —
- Monthly P&I
- —
- Monthly cashflow
- —
- DSCR
- —
- Eligible?
- —
No personal income docs; deal must DSCR.
Hard money
10% down · 12.0% · 12mo
- Down + closing
- —
- Monthly P&I
- —
- Monthly cashflow
- —
- DSCR
- —
- Eligible?
- —
Short-term bridge; refi at stabilization.
Listing history 47 events
-
2026-06-22days on market $499,900 Active 63 DOM
-
2026-06-21days on market $499,900 Active 62 DOM
-
2026-06-19days on market $499,900 Active 60 DOM
-
2026-06-18days on market $499,900 Active 59 DOM
-
2026-06-17days on market $499,900 Active 58 DOM
-
2026-06-16days on market $499,900 Active 57 DOM
-
2026-06-15days on market $499,900 Active 56 DOM
-
2026-06-14days on market $499,900 Active 54 DOM
-
2026-06-13days on market $499,900 Active 53 DOM
-
2026-06-10days on market $499,900 Active 51 DOM
-
2026-06-09days on market $499,900 Active 50 DOM
-
2026-06-08days on market $499,900 Active 49 DOM
-
2026-06-07days on market $499,900 Active 48 DOM
-
2026-06-03days on market $499,900 Active 44 DOM
-
2026-06-02days on market $499,900 Active 43 DOM
-
2026-06-01days on market $499,900 Active 42 DOM
-
2026-05-31pricedays on market $499,900 Active 41 DOM
-
2026-05-30days on market $525,000 Active 40 DOM
-
2026-04-26historical $950
-
2026-04-25historical $950
-
2026-04-21$525,000 Active 1161-char remark
-
2026-01-23$950
-
2025-12-04$950
-
2025-08-03historical $850
-
2025-07-26$850
-
2025-01-01historical 418-char remark
Show marketing remark (418 chars)
Five unit apartment building in town. Unit 5 is a studio unit rented for $650/month Recent updates (past 3 years) include a new roof, kitchen & bath updates. New wood framing replaced/repaired where needed due to a previous poor drainage issue in rim joist & floor. New foundation drains installed. Main sewage pipe replaced to street. Large parking area. Free trash pick-up. Incredibly convenient location.
-
2024-07-19price $524,900 418-char remark
Show marketing remark (418 chars)
Five unit apartment building in town. Unit 5 is a studio unit rented for $650/month Recent updates (past 3 years) include a new roof, kitchen & bath updates. New wood framing replaced/repaired where needed due to a previous poor drainage issue in rim joist & floor. New foundation drains installed. Main sewage pipe replaced to street. Large parking area. Free trash pick-up. Incredibly convenient location.
-
2024-06-03$538,500 Active 418-char remark
Show marketing remark (418 chars)
Five unit apartment building in town. Unit 5 is a studio unit rented for $650/month Recent updates (past 3 years) include a new roof, kitchen & bath updates. New wood framing replaced/repaired where needed due to a previous poor drainage issue in rim joist & floor. New foundation drains installed. Main sewage pipe replaced to street. Large parking area. Free trash pick-up. Incredibly convenient location.
-
2022-02-03price $650
-
2020-12-07soldstatus $265,000
-
2018-04-30soldstatus $123,500 Closed
Show marketing remark (38 chars)
5 units that bring in $2050.00 a month
-
2018-04-30soldstatus $123,500
Show marketing remark (38 chars)
5 units that bring in $2050.00 a month
-
2018-03-16status Pending
Show marketing remark (38 chars)
5 units that bring in $2050.00 a month
-
2018-02-12price $129,900
Show marketing remark (38 chars)
5 units that bring in $2050.00 a month
-
2018-02-12status Active
Show marketing remark (38 chars)
5 units that bring in $2050.00 a month
-
2018-01-24status Pending
Show marketing remark (38 chars)
5 units that bring in $2050.00 a month
-
2018-01-15price $139,900
Show marketing remark (38 chars)
5 units that bring in $2050.00 a month
-
2017-12-15price $144,900
Show marketing remark (38 chars)
5 units that bring in $2050.00 a month
-
2017-11-22price $149,900
Show marketing remark (38 chars)
5 units that bring in $2050.00 a month
-
2017-11-06price $154,900
Show marketing remark (38 chars)
5 units that bring in $2050.00 a month
-
2017-10-19status Active
Show marketing remark (38 chars)
5 units that bring in $2050.00 a month
-
2017-10-18historical Contingent - Financing
Show marketing remark (38 chars)
5 units that bring in $2050.00 a month
-
2017-09-29$159,900 Active
Show marketing remark (38 chars)
5 units that bring in $2050.00 a month
-
2011-09-01soldstatus $128,100
-
2007-10-09soldstatus $124,000
-
2005-07-11soldstatus $148,000
-
2004-02-24soldstatus $50,000
ⓘ Source: listings_history table (triggers on properties + properties_extension) + one-shot
backfill from property_details.listing_events for pre-trigger history.
Tax reassessment forecast TN · Resets to sale price
- Current annual tax
- $2,944 · $245/mo
- Projected year-2 tax
- $3,549 · $296/mo
- Expected delta
- +$605/yr (+$50/mo · 20.6%)
ⓘ Screening estimate from a state-policy table — verify with the county assessor before closing.
Climate risk First Street
- Flood 1/10 Low FEMA zone X (unshaded) · 0% chance over 30 yrs
- Wildfire 1/10 Low
- Heat 5/10 Major 7 d/yr ≥105°F today · 20 d/yr by 30 yrs out
- Wind 4/10 Moderate 10% chance of damaging wind over 30 yrs
- Air quality 2/10 Low 1 unhealthy d/yr today · 1 by 30 yrs out
Nearby sold comps map
Loading sold comps map…
Walkable amenities ~0.75 mi
Loading nearby amenities…
Taxation est. · year 1
- Rental income
- $73,740
- − Mortgage interest
- −$28,002
- − Property taxes
- −$2,944
- − Insurance
- −$2,500
- − Repairs & maintenance
- −$5,899
- − Management
- −$5,899
- − Depreciation
- −$14,543
- Taxable income
- $13,953
- Est. tax owed @ 24.0%
- −$3,349
- After-tax cash flow
- $18,004/yr
For passive investors: Depreciation is non-cash, so a rental often shows a tax loss while cash-flowing — sheltering income. Rental losses are passive: they offset passive income freely, and up to $25,000/yr can offset ordinary (W-2) income if you actively participate and your MAGI is under $100k (phasing out to $0 by $150k); unused losses carry forward. On sale, claimed depreciation is recaptured at up to 25%, and gains may owe capital-gains tax (a 1031 exchange can defer both). Figures are a year-1 estimate at your 24.0% rate — not tax advice; consult a CPA.
Schools (NCES district)
- District
- Bedford County
- NCES district ID
- 4700180
- Math proficiency
- 24% ▼ -4.00%
- Reading proficiency
- 23% ▼ -3.00%
- Median HH income
- $41,704
- Composite
- 20.03/100
- National rank
- #8658
- State rank
- #97 of 139 in TN
Livability — Shelbyville
- Score
- 64/100
- State rank
- #183
- US rank
- #14818
Category grades
Schools grade is shown separately in the Schools card above.
Census & demographics
- Census place
- Shelbyville, TN
- County
- Bedford County · 38,148 people
- City population
- 38,148
- Metro
- Shelbyville, TN
- Population (ZIP)
- 38,148
- Household income
- $64,800
- Rent vs Own
- Severe rent burden
- 1093.0
Population outlook (Bedford County) Hauer SSP2
- Today (2025)
- 51,064 people
- By 2030
- 52,954 · +3.7%
- By 2040
- 56,534 · +10.7%
- By 2050
- 59,482 · +16.5%
- By 2075
- 65,597 · +28.5%
- By 2100
- 68,030 · +33.2%
Race, ethnicity, and origin ACS 2023
- Neighborhood character
- Predominantly White (66%)
- Race & ethnicity
- White 66% Hispanic / Latino 21% Two or more races 11% Black 8% Native American 2%
- Hispanic origin (detail)
- Mexican 15%
- Common ancestry
- Serbian 1% Lithuanian 1% Slovak 1%
- Foreign-born
- 9% · Canada
- Languages at home
- 84% English-only · Spanish 15% Arabic 1%
Political lean MEDSL · Bedford
- 2024 margin
- Solid R (+58.0) · D 20.5% · R 78.5%
- 2008→2024 swing
- -24.5pp toward R · 2008: -33.5pp · 2024: -58.0pp
- All cycles
- 2024: R+58.0 2020: R+51.9 2016: R+52.8 2012: R+40.3 2008: R+33.5
Not yet ingested
- Civics
- —
Market trends
- HPI YoY
- ▼ -99.18%
- Current HPI
- 330.802
- Rent YoY
- —
- Metro
- Shelbyville, TN
- State GDP YoY
- ▲ 2.78%
- F500 in state
- 22
Industry mix (Fortune 500 HQ in TN)
| Industry | F500 HQs | Revenue |
|---|---|---|
| Healthcare | 3 | $91B |
|
||
| Retail | 3 | $72B |
|
||
| Transportation / Logistics | 1 | $88B |
|
||
| Paper / Packaging | 1 | $19B |
|
||
| Insurance | 1 | $13B |
|
||
| Energy | 1 | $12B |
|
||
Price history
+899.8% since first listed31 events — show timeline
- 2026-06-09 Listed for Rent $850 SHOWMOJO
- 2026-05-30 Price Changed $499,900 REALTRACS as Distributed by MLS Grid
- 2026-04-26 Rental Removed $950 SHOWMOJO
- 2026-04-25 Rental Removed $950 SHOWMOJO
- 2026-04-21 Listed $525,000 REALTRACS as Distributed by MLS Grid
- 2026-01-23 Listed for Rent $950 SHOWMOJO
- 2025-12-04 Listed for Rent $950 SHOWMOJO
- 2025-08-03 Rental Removed $850 SHOWMOJO
- 2025-07-26 Listed for Rent $850 SHOWMOJO
- 2025-01-01 Listing Removed — REALTRACS as Distributed by MLS Grid
- 2024-07-19 Price Changed $524,900 REALTRACS as Distributed by MLS Grid
- 2024-06-03 Listed $538,500 REALTRACS as Distributed by MLS Grid
- 2022-02-03 Price Changed $650 RENT.
- 2020-12-07 Sold (Public Records) $265,000 Public Records
- 2018-04-30 Sold (Public Records) $123,500 Public Records
- 2018-04-30 Sold (MLS) $123,500 REALTRACS as Distributed by MLS Grid
- 2018-03-16 Pending — REALTRACS as Distributed by MLS Grid
- 2018-02-12 Price Changed $129,900 REALTRACS as Distributed by MLS Grid
- 2018-02-12 Relisted — REALTRACS as Distributed by MLS Grid
- 2018-01-24 Pending — REALTRACS as Distributed by MLS Grid
- 2018-01-15 Price Changed $139,900 REALTRACS as Distributed by MLS Grid
- 2017-12-15 Price Changed $144,900 REALTRACS as Distributed by MLS Grid
- 2017-11-22 Price Changed $149,900 REALTRACS as Distributed by MLS Grid
- 2017-11-06 Price Changed $154,900 REALTRACS as Distributed by MLS Grid
- 2017-10-19 Relisted — REALTRACS as Distributed by MLS Grid
- 2017-10-18 Contingent — REALTRACS as Distributed by MLS Grid
- 2017-09-29 Listed $159,900 REALTRACS as Distributed by MLS Grid
- 2011-09-01 Sold (Public Records) $128,100 Public Records
- 2007-10-09 Sold (Public Records) $124,000 Public Records
- 2005-07-11 Sold (Public Records) $148,000 Public Records
- 2004-02-24 Sold (Public Records) $50,000 Public Records
Property tax history
+2.9%/yrLatest (2025): $2,944 · +0.0% YoY. Source: county tax records.
Cash-flow waterfall
monthlySold comps — $/sqft
last 12 mo · ≤1 miLoading sold comps…