7847 Bergamot Cir · The Woodlands, TX
Flood risk No data
- FEMA flood zone
- —
- Chance of flooding over 30 yrs
- —
- Est. flood insurance / yr
- —
Fire risk No data
- Est. fire insurance / yr
- —
Heat risk No data
- Hot days now (above threshold)
- —
- Hot days in 30 yrs
- —
Wind risk No data
- Chance of severe wind over 30 yrs
- —
Air-quality risk No data
- Unhealthy air days now
- —
- Unhealthy air days in 30 yrs
- —
Risk factors via First Street. Map © Google.
Why this score? — see what drove the D- grade
The composite is a weighted blend of 9 inputs, each scored 0–100. Each bar is that input's sub-score; the figure is the points it added to the 100-point composite (weight × sub-score).
- Appreciation +10.0/10.0
- Cash flow +7.0/30.0
- Livability +4.5/5.0
- ARV discount +4.0/15.0
- Schools +3.9/10.0
- Rent growth +2.6/5.0
- Condition / age +2.5/5.0
- 1% rule +1.9/10.0
- DSCR +1.2/10.0
$303,900
🖨 Deal sheet (PDF) 📄 Offer letter ✓ Due diligence
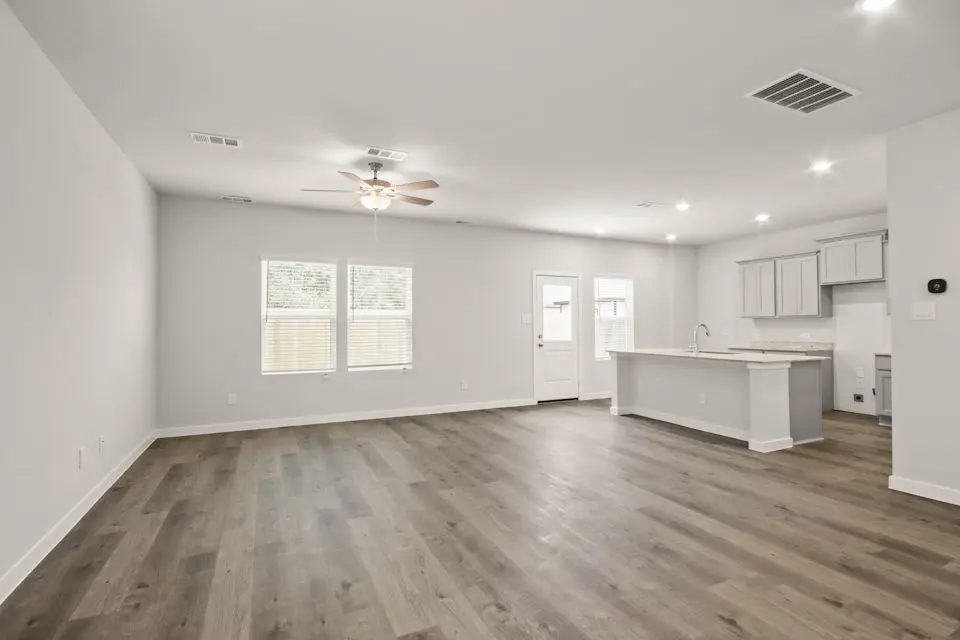
Listing remarks
For a home that's designed to complement any lifestyle, try the Leyland! The foyer leads back into an inviting layout, showcasing an open kitchen that overlooks a spacious great room and a dining area. With this floor plan, entertaining is just as easy as everyday living! The primary suite is upstairs, boasting a walk-in closet and a private bath with a walk-in shower. Two secondary bedrooms and a shared bath are nearby, and the laundry room is also conveniently located on this level.
Key facts
- Spacious great room
- Walk-in closet
- Private bath
Tags
Property features AI
Finance
- Financial info: List price $303,900
Exterior
- Parking: 2 total parking spaces; 2-car garage
- Home design: Single-family property; Address: 7847 Bergamot Cir, Magnolia TX 77354
- Exterior features: Living area approximately 1678
Interior
- Bedrooms: 3 bedrooms
- Bathrooms: 2 full bathrooms and 1 half bathroom (2.5 total)
- Interior features: Spec home (Leyland plan); Active listing
Neighborhood map
What this means for you Summary
Snapshot
- This is a 3-bed/2.5-bath single-family listed at $304k.
Deal economics
- At list price, monthly cash flow is $-451 ($-5k/yr) — negative.
- To cash-flow at today's rent, offer at most $239k (21.5% below list).
- To meet the 1% rule (rent ≥ 1% of price), the offer needs to be $209k (31.3% below list).
- Recommended offer: $209k (31.3% below list) — sets the bar for 1% rule.
- Cap rate 4.5% vs local median 2.3% in The Woodlands — top-decile yield for the area; either an underpriced asset or a hidden risk that comps aren't pricing in. Stress-test before assuming the spread holds.
Location & tenants
- Location reads 91/100 on livability (#1 in TX, #47 nationally) — a professional / high-income tenant draw. Strengths: amenities A+, commute A+, employment A+; Watch: cost of living D-.
- Magnolia ISD (rural): math 42% / reading 45% proficiency, ranked #247 of 826 in TX (top 30%) — families likely to look elsewhere, expect single-tenant / working-renter base with shorter leases.
- Zoned schools: Cedric C Smith (math 48% / reading 42%, grade D-, #1,133 of 4,322 statewide, top 27%, 724 students, 55% FRL); Bear Branch J H (math 44% / reading 46%, grade D, #479 of 1,662 statewide, top 29%, 1,076 students, 37% FRL); Magnolia H S (math 47% / reading 62%, grade C-, #379 of 1,632 statewide, top 26%, 2,248 students, 31% FRL) — zoned schools at 41% FRL track the district average.
- Market conditions: Rents flat; 1622 active listings in the ZIP; 9 comparable units currently listed for rent nearby; rentals at typical pace (median 26d on market — plan ~3-4 weeks tenant-placement turnaround); high-income renter base; 13,259 units permitted in Montgomery County in 2024 (1,402 in 5+ unit buildings).
Forward outlook
- In year one you build about $32k of equity ($2k loan paydown + $30k appreciation (10.0% local appreciation)).
- Montgomery County population projected at +65% by 2050 — long-run rental-demand tailwind backs the buy-and-hold thesis.
- By year 2, paydown + projected appreciation supports a ~$52k cash-out refi (75% LTV) — recoverable capital for the next deal without selling this one.
Negotiation context
- It's been on market 30 days — a 2% lower offer ($299k) is reasonable based on typical stale-listing flexibility.
Questions for the listing agent
- What do current leases actually rent for vs. the listed asking? Can we see a recent rent roll and the last 12 months of T-12 income?
- Is there a deadline driving the sale (1031 exchange, divorce, estate, relocation)? That informs how much negotiation room exists.
- Schools are A-rated — typically a magnet for longer-tenancy family renters. What's the average tenant stay here, and is there a school-zone premium baked into asking?
- The area grade is low — what's the realistic commute time and amenity access for the typical tenant pool here? Any planned neighborhood developments (good or bad) we should know about?
- What's the average days-on-market for RENTAL listings here right now (not sales)? A rising rental-DOM trend means longer vacancies and softer asking-rent achievability than the comps imply.
- What's the recent tenant-quality profile in this submarket — average credit score on applications, eviction rate, late-payment / NSF rate, and stable-employment percentage? A property-management company in the area should have these aggregated.
- How much new for-sale + rental construction is in the pipeline within 1–3 miles? Heavy new supply typically softens prices + rents 12–24 months out; constrained supply supports both.
Investment metrics
- 1% rule
- 0.69% ✗
- Cap rate
- 4.51%
- Cash-on-cash
- -6.36%
- DSCR
- 0.72
- GRM
- 12.1
CMA / ARV
- ARV (on-the-fly)
- $281,904
- Comps found
- 12
Show comp detail 12 sales within ~0.75 mi
| Address | Dist | Beds/Ba | Sqft | Sold | Price | $/sf | Match |
|---|---|---|---|---|---|---|---|
| 7745 Bergamot Cir | 0.04mi | 3/2.5 | 1,678 (0%) | 1mo | $284,900 | $170 | 97 |
| 7823 Bergamot Cir | 0.05mi | 3/2.5 | 1,678 (0%) | 1mo | $284,900 | $170 | 97 |
| 203 Brazen Forest Trl | 0.28mi | 3/2.5 | 1,678 (0%) | 2mo | $279,900 | $167 | 85 |
| 7749 Bergamot Cir | 0.05mi | 4/2.5 (+1) | 1,785 (+6%) | 0mo | $289,900 | $162 | 82 |
| 209 Valiant Ridge Trl | 0.37mi | 3/2.5 | 1,678 (0%) | 2mo | $284,900 | $170 | 81 |
| 175 Courageous Side Way | 0.47mi | 4/2.5 (+1) | 1,666 (-1%) | 1mo | $279,900 | $168 | 71 |
| 7819 Bergamot Cir | 0.05mi | 4/2.5 (+1) | 1,897 (+13%) | 1mo | $299,900 | $158 | 70 |
| 20 Courageous Side Way | 0.61mi | 3/2.5 | 1,708 (+2%) | 1mo | $288,990 | $169 | 68 |
| 8026 Peppercorn St | 0.49mi | 3/2.0 | 1,752 (+4%) | 2mo | $265,000 | $151 | 66 |
| 7950 Alset Dr | 0.36mi | 4/2.5 (+1) | 1,785 (+6%) | 2mo | $299,900 | $168 | 66 |
| 8031 Heroes Hall Dr | 0.44mi | 4/2.5 (+1) | 1,785 (+6%) | 0mo | $294,900 | $165 | 64 |
| 8410 Sweet Cherry Ln | 0.62mi | 3/2.0 | 1,500 (-11%) | 1mo | $285,000 | $190 | 51 |
Match score weights: distance 35% · size 25% · config 20% · recency 20%. Top-matched comps best support the ARV.
Projected returns pro-forma
10.0% appreciation · 0.32% rent growth · sell at horizon
- IRR
- 19.1%
- Equity multiple
- 2.54×
- Total profit
- $131,329
- Equity at exit
- $273,777
- IRR
- 17.1%
- Equity multiple
- 5.69×
- Total profit
- $399,450
- Equity at exit
- $590,411
Cash invested: $85,092 (down + closing). Projections, not guarantees.
Landlord ↔ Tenant lean methodology
- Overall (STATE)
- 87 Strongly Landlord-Friendly
- State Texas
- 87 Strongly Landlord-Friendly · R+5
- County
- — inherits STATE
- City
- — inherits STATE
ZIP-level market 77354
- Home prices YoY
- 2.4%
- Rents YoY
- 0.3%
- Active inventory
- 1622
- Price-to-rent
- 12.1×
Monthly cashflow live
- Estimated rent
- $2,087 high interval (Pro) →
- Mortgage (P&I)
- −$1,594
- Tax est. 1.5%
- −$380 /mo · $4,558/yr
- Insurance
- −$127
- HOA
- −$0
- Vacancy / Maint / Mgmt
- −$438
- Net cashflow
- $-451
Break-even live
Sensitivity live
| Price | -10% $-241 | -5% $-346 | +0% $-451 | +5% $-556 | +10% $-661 |
|---|---|---|---|---|---|
| Rent | -10% $-616 | -5% $-534 | +0% $-451 | +5% $-369 | +10% $-286 |
| Rate | -1.0pp $-298 | -0.5pp $-374 | base $-451 | +0.5pp $-530 | +1.0pp $-610 |
UW: 25.0% down · 7.5% · 30yr · 1.5% tax · 5.0% vac · 8.0% maint · 8.0% mgmt
Financing live
Cash to close
- Down payment
- $75,975
- Closing costs
- $9,117
- Reserves months
- —
- Total cash needed
- —
Loan-product check · same deal, 3 products live
Conventional
25% down · 7.5% · 30yr
- Down + closing
- —
- Monthly P&I
- —
- Monthly cashflow
- —
- DSCR
- —
- Eligible?
- —
Personal DTI + credit; lowest rate.
DSCR
20% down · 8.5% · 30yr
- Down + closing
- —
- Monthly P&I
- —
- Monthly cashflow
- —
- DSCR
- —
- Eligible?
- —
No personal income docs; deal must DSCR.
Hard money
10% down · 12.0% · 12mo
- Down + closing
- —
- Monthly P&I
- —
- Monthly cashflow
- —
- DSCR
- —
- Eligible?
- —
Short-term bridge; refi at stabilization.
Rent comps 9 comps
| Address | Beds | Baths | Sqft | Rent | $/sqft | DOM | Units | Dist |
|---|---|---|---|---|---|---|---|---|
| 7910 Alset Dr Magnolia, TX | 4.0 | 3.0 | 1897 | $2,320 | $1.22 | 45d | 1 | 0.29mi |
| 139 Valiant Ridge Trl Magnolia, TX | 3.0 | 2.0 | 1511 | $1,846 | $1.22 | 14d | 1 | 0.41mi |
| 131 Valiant Ridge Trl Magnolia, TX | 4.0 | 2.0 | 1840 | $2,280 | $1.24 | 0d | 1 | 0.43mi |
| 260 Gallant Front Ln Magnolia, TX | 3.0 | 2.0 | 1410 | $2,000 | $1.42 | 45d | 1 | 0.65mi |
| 260 Gallant Front Ln Magnolia, TX | 3.0 | 2.0 | 1410 | $1,975 | $1.40 | 26d | 1 | 0.65mi |
| 3 Peachridge Pl Unit 1 Spring, TX | 3.0 | 2.5 | 1657 | $1,950 | $1.18 | 22d | 1 | 1.25mi |
| 9396 Woodlands Pkwy Unit EASR Spring, TX | 2.0 | 2.0 | 1259 | $1,649 | $1.31 | 26d | 1 | 1.26mi |
| 9396 Woodlands Pkwy Unit EASR Spring, TX | 2.0 | 2.0 | 1259 | $1,649 | $1.31 | 13d | 1 | 1.26mi |
| 7698 Flintridge Dr Spring, TX | 2.0 | 2.0 | 1191 | $1,535 | $1.29 | 45d | 1 | 1.41mi |
Listing history 14 events
-
2026-06-21days on market $303,900 Active 30 DOM
-
2026-06-18days on market $303,900 Active 27 DOM
-
2026-06-17days on market $303,900 Active 26 DOM
-
2026-06-16days on market $303,900 Active 25 DOM
-
2026-06-15days on market $303,900 Active 24 DOM
-
2026-06-13days on market $303,900 Active 22 DOM
-
2026-06-09days on market $303,900 Active 18 DOM
-
2026-06-08days on market $303,900 Active 17 DOM
-
2026-06-07days on market $303,900 Active 16 DOM
-
2026-06-04days on market $303,900 Active 13 DOM
-
2026-06-03days on market $303,900 Active 12 DOM
-
2026-06-02days on market $303,900 Active 11 DOM
-
2026-06-01days on market $303,900 Active 10 DOM
-
2026-05-31days on market $303,900 Active 9 DOM
ⓘ Source: listings_history table (triggers on properties + properties_extension) + one-shot
backfill from property_details.listing_events for pre-trigger history.
Nearby sold comps map
Loading sold comps map…
Walkable amenities ~0.75 mi
Loading nearby amenities…
Taxation est. · year 1
- Rental income
- $25,049
- − Mortgage interest
- −$17,023
- − Property taxes
- −$4,558
- − Insurance
- −$1,520
- − Repairs & maintenance
- −$2,004
- − Management
- −$2,004
- − Depreciation
- −$8,841
- Taxable loss
- −$10,901
- Est. tax savings @ 24.0%
- +$2,616
- After-tax cash flow
- $-2,797/yr
For passive investors: Depreciation is non-cash, so a rental often shows a tax loss while cash-flowing — sheltering income. Rental losses are passive: they offset passive income freely, and up to $25,000/yr can offset ordinary (W-2) income if you actively participate and your MAGI is under $100k (phasing out to $0 by $150k); unused losses carry forward. On sale, claimed depreciation is recaptured at up to 25%, and gains may owe capital-gains tax (a 1031 exchange can defer both). Figures are a year-1 estimate at your 24.0% rate — not tax advice; consult a CPA.
Schools (NCES district)
- District
- Magnolia ISD
- NCES district ID
- 4828740
- Math proficiency
- 42% ▼ -7.00%
- Reading proficiency
- 45% ▼ -4.00%
- Median HH income
- $71,692
- Composite
- 39.46/100
- National rank
- #3958
- State rank
- #247 of 826 in TX
Livability — The Woodlands
- Score
- 91/100
- State rank
- #1
- US rank
- #47
Category grades
Schools grade is shown separately in the Schools card above.
Census & demographics
- County
- Montgomery County · 663,713 people
- City population
- 32,847
- Metro
- Houston-The Woodlands-Sugar Land, TX
- Population (ZIP)
- 44,900
- Household income
- $112,504
- Rent vs Own
- Severe rent burden
- 586.0
Population outlook (Montgomery County) Hauer SSP2
- Today (2025)
- 713,896 people
- By 2030
- 805,263 · +12.8%
- By 2040
- 992,708 · +39.1%
- By 2050
- 1,179,590 · +65.2%
- By 2075
- 1,628,084 · +128.1%
- By 2100
- 1,937,880 · +171.5%
Race, ethnicity, and origin ACS 2023
- Neighborhood character
- Predominantly White (66%)
- Race & ethnicity
- White 66% Hispanic / Latino 25% Two or more races 18% Black 3% Asian 1%
- Hispanic origin (detail)
- Mexican 14% Puerto Rican 1%
- Common ancestry
- Lithuanian 4% Slovak 2% Italian 2%
- Foreign-born
- 11% · Canada, Vietnam
- Languages at home
- 83% English-only · Spanish 15% Other Indo-European 1% German/W. Germanic 1%
Political lean MEDSL · Montgomery
- 2024 margin
- Solid R (+45.5) · D 26.8% · R 72.3%
- 2008→2024 swing
- +7.2pp toward D · 2008: -52.7pp · 2024: -45.5pp
- All cycles
- 2024: R+45.5 2020: R+43.8 2016: R+51.4 2012: R+60.7 2008: R+52.7
Not yet ingested
- Civics
- —
Market trends
- HPI YoY
- ▲ 12.09%
- Current HPI
- 512.87
- Rent YoY
- ▲ 0.32%
- Metro
- Houston-The Woodlands-Sugar Land, TX
- State GDP YoY
- ▲ 3.95%
- F500 in state
- 110
Industry mix (Fortune 500 HQ in TX)
| Industry | F500 HQs | Revenue |
|---|---|---|
| Energy | 16 | $1,198B |
|
||
| Technology | 5 | $198B |
|
||
| Engineering / Construction | 4 | $72B |
|
||
| Energy Services | 3 | $60B |
|
||
| Utilities | 3 | $41B |
|
||
| Healthcare | 2 | $330B |
|
||
Cash-flow waterfall
monthlySold comps — $/sqft
last 12 mo · ≤1 miLoading sold comps…