749 SW 120th Rd · Wilburton, OK
Flood risk 1/10 · Minimal
- FEMA flood zone
- X
- Chance of flooding over 30 yrs
- 0.0%
- Est. flood insurance / yr
- $507 – $1,088
Fire risk 6/10 · Moderate
- Est. fire insurance / yr
- $2,463 – $4,575
Heat risk 5/10 · Moderate
- Hot days now (above 112°F)
- 7 days/yr
- Hot days in 30 yrs
- 19 days/yr
Wind risk 3/10 · Minor
- Chance of severe wind over 30 yrs
- 5.0%
Air-quality risk 2/10 · Minimal
- Unhealthy air days now
- 1 days/yr
- Unhealthy air days in 30 yrs
- 1 days/yr
Risk factors via First Street. Map © Google.
Why this score? — see what drove the B grade
The composite is a weighted blend of 9 inputs, each scored 0–100. Each bar is that input's sub-score; the figure is the points it added to the 100-point composite (weight × sub-score).
- Cash flow +30.0/30.0
- 1% rule +10.0/10.0
- DSCR +10.0/10.0
- ARV discount +7.5/15.0
- Appreciation +5.2/10.0
- Livability +3.0/5.0
- Rent growth +2.5/5.0
- Condition / age +2.2/5.0
- Schools +2.0/10.0
$45,000
🖨 Deal sheet (PDF) 📄 Offer letter ✓ Due diligence
Listing remarks
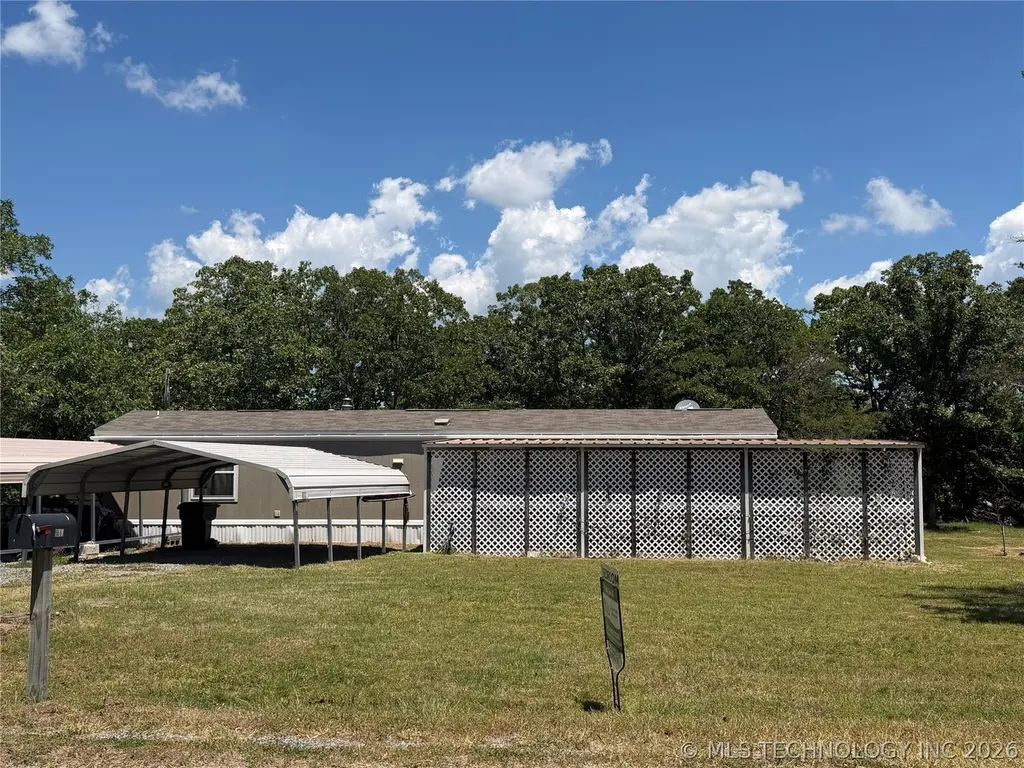
Attention Qualified Veterans! Discover this affordable and well-maintained mobile home located in the Veterans Colony just south of Wilburton. This property is perfect for veterans seeking a peaceful country setting with like-minded neighbors. Enjoy the outdoors with nearby lake access and plenty of acreage for recreation and relaxation. The home features a cozy single-wide layout with 2 bedrooms and 2 bathrooms, ready for you to personalize and make your own. Additional features include a carport and a storage building, providing everything needed for comfortable, simple living. Important: The home will convey as personal property. Qualified veterans will have the opportunity to lease t
Key facts
- Storage building
- Carport
- Plenty of acreage
Tags
Property features AI
Exterior
- Parking: 1-car garage; Carport
- Security: No safety shelter
- Utilities: Natural gas available; Water available (rural); Septic tank
- Home design: Single-wide manufactured home; 1 story; Faces south; Tie down foundation
- Construction: Vinyl siding; Asphalt/fiberglass roof
- Exterior features: Covered porch; Wooded lot
Interior
- Kitchen: Oven; Range
- Flooring: Concrete floors; Laminate floors
- Bathrooms: 2 full bathrooms
- Heating & cooling: Central heating (electric); Central air conditioning
- Interior features: Accessible approach with ramp; Handicap access; Laminate counters; Other interior features
Neighborhood map
What this means for you Summary
Snapshot
- This is a 2-bed/2.0-bath single-family listed at $45k. Condition is rated fair.
Deal economics
- At list price, monthly cash flow is $381 ($5k/yr) — positive.
- The deal already cash-flows at list — no discount required.
- Meets the 1% rule at list price ($877 rent vs $45k).
- Recommended offer: $44k (3.0% below list) — sets the bar for market timing.
Location & tenants
- Location reads 60/100 on livability (#351 in OK) — a middle-class / working-renter tenant base. Strengths: cost of living A+, housing A+, crime B+; Watch: amenities F, commute F, employment F.
- Wilburton (town): math 25% / reading 22% proficiency, ranked #136 of 270 in OK (top 50%) — low school quality limits family demand, transient renter base, plan for 1-2y turnover.
- Zoned schools: Wilburton Es (math 27% / reading 17%, grade F, #413 of 845 statewide, top 54%, 476 students, 0% FRL); Wilburton Ms (math 22% / reading 22%, grade F, #129 of 345 statewide, top 42%, 183 students, 0% FRL); Wilburton Hs (math 15% / reading 24%, grade F, #274 of 447 statewide, top 66%, 226 students, 0% FRL) — zoned schools average 0% FRL vs 51% district-wide (51 pts lower); this property's tenant base skews higher-income than the district average.
- Market conditions: 57 active listings in the ZIP.
Forward outlook
- In year one you build about $497 of equity ($311 loan paydown + $186 appreciation (0.4% local appreciation)).
- Latimer County population projected at -24% by 2050 — secular population decline; favor cash flow + early exit over multi-decade hold.
- At projected returns (0.4% appreciation + 3.0% rent growth), your $13k cash investment doubles in ~3 years — after that, you're playing with house money.
Negotiation context
- It's been on market 47 days — a 3% lower offer ($44k) is reasonable based on typical stale-listing flexibility.
Risks & watch-outs
- Climate carrying-cost: major wildfire risk; extreme-heat days projected 7→19/yr by 2055 (HVAC capex compounding) — expect insurance premiums to compound above CPI over the hold.
Questions for the listing agent
- It's been on market 47 days. Have you received any prior offers? Is the seller open to a 3% concession, seller financing, or rate buy-down credit?
- Have any recent inspections been done? Can we get a copy of the seller's disclosures and any deferred-maintenance estimates?
- Is there a deadline driving the sale (1031 exchange, divorce, estate, relocation)? That informs how much negotiation room exists.
- Schools are F-rated, which usually means shorter tenancies and higher turnover. Who's the typical renter profile here, and what's been the actual vacancy rate?
- What's the average days-on-market for RENTAL listings here right now (not sales)? A rising rental-DOM trend means longer vacancies and softer asking-rent achievability than the comps imply.
- What's the recent tenant-quality profile in this submarket — average credit score on applications, eviction rate, late-payment / NSF rate, and stable-employment percentage? A property-management company in the area should have these aggregated.
- How much new for-sale + rental construction is in the pipeline within 1–3 miles? Heavy new supply typically softens prices + rents 12–24 months out; constrained supply supports both.
Investment metrics
- 1% rule
- 1.95% ✓
- Cap rate
- 16.47%
- Cash-on-cash
- 36.33%
- DSCR
- 2.62
- GRM
- 4.3
CMA / ARV
No comps found within radius.
Projected returns pro-forma
0.41% appreciation · 3.0% rent growth · sell at horizon
- IRR
- 37.9%
- Equity multiple
- 2.89×
- Total profit
- $23,873
- Equity at exit
- $14,003
- IRR
- 40.6%
- Equity multiple
- 5.69×
- Total profit
- $59,042
- Equity at exit
- $17,600
Cash invested: $12,600 (down + closing). Projections, not guarantees.
Landlord ↔ Tenant lean methodology
- Overall (STATE)
- 83 Strongly Landlord-Friendly
- State Oklahoma
- 83 Strongly Landlord-Friendly · R+20
- County
- — inherits STATE
- City
- — inherits STATE
ZIP-level market 74578
- Home prices YoY
- 0.2%
- Active inventory
- 57
- Price-to-rent
- 4.3×
Monthly cashflow live
- Estimated rent
- $877 medium interval (Pro) →
- Mortgage (P&I)
- −$236
- Tax est. 1.5%
- −$56 /mo · $675/yr
- Insurance
- −$19
- HOA
- −$0
- Vacancy / Maint / Mgmt
- −$184
- Net cashflow
- $381
Break-even live
Sensitivity live
| Price | -10% $413 | -5% $397 | +0% $381 | +5% $366 | +10% $350 |
|---|---|---|---|---|---|
| Rent | -10% $312 | -5% $347 | +0% $381 | +5% $416 | +10% $451 |
| Rate | -1.0pp $404 | -0.5pp $393 | base $381 | +0.5pp $370 | +1.0pp $358 |
UW: 25.0% down · 7.5% · 30yr · 1.5% tax · 5.0% vac · 8.0% maint · 8.0% mgmt
Financing live
Cash to close
- Down payment
- $11,250
- Closing costs
- $1,350
- Reserves months
- —
- Total cash needed
- —
Loan-product check · same deal, 3 products live
Conventional
25% down · 7.5% · 30yr
- Down + closing
- —
- Monthly P&I
- —
- Monthly cashflow
- —
- DSCR
- —
- Eligible?
- —
Personal DTI + credit; lowest rate.
DSCR
20% down · 8.5% · 30yr
- Down + closing
- —
- Monthly P&I
- —
- Monthly cashflow
- —
- DSCR
- —
- Eligible?
- —
No personal income docs; deal must DSCR.
Hard money
10% down · 12.0% · 12mo
- Down + closing
- —
- Monthly P&I
- —
- Monthly cashflow
- —
- DSCR
- —
- Eligible?
- —
Short-term bridge; refi at stabilization.
Listing history 17 events
-
2026-06-21days on market $45,000 Active 47 DOM
-
2026-06-21days on market $45,000 Active 46 DOM
-
2026-06-18days on market $45,000 Active 44 DOM
-
2026-06-17days on market $45,000 Active 43 DOM
-
2026-06-16days on market $45,000 Active 42 DOM
-
2026-06-15days on market $45,000 Active 41 DOM
-
2026-06-13days on market $45,000 Active 39 DOM
-
2026-06-12days on market $45,000 Active 38 DOM
-
2026-06-09days on market $45,000 Active 35 DOM
-
2026-06-08days on market $45,000 Active 34 DOM
-
2026-06-08days on market $45,000 Active 33 DOM
-
2026-06-07days on market $45,000 Active 32 DOM
-
2026-06-04days on market $45,000 Active 29 DOM
-
2026-06-02days on market $45,000 Active 28 DOM
-
2026-06-01days on market $45,000 Active 27 DOM
-
2026-05-31days on market $45,000 Active 26 DOM
-
2026-05-05$45,000 Active
ⓘ Source: listings_history table (triggers on properties + properties_extension) + one-shot
backfill from property_details.listing_events for pre-trigger history.
Climate risk First Street
- Flood 1/10 Low FEMA zone X · 0% chance over 30 yrs
- Wildfire 6/10 Major
- Heat 5/10 Major 7 d/yr ≥112°F today · 19 d/yr by 30 yrs out
- Wind 3/10 Moderate 5% chance of damaging wind over 30 yrs
- Air quality 2/10 Low 1 unhealthy d/yr today · 1 by 30 yrs out
Nearby sold comps map
Loading sold comps map…
Walkable amenities ~0.75 mi
Loading nearby amenities…
Taxation est. · year 1
- Rental income
- $10,518
- − Mortgage interest
- −$2,521
- − Property taxes
- −$675
- − Insurance
- −$225
- − Repairs & maintenance
- −$841
- − Management
- −$841
- − Depreciation
- −$1,309
- Taxable income
- $4,105
- Est. tax owed @ 24.0%
- −$985
- After-tax cash flow
- $3,592/yr
For passive investors: Depreciation is non-cash, so a rental often shows a tax loss while cash-flowing — sheltering income. Rental losses are passive: they offset passive income freely, and up to $25,000/yr can offset ordinary (W-2) income if you actively participate and your MAGI is under $100k (phasing out to $0 by $150k); unused losses carry forward. On sale, claimed depreciation is recaptured at up to 25%, and gains may owe capital-gains tax (a 1031 exchange can defer both). Figures are a year-1 estimate at your 24.0% rate — not tax advice; consult a CPA.
Condition & rehab AI · 6 photos
This single-family home requires extensive repairs and updates to improve its condition and increase its value. The roof, exterior siding, flooring, interior walls, HVAC system, landscaping, foundation, and windows all need attention. Painting and updating the exterior siding, repairing and replacing the roof, and repairing and updating the HVAC system will significantly improve the home's curb appeal and increase both resale and rental value.
Repairs flagged
- Major roof — The roof appears to be in poor condition with visible damage.
- Moderate exterior siding — The exterior siding is in fair condition but shows signs of wear.
- Major flooring — The flooring appears to be in poor condition with visible wear and tear.
- Major interior walls/paint — The interior walls and paint appear to be in poor condition with visible wear and tear.
- Major HVAC system — The HVAC system appears to be in poor condition with visible rust and wear.
- Major landscaping — The landscaping is overgrown and in need of maintenance.
- Major foundation — The foundation and structure appear to be in poor condition with visible cracks and settling.
- Major windows — The windows appear to be in poor condition with visible damage and potential leaks.
Value-add opportunities
- Both painting and updating the exterior siding — Painting and updating the exterior siding will improve the curb appeal and increase both resale and rental value.
- Both repairing and replacing the roof — Repairing and replacing the roof will address a major issue and improve the home's overall condition.
- Both repairing and updating the HVAC system — Repairing and updating the HVAC system will improve the home's comfort and energy efficiency, increasing both resale and rental value.
- Both landscaping and maintaining the property — Landscaping and maintaining the property will improve the curb appeal and increase both resale and rental value.
- Both repairing and updating the foundation and structure — Repairing and updating the foundation and structure will address a major issue and improve the home's overall condition, increasing both resale and rental value.
- Both repairing and updating the windows — Repairing and updating the windows will address a major issue and improve the home's overall condition, increasing both resale and rental value.
Renovation cost estimate screening
| Repair item | Severity | Est. cost |
|---|---|---|
| roof · The roof appears to be in poor condition with visible damage. | Major | $15,000–50,000 |
| exterior siding · The exterior siding is in fair condition but shows signs of wear. | Moderate | $3,000–15,000 |
| flooring · The flooring appears to be in poor condition with visible wear and tear. | Major | $15,000–50,000 |
| interior walls/paint · The interior walls and paint appear to be in poor condition with visible wear and tear. | Major | $15,000–50,000 |
| HVAC system · The HVAC system appears to be in poor condition with visible rust and wear. | Major | $15,000–50,000 |
| landscaping · The landscaping is overgrown and in need of maintenance. | Major | $15,000–50,000 |
| foundation · The foundation and structure appear to be in poor condition with visible cracks and settling. | Major | $15,000–50,000 |
| windows · The windows appear to be in poor condition with visible damage and potential leaks. | Major | $15,000–50,000 |
| Total estimated repair cost · 8 items | $108,000–365,000 |
Value-add ROI direction
- Both painting and updating the exterior siding — Painting and updating the exterior siding will improve the curb appeal and increase both resale and rental value. ↑
- Both repairing and replacing the roof — Repairing and replacing the roof will address a major issue and improve the home's overall condition. ↑
- Both repairing and updating the HVAC system — Repairing and updating the HVAC system will improve the home's comfort and energy efficiency, increasing both resale and rental value. ↑
- Both landscaping and maintaining the property — Landscaping and maintaining the property will improve the curb appeal and increase both resale and rental value. ↑
- Both repairing and updating the foundation and structure — Repairing and updating the foundation and structure will address a major issue and improve the home's overall condition, increasing both resale and rental value. ↑
- Both repairing and updating the windows — Repairing and updating the windows will address a major issue and improve the home's overall condition, increasing both resale and rental value. ↑
ⓘ Cost ranges are severity-bucket heuristics (US national rule-of-thumb). Get contractor quotes + a written scope before underwriting a rehab budget.
Schools (NCES district)
- District
- Wilburton
- NCES district ID
- 4032790
- Math proficiency
- 25% ▼ -10.00%
- Reading proficiency
- 22% ▼ -11.00%
- Median HH income
- $38,345
- Composite
- 19.72/100
- National rank
- #8718
- State rank
- #136 of 270 in OK
Livability — Wilburton
- Score
- 60/100
- State rank
- #351
- US rank
- #19035
Category grades
Schools grade is shown separately in the Schools card above.
Census & demographics
- Population (ZIP)
- 5,721
Population outlook (Latimer County) Hauer SSP2
- Today (2025)
- 9,565 people
- By 2030
- 9,029 · -5.6%
- By 2040
- 8,084 · -15.5%
- By 2050
- 7,283 · -23.9%
- By 2075
- 5,893 · -38.4%
- By 2100
- 4,944 · -48.3%
Race, ethnicity, and origin ACS 2023
- Neighborhood character
- Diverse neighborhood (Simpson 0.62)
- Race & ethnicity
- White 61% Native American 24% Two or more races 10% Hispanic / Latino 5% Black 1%
- Common ancestry
- Italian 2% Lithuanian 1% Iranian 1%
- Foreign-born
- 1% · Canada
- Languages at home
- 97% English-only · Spanish 2%
Political lean MEDSL · Latimer
- 2024 margin
- Solid R (+65.6) · D 16.7% · R 82.3% · Other 1.0%
- 2008→2024 swing
- -28.5pp toward R · 2008: -37.1pp · 2024: -65.6pp
- All cycles
- 2024: R+65.6 2020: R+63.0 2016: R+56.7 2012: R+38.3 2008: R+37.1
Not yet ingested
- Civics
- —
Market trends
- HPI YoY
- ▲ 0.41%
- Current HPI
- 176.1285
- Rent YoY
- —
- Metro
- —
- State GDP YoY
- ▲ 1.55%
- F500 in state
- 6
Industry mix (Fortune 500 HQ in OK)
| Industry | F500 HQs | Revenue |
|---|---|---|
| Energy | 3 | $48B |
|
||
Price history
1 event — show timeline
- 2026-05-05 Listed $45,000 MLS Technology, Inc.
Cash-flow waterfall
monthlySold comps — $/sqft
last 12 mo · ≤1 miLoading sold comps…