 16-Plex
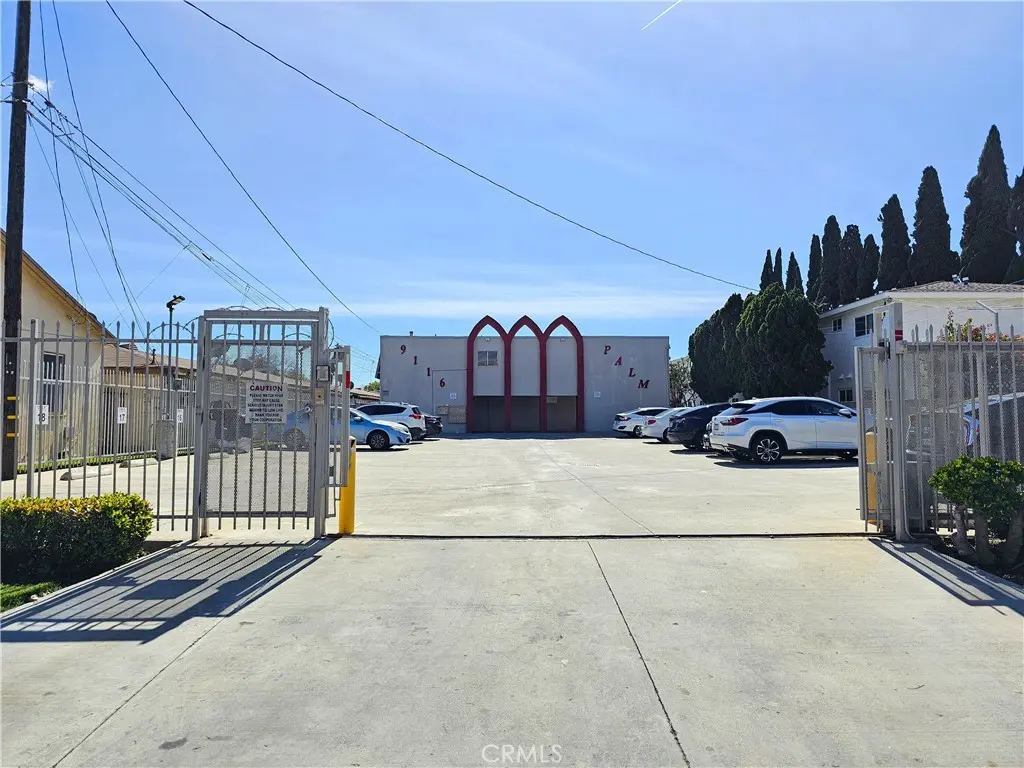
9116 Palm St · Bellflower, CA
Flood risk 1/10 · Minimal
- FEMA flood zone
- X
- Chance of flooding over 30 yrs
- 0.0%
- Est. flood insurance / yr
- $507 – $1,088
Fire risk 1/10 · Minimal
- Est. fire insurance / yr
- $659 – $1,223
Heat risk 5/10 · Moderate
- Hot days now (above 90°F)
- 7 days/yr
- Hot days in 30 yrs
- 22 days/yr
Wind risk 1/10 · Minimal
- Chance of severe wind over 30 yrs
- —
Air-quality risk 5/10 · Moderate
- Unhealthy air days now
- 7 days/yr
- Unhealthy air days in 30 yrs
- 9 days/yr
Risk factors via First Street. Map © Google.
Why this score? — see what drove the C grade
The composite is a weighted blend of 9 inputs, each scored 0–100. Each bar is that input's sub-score; the figure is the points it added to the 100-point composite (weight × sub-score).
- Cash flow +20.0/30.0
- ARV discount +14.5/15.0
- DSCR +6.4/10.0
- 1% rule +4.7/10.0
- Schools +3.8/10.0
- Rent growth +3.2/5.0
- Livability +3.1/5.0
- Condition / age +2.5/5.0
- Appreciation +0.0/10.0
$3,895,000
🖨 Deal sheet 📄 Offer letter ✓ Due diligence
Multi-family units
County records classify this as Multi-Family (5+ Unit). Listing-text estimate: 16 units. confirmed
5+ unit building — per-unit beds/baths from public records are typically unavailable; the breakdown below (if shown) is an estimate from the listing text.
Listing remarks MLS
A wonderful opportunity to own a well maintained 16 unit apartment in Bellflower. 8 units are 2 Bedroom, 1.5 Bath, appox. 875 Sqft. and 8 units are 1 Bedroom, 1 Bath, approx. 620 Sqft. 5 units have a patio, 5 units have a balcony/deck, and 3 units have a backyard. Laundry Room has 5 washers and 4 dryers (2 stacked units) that are owned. 1 large storage/office area, approx. 500Sqft with bathroom. Gross income is approx. $30,000 per month. Gated Complex with Remote/Code Access Car Entry. 25 Parking Spaces. Newer iron fence, Newer concrete parking lot, Newer water heater. Palm Street Park is located across the street with playgrounds for kids and numerous picnic tables. Perfect for gatherings and enjoying the outdoors. Conveniently located restaurants, banks, schools, shopping centers, parks, and more! Easy access to the 91, 605, 710 Freeways.
Key facts
- Gated complex
- 5 units have a patio
- 1 large storage area
Tags
Neighborhood map
What this means for you Summary
Snapshot
- This is a 16 × 2.0-bed/1.5-bath units multifamily listed at $3.90M.
Deal economics
- At list price, monthly cash flow is $5k ($58k/yr) — positive. Per door: $300/mo.
- The deal already cash-flows at list — no discount required.
- To meet the 1% rule (rent ≥ 1% of price), the offer needs to be $3.78M (2.9% below list).
- Recommended offer: $3.66M (6.0% below list) — sets the bar for market timing.
- Cap rate 7.8% vs local median 2.5% in Bellflower — top-decile yield for the area; either an underpriced asset or a hidden risk that comps aren't pricing in. Stress-test before assuming the spread holds.
Location & tenants
- Location reads 62/100 on livability (#483 in CA) — a middle-class / working-renter tenant base. Strengths: commute A+; Watch: amenities C-, health & safety D+, crime F.
- Bellflower Unified (suburban): math 32% / reading 50% proficiency, ranked #667 of 1,400 in CA (top 48%) — families likely to look elsewhere, expect single-tenant / working-renter base with shorter leases.
- Market conditions: Rents rising (+2.8%/yr); 70 active listings in the ZIP; solid renter incomes; 19,697 units permitted in Los Angeles County in 2024 (9,426 in 5+ unit buildings).
- At $37,816/mo this rent would consume 576% of the median local household income ($79k/yr) (locally 4049% of renters already pay >50% of income on rent) — very limited rent-growth headroom before tenants either downsize or default.
Forward outlook
- Local home prices are declining (-3.0%/yr); year-one equity from $27k of loan paydown is wiped out by about $117k of value loss. Plan a longer hold.
- Los Angeles County population projected at +9% by 2050 — modest demand growth; plan on rents tracking national, not racing it.
Negotiation context
- It's been on market 90 days — a 6% lower offer ($3.66M) is reasonable based on typical stale-listing flexibility.
- 7 sale attempts since 24y ago with the ask held roughly flat each time — persistent listings suggest the price (not the market) is what's stuck; bring a comps-based counter.
- Current owner paid $2.10M; list at $3.90M implies a 85% gain — meaningful room to come down on a strong offer.
Risks & watch-outs
- Climate carrying-cost: extreme-heat days projected 7→22/yr by 2055 (HVAC capex compounding) — expect insurance premiums to compound above CPI over the hold.
Questions for the listing agent
- It's been on market 90 days. Have you received any prior offers? Is the seller open to a 6% concession, seller financing, or rate buy-down credit?
- Can we see the unit-by-unit rent roll, current vacancy, and any below-market leases? What's the average tenancy length?
- What capital expenditures (roof, boiler, parking lot, exteriors) have been made in the last 5 years, and what's planned in the next 2?
- Built in 1963 — when were the roof, HVAC, electrical panel, plumbing, and water heater last replaced?
- Why hasn't it sold? Are there any deal-killer items the seller is aware of (foundation, flood, title, zoning, code violations)?
- Is there a deadline driving the sale (1031 exchange, divorce, estate, relocation)? That informs how much negotiation room exists.
- Crime grade is F in this area — have there been break-ins, vandalism, or insurance claims at this property in the last 3 years? What carrier currently insures it and at what premium?
- What's the average days-on-market for RENTAL listings here right now (not sales)? A rising rental-DOM trend means longer vacancies and softer asking-rent achievability than the comps imply.
- What's the recent tenant-quality profile in this submarket — average credit score on applications, eviction rate, late-payment / NSF rate, and stable-employment percentage? A property-management company in the area should have these aggregated.
- How much new apartment / multifamily construction is in the pipeline within 1–3 miles? Heavy new supply (>2% of stock underway) typically softens rents 12–24 months out; light construction supports rent growth.
Investment metrics
- 1% rule
- 0.97% ✗
- Cap rate
- 7.77%
- Cash-on-cash
- 5.29%
- DSCR
- 1.24
- GRM
- 8.6
CMA / ARV
- ARV (median comp)
- $4,609,479
- List price
- $3,895,000
- Delta
- -15.50%
- Verdict
- UNDERPRICED
- Comps
- 3 within 1.0 mi
Projected returns pro-forma
-3.0% appreciation · 2.79% rent growth · sell at horizon
- IRR
- -8.3%
- Equity multiple
- 0.69×
- Total profit
- $-333,554
- Equity at exit
- $580,757
- IRR
- 0.9%
- Equity multiple
- 1.06×
- Total profit
- $68,875
- Equity at exit
- $336,768
Cash invested: $1,090,600 (down + closing). Projections, not guarantees.
Landlord ↔ Tenant lean methodology
- Overall (STATE)
- 18 Strongly Tenant-Friendly
- State California
- 18 Strongly Tenant-Friendly · D+13
- County
- — inherits STATE
- City
- — inherits STATE
ZIP-level market 90706
- Rents YoY
- 2.8%
- Active inventory
- 70
- Price-to-rent
- 137.3×
Monthly cashflow live
- Estimated rent
- $37,816 high interval (Pro) →
- Mortgage (P&I)
- −$20,426
- Tax from tax record
- −$3,019 /mo · $36,230/yr
- Insurance
- −$1,623
- HOA
- −$0
- Vacancy / Maint / Mgmt
- −$7,941
- Net cashflow
- $4,807
Break-even live
16-unit breakdown (identical units grouped — click to expand)
| Units | Beds | Baths | Est. rent |
|---|---|---|---|
| 16× units | 2.0 | 1.5 | $37,824 |
| #1 | 2.0 | 1.5 | $2,364 |
| #2 | 2.0 | 1.5 | $2,364 |
| #3 | 2.0 | 1.5 | $2,364 |
| #4 | 2.0 | 1.5 | $2,364 |
| #5 | 2.0 | 1.5 | $2,364 |
| #6 | 2.0 | 1.5 | $2,364 |
| #7 | 2.0 | 1.5 | $2,364 |
| #8 | 2.0 | 1.5 | $2,364 |
| #9 | 2.0 | 1.5 | $2,364 |
| #10 | 2.0 | 1.5 | $2,364 |
| #11 | 2.0 | 1.5 | $2,364 |
| #12 | 2.0 | 1.5 | $2,364 |
| #13 | 2.0 | 1.5 | $2,364 |
| #14 | 2.0 | 1.5 | $2,364 |
| #15 | 2.0 | 1.5 | $2,364 |
| #16 | 2.0 | 1.5 | $2,364 |
| Total (16 units) | $37,816 | ||
UW: 25.0% down · 7.5% · 30yr · 1.5% tax · 5.0% vac · 8.0% maint · 8.0% mgmt
Financing live
Cash to close
- Down payment
- $973,750
- Closing costs
- $116,850
- Reserves months
- —
- Total cash needed
- —
Loan-product check · same deal, 3 products live
Conventional
25% down · 7.5% · 30yr
- Down + closing
- —
- Monthly P&I
- —
- Monthly cashflow
- —
- DSCR
- —
- Eligible?
- —
Personal DTI + credit; lowest rate.
DSCR
20% down · 8.5% · 30yr
- Down + closing
- —
- Monthly P&I
- —
- Monthly cashflow
- —
- DSCR
- —
- Eligible?
- —
No personal income docs; deal must DSCR.
Hard money
10% down · 12.0% · 12mo
- Down + closing
- —
- Monthly P&I
- —
- Monthly cashflow
- —
- DSCR
- —
- Eligible?
- —
Short-term bridge; refi at stabilization.
Listing history 38 events
-
2026-06-18days on market $3,895,000 Active 90 DOM
-
2026-06-17days on market $3,895,000 Active 89 DOM
-
2026-06-16days on market $3,895,000 Active 88 DOM
-
2026-06-15days on market $3,895,000 Active 87 DOM
-
2026-06-13days on market $3,895,000 Active 85 DOM
-
2026-06-13days on market $3,895,000 Active 84 DOM
-
2026-06-09days on market $3,895,000 Active 81 DOM
-
2026-06-08days on market $3,895,000 Active 80 DOM
-
2026-06-07days on market $3,895,000 Active 79 DOM
-
2026-06-04days on market $3,895,000 Active 76 DOM
-
2026-06-03days on market $3,895,000 Active 75 DOM
-
2026-06-02days on market $3,895,000 Active 74 DOM
-
2026-06-01days on market $3,895,000 Active 73 DOM
-
2026-05-31days on market $3,895,000 Active 72 DOM
-
2026-03-20$3,895,000 Active 853-char remark
Show marketing remark (853 chars)
A wonderful opportunity to own a well maintained 16 unit apartment in Bellflower. 8 units are 2 Bedroom, 1.5 Bath, appox. 875 Sqft. and 8 units are 1 Bedroom, 1 Bath, approx. 620 Sqft. 5 units have a patio, 5 units have a balcony/deck, and 3 units have a backyard. Laundry Room has 5 washers and 4 dryers (2 stacked units) that are owned. 1 large storage/office area, approx. 500Sqft with bathroom. Gross income is approx. $30,000 per month. Gated Complex with Remote/Code Access Car Entry. 25 Parking Spaces. Newer iron fence, Newer concrete parking lot, Newer water heater. Palm Street Park is located across the street with playgrounds for kids and numerous picnic tables. Perfect for gatherings and enjoying the outdoors. Conveniently located restaurants, banks, schools, shopping centers, parks, and more! Easy access to the 91, 605, 710 Freeways.
-
2025-05-27historical
-
2024-12-04historical Active Under Contract
-
2024-10-29price $3,795,000
-
2024-06-20price $3,995,000
-
2024-03-26$4,198,000 Active
-
2023-12-31historical
-
2023-09-05price $4,598,000
-
2023-04-24$4,895,000 Active
-
2022-07-05historical
-
2022-04-14$5,190,000 Active
-
2008-10-02soldstatus $2,100,000
-
2008-09-26soldstatus $2,100,000
-
2008-08-28historical
-
2008-07-22$2,085,000
-
2003-07-08soldstatus $1,405,000
-
2003-07-01soldstatus $1,405,000
-
2003-06-15soldstatus $1,405,000
-
2002-12-27$1,450,000
-
2002-12-26historical
-
2002-09-26$1,495,000
-
1996-12-20soldstatus $500,000
-
1989-10-03soldstatus $1,040,000
-
1989-10-03soldstatus $1,040,000
ⓘ Source: listings_history table (triggers on properties + properties_extension) + one-shot
backfill from property_details.listing_events for pre-trigger history.
Tax reassessment forecast CA · Resets to sale price
- Current annual tax
- $36,230 · $3,019/mo
- Projected year-2 tax
- $36,230 · $3,019/mo
- Expected delta
- $0/yr ($0/mo · 0.0%)
ⓘ Screening estimate from a state-policy table — verify with the county assessor before closing.
Climate risk First Street
- Flood 1/10 Low FEMA zone X · 0% chance over 30 yrs
- Wildfire 1/10 Low
- Heat 5/10 Major 7 d/yr ≥90°F today · 22 d/yr by 30 yrs out
- Wind 1/10 Low
- Air quality 5/10 Major 7 unhealthy d/yr today · 9 by 30 yrs out
Nearby sold comps map
Loading sold comps map…
Walkable amenities ~0.75 mi
Loading nearby amenities…
Taxation est. · year 1
- Rental income
- $453,792
- − Mortgage interest
- −$218,181
- − Property taxes
- −$36,230
- − Insurance
- −$19,475
- − Repairs & maintenance
- −$36,303
- − Management
- −$36,303
- − Depreciation
- −$113,309
- Taxable loss
- −$6,010
- Est. tax savings @ 24.0%
- +$1,442
- After-tax cash flow
- $59,123/yr
For passive investors: Depreciation is non-cash, so a rental often shows a tax loss while cash-flowing — sheltering income. Rental losses are passive: they offset passive income freely, and up to $25,000/yr can offset ordinary (W-2) income if you actively participate and your MAGI is under $100k (phasing out to $0 by $150k); unused losses carry forward. On sale, claimed depreciation is recaptured at up to 25%, and gains may owe capital-gains tax (a 1031 exchange can defer both). Figures are a year-1 estimate at your 24.0% rate — not tax advice; consult a CPA.
Schools (NCES district)
- District
- Bellflower Unified
- NCES district ID
- 0604440
- Math proficiency
- 32% ▲ 1.00%
- Reading proficiency
- 50% ▲ 1.00%
- Median HH income
- $56,090
- Composite
- 38.25/100
- National rank
- #8559
- State rank
- #667 of 1400 in CA
Livability — Bellflower
- Score
- 62/100
- State rank
- #483
- US rank
- #16431
Category grades
Schools grade is shown separately in the Schools card above.
Census & demographics
- Census place
- Bellflower, CA
- County
- Los Angeles County · 9,444,647 people
- City population
- 76,819
- Metro
- Los Angeles-Long Beach-Anaheim, CA
- Population (ZIP)
- 76,819
- Household income
- $78,722
- Rent vs Own
- Severe rent burden
- 4049.0
Population outlook (Los Angeles County) Hauer SSP2
- Today (2025)
- 10,940,515 people
- By 2030
- 11,256,481 · +2.9%
- By 2040
- 11,729,929 · +7.2%
- By 2050
- 11,948,407 · +9.2%
- By 2075
- 11,818,114 · +8.0%
- By 2100
- 10,842,928 · -0.9%
Race, ethnicity, and origin ACS 2023
- Neighborhood character
- Diverse neighborhood (Simpson 0.59)
- Race & ethnicity
- Hispanic / Latino 61% Two or more races 18% White 13% Asian 12% Black 11% Native American 1%
- Hispanic origin (detail)
- Mexican 50%
- Common ancestry
- Iranian 1%
- Foreign-born
- 31% · Canada, South Korea, Vietnam
- Languages at home
- 42% English-only · Spanish 46% Tagalog/Filipino 5% Other Asian/Pacific 2%
Political lean MEDSL · Los Angeles
- 2024 margin
- Solid D (+32.9) · D 64.8% · R 31.9% · Other 3.3%
- 2008→2024 swing
- -7.4pp toward R · 2008: 40.4pp · 2024: 32.9pp
- All cycles
- 2024: D+32.9 2020: D+44.2 2016: D+48.0 2012: D+40.0 2008: D+40.4
Not yet ingested
- Civics
- —
Market trends
- HPI YoY
- ▼ -796.81%
- Current HPI
- 407.4327
- Rent YoY
- ▲ 2.79%
- Metro
- Los Angeles-Long Beach-Anaheim, CA
- State GDP YoY
- ▲ 3.21%
- F500 in state
- 116
Industry mix (Fortune 500 HQ in CA)
| Industry | F500 HQs | Revenue |
|---|---|---|
| Technology | 27 | $1,492B |
|
||
| Financial Services | 3 | $174B |
|
||
| Retail | 3 | $44B |
|
||
| Insurance | 3 | $26B |
|
||
| Media / Entertainment | 2 | $115B |
|
||
| Pharmaceuticals / Biotech | 2 | $62B |
|
||
Price history
+274.5% since first listed24 events — show timeline
- 2026-03-20 Listed $3,895,000 CRMLS
- 2025-05-27 Listing Removed — CRMLS
- 2024-12-04 Contingent — CRMLS
- 2024-10-29 Price Changed $3,795,000 CRMLS
- 2024-06-20 Price Changed $3,995,000 CRMLS
- 2024-03-26 Listed $4,198,000 CRMLS
- 2023-12-31 Listing Removed — CRMLS
- 2023-09-05 Price Changed $4,598,000 CRMLS
- 2023-04-24 Listed $4,895,000 CRMLS
- 2022-07-05 Listing Removed — CRMLS
- 2022-04-14 Listed $5,190,000 CRMLS
- 2008-10-02 Sold (MLS) $2,100,000 CRMLS
- 2008-09-26 Sold (Public Records) $2,100,000 Public Records
- 2008-08-28 Listing Removed — CRMLS
- 2008-07-22 Listed $2,085,000 CRMLS
- 2003-07-08 Sold (Public Records) $1,405,000 Public Records
- 2003-07-01 Sold (Public Records) $1,405,000 Public Records
- 2003-06-15 Sold (MLS) $1,405,000 CRMLS
- 2002-12-27 Listed $1,450,000 CRMLS
- 2002-12-26 Listing Removed — CRMLS
- 2002-09-26 Listed $1,495,000 CRMLS
- 1996-12-20 Sold (Public Records) $500,000 Public Records
- 1989-10-03 Sold (Public Records) $1,040,000 Public Records
- 1989-10-03 Sold (Public Records) $1,040,000 Public Records
Property tax history
+3.5%/yrLatest (2025): $36,230 · +5.0% YoY. Source: county tax records.
Cash-flow waterfall
monthlySold comps — $/sqft
last 12 mo · ≤1 miLoading sold comps…