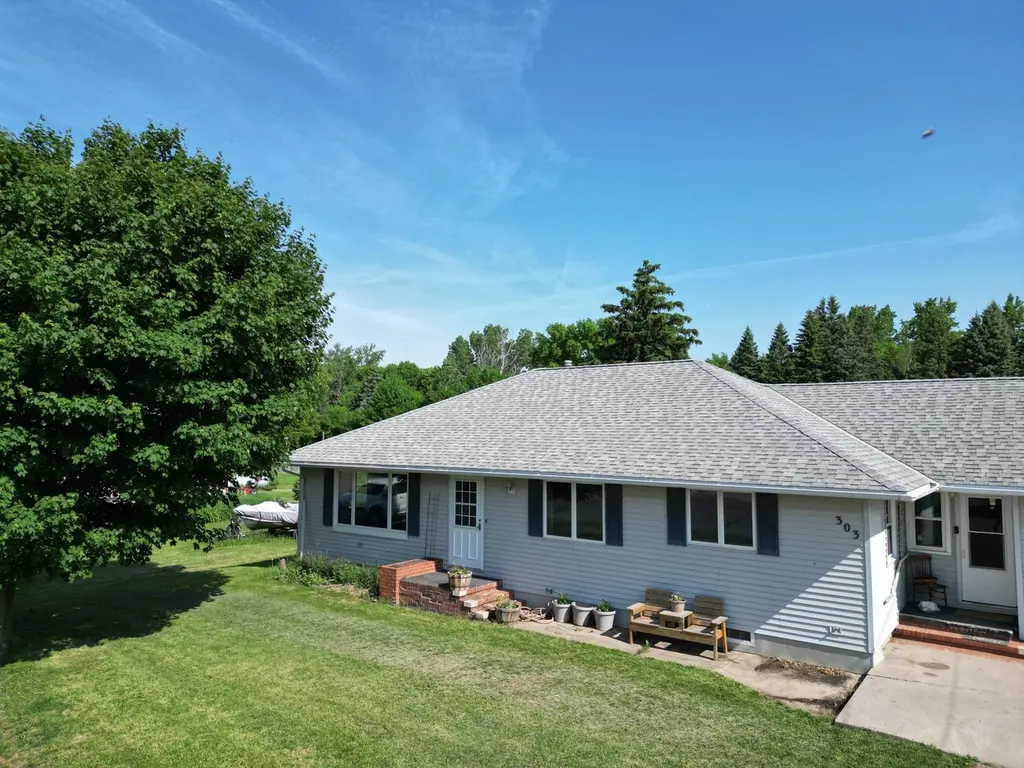
303 W Church St · St. Leo, MN
Flood risk 1/10 · Minimal
- FEMA flood zone
- X (unshaded)
- Chance of flooding over 30 yrs
- 0.0%
- Est. flood insurance / yr
- $473 – $860
Fire risk 1/10 · Minimal
- Est. fire insurance / yr
- $888 – $1,650
Heat risk 2/10 · Minimal
- Hot days now (above 100°F)
- 7 days/yr
- Hot days in 30 yrs
- 13 days/yr
Wind risk 2/10 · Minimal
- Chance of severe wind over 30 yrs
- —
Air-quality risk 2/10 · Minimal
- Unhealthy air days now
- 1 days/yr
- Unhealthy air days in 30 yrs
- 1 days/yr
Risk factors via First Street. Map © Google.
Why this score? — see what drove the C grade
The composite is a weighted blend of 9 inputs, each scored 0–100. Each bar is that input's sub-score; the figure is the points it added to the 100-point composite (weight × sub-score).
- Cash flow +23.4/30.0
- DSCR +7.5/10.0
- ARV discount +7.5/15.0
- 1% rule +5.2/10.0
- Schools +4.4/10.0
- Rent growth +2.5/5.0
- Livability +2.5/5.0
- Condition / age +2.5/5.0
- Appreciation +0.0/10.0
$119,900
🖨 Deal sheet (PDF) 📄 Offer letter ✓ Due diligence
Listing remarks
Welcome home to this spacious 3-bedroom, 1-bath rambler offering an impressive 2,655 sq. ft. of living space. Situated on a large lot, this property provides plenty of room both inside and out for comfortable living and entertaining. Conveniently located between Marshall, Granite Falls, and Canby, this home offers small-town charm with easy access to surrounding communities. Whether you're looking for your first home, more space for a growing family, or a place to make lasting memories, this property is ready for its next chapter. Don't miss the opportunity to make this wonderful property your next home!
Key facts
- 0.47 acre lot
- Garage
- Built 1956
Property features AI
Exterior
- Parking: Attached garage (1 car) — approximately 13x22
- Utilities: City water connected; City sewer connected; Propane fuel
- Home design: Residential single-story home; Main entry on the one level
- Construction: Block foundation; Asphalt roof (over 8 years old)
- Exterior features: Vinyl exterior; Chain-link fencing; Cleared lot with light tree coverage
Interior
- Kitchen: Main-level kitchen (12x12)
- Bedrooms: Three bedrooms on the main level (sizes: 12x17, 12x14, 12x14)
- Bathrooms: One full bathroom on the main level (5x14)
- Heating & cooling: Forced air heating; Central air conditioning
- Interior features: Main-level living with one level of living space; Unfinished block basement with storage space and sump pump
- Laundry & utility: Main-level laundry room (6x19)
Neighborhood map
What this means for you Summary
Snapshot
- This is a 3-bed/1.0-bath single-family listed at $120k.
Deal economics
- At list price, monthly cash flow is $223 ($3k/yr) — positive.
- The deal already cash-flows at list — no discount required.
- Meets the 1% rule at list price ($1k rent vs $120k).
- Recommended offer: $118k (1.5% below list) — sets the bar for market timing.
Location & tenants
- Location reads: area grade C — affects rentability + tenant quality, not the cash-flow math above.
- Canby Public School District (rural): math 52% / reading 52% proficiency, ranked #99 of 301 in MN (top 33%) — acceptable for families but not a draw, mixed tenant base, ~2y average lease.
- Zoned schools: Canby Elementary (math 67% / reading 62%, grade B, #130 of 857 statewide, top 18%, 304 students, 49% FRL); Canby Secondary (math 37% / reading 42%, grade F, #246 of 471 statewide, top 59%, 303 students, 43% FRL) — zoned schools average 46% FRL vs 22% district-wide (24 pts higher); higher-poverty schools than district average — tighter screening recommended.
- Market conditions: 6 active listings in the ZIP; 7 units permitted in Yellow Medicine County in 2024 (0 in 5+ unit buildings).
Forward outlook
- Local home prices are declining (-3.0%/yr); year-one equity from $829 of loan paydown is wiped out by about $4k of value loss. Plan a longer hold.
- Yellow Medicine County population projected at -26% by 2050 — secular population decline; favor cash flow + early exit over multi-decade hold.
Negotiation context
- It's been on market 23 days — a 2% lower offer ($118k) is reasonable based on typical stale-listing flexibility.
- Current owner paid $32k; list at $120k implies a 275% gain — meaningful room to come down on a strong offer.
Risks & watch-outs
- Watch-outs: built in 1956 — expect roof / HVAC / electrical / plumbing capex.
Questions for the listing agent
- Built in 1956 — when were the roof, HVAC, electrical panel, plumbing, and water heater last replaced?
- Is there a deadline driving the sale (1031 exchange, divorce, estate, relocation)? That informs how much negotiation room exists.
- What's the average days-on-market for RENTAL listings here right now (not sales)? A rising rental-DOM trend means longer vacancies and softer asking-rent achievability than the comps imply.
- What's the recent tenant-quality profile in this submarket — average credit score on applications, eviction rate, late-payment / NSF rate, and stable-employment percentage? A property-management company in the area should have these aggregated.
- How much new for-sale + rental construction is in the pipeline within 1–3 miles? Heavy new supply typically softens prices + rents 12–24 months out; constrained supply supports both.
Investment metrics
- 1% rule
- 1.02% ✓
- Cap rate
- 8.52%
- Cash-on-cash
- 7.96%
- DSCR
- 1.35
- GRM
- 8.2
CMA / ARV
No comps found within radius.
Projected returns pro-forma
-3.0% appreciation · 3.0% rent growth · sell at horizon
- IRR
- -4.2%
- Equity multiple
- 0.84×
- Total profit
- $-5,289
- Equity at exit
- $17,877
- IRR
- 5.4%
- Equity multiple
- 1.40×
- Total profit
- $13,501
- Equity at exit
- $10,367
Cash invested: $33,572 (down + closing). Projections, not guarantees.
Landlord ↔ Tenant lean methodology
- Overall (STATE)
- 46 Balanced
- State Minnesota
- 46 Balanced · D+2
- County
- — inherits STATE
- City
- — inherits STATE
ZIP-level market 56264
- Home prices YoY
- -24.8%
- Active inventory
- 6
- Price-to-rent
- 8.2×
Monthly cashflow live
- Estimated rent
- $1,219 medium interval (Pro) →
- Mortgage (P&I)
- −$629
- Tax from tax record
- −$61 /mo · $736/yr
- Insurance
- −$50
- HOA
- −$0
- Vacancy / Maint / Mgmt
- −$256
- Net cashflow
- $223
Break-even live
Sensitivity live
| Price | -10% $290 | -5% $257 | +0% $223 | +5% $189 | +10% $155 |
|---|---|---|---|---|---|
| Rent | -10% $126 | -5% $174 | +0% $223 | +5% $271 | +10% $319 |
| Rate | -1.0pp $283 | -0.5pp $253 | base $223 | +0.5pp $192 | +1.0pp $160 |
UW: 25.0% down · 7.5% · 30yr · 1.5% tax · 5.0% vac · 8.0% maint · 8.0% mgmt
Financing live
Cash to close
- Down payment
- $29,975
- Closing costs
- $3,597
- Reserves months
- —
- Total cash needed
- —
Loan-product check · same deal, 3 products live
Conventional
25% down · 7.5% · 30yr
- Down + closing
- —
- Monthly P&I
- —
- Monthly cashflow
- —
- DSCR
- —
- Eligible?
- —
Personal DTI + credit; lowest rate.
DSCR
20% down · 8.5% · 30yr
- Down + closing
- —
- Monthly P&I
- —
- Monthly cashflow
- —
- DSCR
- —
- Eligible?
- —
No personal income docs; deal must DSCR.
Hard money
10% down · 12.0% · 12mo
- Down + closing
- —
- Monthly P&I
- —
- Monthly cashflow
- —
- DSCR
- —
- Eligible?
- —
Short-term bridge; refi at stabilization.
Listing history 18 events
-
2026-06-21days on market $119,900 Active 23 DOM
-
2026-06-21days on market $119,900 Active 22 DOM
-
2026-06-18days on market $119,900 Active 20 DOM
-
2026-06-17days on market $119,900 Active 19 DOM
-
2026-06-16days on market $119,900 Active 18 DOM
-
2026-06-15days on market $119,900 Active 17 DOM
-
2026-06-13days on market $119,900 Active 15 DOM
-
2026-06-12days on market $119,900 Active 14 DOM
-
2026-06-09days on market $119,900 Active 11 DOM
-
2026-06-08days on market $119,900 Active 10 DOM
-
2026-06-07days on market $119,900 Active 9 DOM
-
2026-06-05days on market $119,900 Active 7 DOM
-
2026-06-04days on market $119,900 Active 5 DOM
-
2026-06-02days on market $119,900 Active 4 DOM
-
2026-06-01days on market $119,900 Active 3 DOM
-
2026-05-31days on market $119,900 Active 2 DOM
-
2026-05-29$119,900 Active
-
2019-04-26soldstatus $32,000
ⓘ Source: listings_history table (triggers on properties + properties_extension) + one-shot
backfill from property_details.listing_events for pre-trigger history.
Tax reassessment forecast MN · Partial reset (capped growth)
- Current annual tax
- $736 · $61/mo
- Projected year-2 tax
- $1,039 · $87/mo
- Expected delta
- +$303/yr (+$25/mo · 41.2%)
ⓘ Screening estimate from a state-policy table — verify with the county assessor before closing.
Climate risk First Street
- Flood 1/10 Low FEMA zone X (unshaded) · 0% chance over 30 yrs
- Wildfire 1/10 Low
- Heat 2/10 Low 7 d/yr ≥100°F today · 13 d/yr by 30 yrs out
- Wind 2/10 Low
- Air quality 2/10 Low 1 unhealthy d/yr today · 1 by 30 yrs out
Nearby sold comps map
Loading sold comps map…
Walkable amenities ~0.75 mi
Loading nearby amenities…
Taxation est. · year 1
- Rental income
- $14,622
- − Mortgage interest
- −$6,716
- − Property taxes
- −$736
- − Insurance
- −$600
- − Repairs & maintenance
- −$1,170
- − Management
- −$1,170
- − Depreciation
- −$3,488
- Taxable income
- $743
- Est. tax owed @ 24.0%
- −$178
- After-tax cash flow
- $2,493/yr
For passive investors: Depreciation is non-cash, so a rental often shows a tax loss while cash-flowing — sheltering income. Rental losses are passive: they offset passive income freely, and up to $25,000/yr can offset ordinary (W-2) income if you actively participate and your MAGI is under $100k (phasing out to $0 by $150k); unused losses carry forward. On sale, claimed depreciation is recaptured at up to 25%, and gains may owe capital-gains tax (a 1031 exchange can defer both). Figures are a year-1 estimate at your 24.0% rate — not tax advice; consult a CPA.
Schools (NCES district)
- District
- Canby Public School District
- NCES district ID
- 2707470
- Math proficiency
- 52% ▼ -11.00%
- Reading proficiency
- 52% ▼ -16.00%
- Median HH income
- $48,782
- Composite
- 44.34/100
- National rank
- #2823
- State rank
- #99 of 301 in MN
Livability — St. Leo
No livability data for this city. (Only ~50 U.S. cities are tracked.)
Census & demographics
- Census place
- St. Leo, MN
- Population (ZIP)
- 2,185
Population outlook (Yellow Medicine County) Hauer SSP2
- Today (2025)
- 8,959 people
- By 2030
- 8,451 · -5.7%
- By 2040
- 7,514 · -16.1%
- By 2050
- 6,650 · -25.8%
- By 2075
- 5,306 · -40.8%
- By 2100
- 4,453 · -50.3%
Race, ethnicity, and origin ACS 2023
- Neighborhood character
- Predominantly White (85%)
- Race & ethnicity
- White 85% Hispanic / Latino 12% Two or more races 9%
- Hispanic origin (detail)
- Mexican 12%
- Common ancestry
- Portuguese 24% English 15% Romanian 4%
- Foreign-born
- 4% · Canada
- Languages at home
- 92% English-only · Spanish 7%
Political lean MEDSL · Yellow Medicine
- 2024 margin
- Solid R (+40.6) · D 28.7% · R 69.3% · Other 1.9%
- 2008→2024 swing
- -44.9pp toward R · 2008: 4.3pp · 2024: -40.6pp
- All cycles
- 2024: R+40.6 2020: R+37.0 2016: R+35.4 2012: R+6.3 2008: D+4.3
Not yet ingested
- Civics
- —
Market trends
- HPI YoY
- ▼ -50.69%
- Current HPI
- 153.4077
- Rent YoY
- —
- Metro
- —
- State GDP YoY
- ▲ 2.41%
- F500 in state
- 34
Industry mix (Fortune 500 HQ in MN)
| Industry | F500 HQs | Revenue |
|---|---|---|
| Healthcare | 2 | $407B |
|
||
| Retail | 2 | $150B |
|
||
| Consumer Goods | 2 | $32B |
|
||
| Industrial Machinery | 2 | $6B |
|
||
| Agriculture | 1 | $40B |
|
||
| Healthcare / Medical Devices | 1 | $32B |
|
||
Price history
+274.7% since first listed2 events — show timeline
- 2026-05-29 Listed $119,900 NORTHSTARMLS as Distributed by MLS Grid
- 2019-04-26 Sold (Public Records) $32,000 Public Records
Property tax history
+6.0%/yrLatest (2026): $736 · +8.9% YoY. Source: county tax records.
Cash-flow waterfall
monthlySold comps — $/sqft
last 12 mo · ≤1 miLoading sold comps…