264 Wellington St SW · Atlanta, GA
Flood risk 1/10 · Minimal
- FEMA flood zone
- X (unshaded)
- Chance of flooding over 30 yrs
- 0.0%
- Est. flood insurance / yr
- $473 – $860
Fire risk 1/10 · Minimal
- Est. fire insurance / yr
- $963 – $1,789
Heat risk 5/10 · Moderate
- Hot days now (above 103°F)
- 7 days/yr
- Hot days in 30 yrs
- 18 days/yr
Wind risk 6/10 · Moderate
- Chance of severe wind over 30 yrs
- 27.0%
Air-quality risk 4/10 · Minor
- Unhealthy air days now
- 4 days/yr
- Unhealthy air days in 30 yrs
- 6 days/yr
Risk factors via First Street. Map © Google.
Why this score? — see what drove the D grade
The composite is a weighted blend of 9 inputs, each scored 0–100. Each bar is that input's sub-score; the figure is the points it added to the 100-point composite (weight × sub-score).
- ARV discount +15.0/15.0
- Cash flow +10.2/30.0
- Livability +4.2/5.0
- Rent growth +3.2/5.0
- 1% rule +3.0/10.0
- DSCR +2.9/10.0
- Schools +2.7/10.0
- Condition / age +2.5/5.0
- Appreciation +0.0/10.0
$319,000
🖨 Deal sheet (PDF) 📄 Offer letter ✓ Due diligence
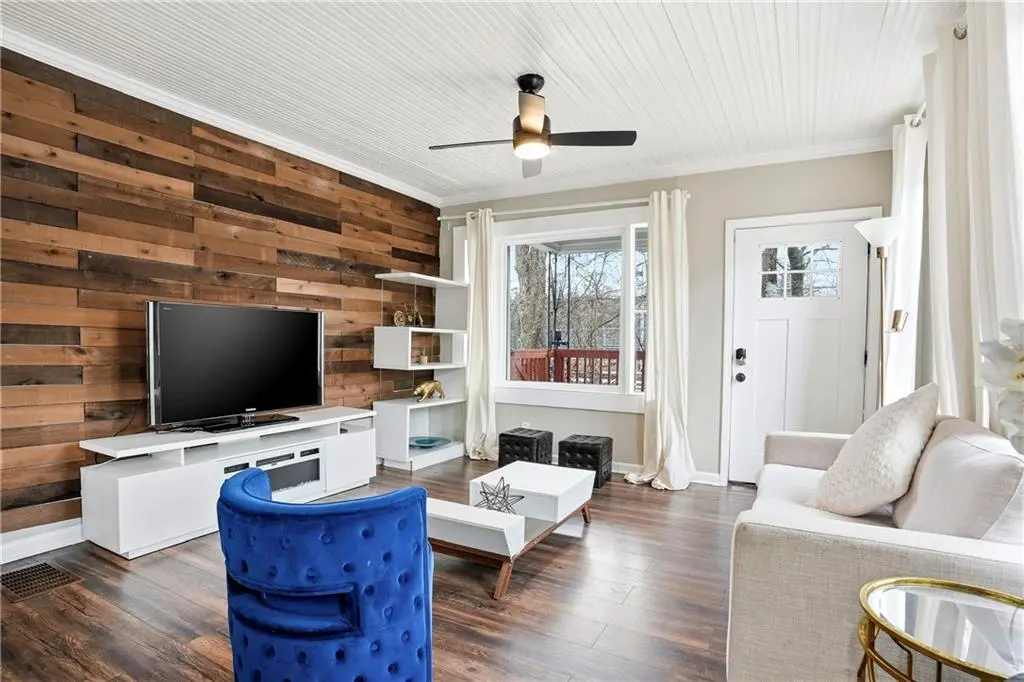
Listing remarks
Priced Aggressively to Sell – Exceptional Westside Atlanta Opportunity with Long-Term Upside Exceptional opportunity in Atlanta’s rapidly transforming Westside / Intown corridor, ideally suited for owner-occupants seeking in-town living with long-term appreciation potential, flexibility, and strong access to the city’s major destinations. Conveniently located near Mercedes-Benz Stadium, State Farm Arena, Centennial Olympic Park, and approximately 12 minutes from Hartsfield-Jackson Atlanta International Airport, this property offers excellent connectivity to Downtown Atlanta, major employment centers, transportation corridors, and entertainment districts. Enjoy close pro
Key facts
- Level backyard
- 5,052 sq ft lot
- Built 1935
Tags
Property features AI
Finance
- HOA & community: Near Beltline; Near public transportation; Near schools; Near shopping; Sidewalks
Exterior
- Parking: Gated parking (access via Wellington Street)
- Security: Satellite dish
- Utilities: Public water; Public sewer; 110 volt electrical; Cable available; Electricity available; Natural gas available; Sewer available; Water available
- Home design: One level; Resale property; Composition roof; Use 264 Wellington St SW for easiest access and parking; Wellington Street provides access to gated parking, backyard entry, and lower-level private entrance
- Construction: Construction materials: Other
- Exterior features: Private entrance; Private yard; Storage; Deck; Patio; Fenced yard with wood fencing
Interior
- Kitchen: White cabinets; Kitchen island; Pantry; Stone countertops; Dishwasher; Gas oven; Microwave; Refrigerator
- Bedrooms: Three main-level bedrooms; Primary bedroom on the main level
- Flooring: Hardwood flooring; Luxury vinyl flooring
- Bathrooms: Two full bathrooms; Primary bath has separate tub and shower
- Heating & cooling: Central heating (forced air) with natural gas; ENERGY STAR qualified heating equipment; Central air conditioning; Ceiling fans
- Interior features: 9-foot ceilings on the main level; ENERGY STAR qualified and insulated windows; No shared/common walls; Bonus room; Crawl space
- Laundry & utility: Washer included; Main-level laundry
Neighborhood map
What this means for you Summary
Snapshot
- This is a 3-bed/2.0-bath single-family listed at $319k.
Deal economics
- At list price, monthly cash flow is $-179 ($-2k/yr) — negative.
- To cash-flow at today's rent, offer at most $293k (8.1% below list).
- To meet the 1% rule (rent ≥ 1% of price), the offer needs to be $256k (19.6% below list).
- Recommended offer: $256k (19.6% below list) — sets the bar for 1% rule.
- Cap rate 5.6% vs local median 3.1% in Atlanta — top-decile yield for the area; either an underpriced asset or a hidden risk that comps aren't pricing in. Stress-test before assuming the spread holds.
Location & tenants
- Location reads 83/100 on livability (#6 in GA, #919 nationally) — a professional / high-income tenant draw. Strengths: amenities A+, commute A+, housing A+; Watch: cost of living C-.
- Atlanta Public Schools (urban): math 28% / reading 35% proficiency, ranked #80 of 174 in GA (top 46%) — families likely to look elsewhere, expect single-tenant / working-renter base with shorter leases; 71% free/reduced lunch — lower-income household profile, screen leases tightly.
- Zoned schools: Tuskegee Airman Global Academy (math 2% / reading 2%, grade F, #1,204 of 1,228 statewide, top 100%, 520 students, 100% FRL); Herman J. Russell West End Academy (math 12% / reading 12%, grade F, #417 of 470 statewide, top 90%, 399 students, 100% FRL); Booker T. Washington High School (math 24% / reading 24%, grade F, #184 of 424 statewide, top 48%, 831 students, 100% FRL) — zoned schools average 100% FRL vs 71% district-wide (29 pts higher); higher-poverty schools than district average — tighter screening recommended.
- Zoned-school proficiency averages 13% at this address vs 32% district-wide (-18 pts) — the specific schools serving this property underperform the Atlanta Public Schools average; the district grade overstates school quality for this exact location.
- Market conditions: Rents rising (+2.8%/yr); 459 active listings in the ZIP; 40 comparable units currently listed for rent nearby; rentals at typical pace (median 26d on market — plan ~3-4 weeks tenant-placement turnaround); 11,565 units permitted in Fulton County in 2024 (8,159 in 5+ unit buildings).
- At $2,564/mo this rent would consume 58% of the median local household income ($53k/yr) (locally 1676% of renters already pay >50% of income on rent) — very limited rent-growth headroom before tenants either downsize or default.
Forward outlook
- Local home prices are declining (-3.0%/yr); year-one equity from $2k of loan paydown is wiped out by about $10k of value loss. Plan a longer hold.
- Fulton County population projected at +38% by 2050 — long-run rental-demand tailwind backs the buy-and-hold thesis.
Negotiation context
- It's been on market 60 days — a 3% lower offer ($309k) is reasonable based on typical stale-listing flexibility.
- 8 sale attempts since 6y ago with the ask held roughly flat each time — persistent listings suggest the price (not the market) is what's stuck; bring a comps-based counter.
Risks & watch-outs
- Watch-outs: built in 1935 — expect roof / HVAC / electrical / plumbing capex.
- Climate carrying-cost: major wind risk, 27% chance of damaging wind over 30y; extreme-heat days projected 7→18/yr by 2055 (HVAC capex compounding) — expect insurance premiums to compound above CPI over the hold.
Questions for the listing agent
- What do current leases actually rent for vs. the listed asking? Can we see a recent rent roll and the last 12 months of T-12 income?
- It's been on market 60 days. Have you received any prior offers? Is the seller open to a 20% concession, seller financing, or rate buy-down credit?
- Built in 1935 — when were the roof, HVAC, electrical panel, plumbing, and water heater last replaced?
- Is there a deadline driving the sale (1031 exchange, divorce, estate, relocation)? That informs how much negotiation room exists.
- The area grade is low — what's the realistic commute time and amenity access for the typical tenant pool here? Any planned neighborhood developments (good or bad) we should know about?
- What's the average days-on-market for RENTAL listings here right now (not sales)? A rising rental-DOM trend means longer vacancies and softer asking-rent achievability than the comps imply.
- What's the recent tenant-quality profile in this submarket — average credit score on applications, eviction rate, late-payment / NSF rate, and stable-employment percentage? A property-management company in the area should have these aggregated.
- How much new for-sale + rental construction is in the pipeline within 1–3 miles? Heavy new supply typically softens prices + rents 12–24 months out; constrained supply supports both.
Investment metrics
- 1% rule
- 0.80% ✗
- Cap rate
- 5.62%
- Cash-on-cash
- -2.40%
- DSCR
- 0.89
- GRM
- 10.4
CMA / ARV
- ARV (median comp)
- $428,201
- List price
- $319,000
- Delta
- -25.50%
- Verdict
- UNDERPRICED
- Comps
- 20 within 1.0 mi
Show comp detail 12 sales within ~0.75 mi
| Address | Dist | Beds/Ba | Sqft | Sold | Price | $/sf | Match |
|---|---|---|---|---|---|---|---|
| 1280 Sells Ave SW | 0.52mi | 3/2.5 | 1,800 (+1%) | 2mo | $480,000 | $267 | 70 |
| 1459 Mozley Pl | 0.29mi | 3/2.5 | 1,599 (-10%) | 1mo | $389,900 | $244 | 66 |
| 442 Hopkins St SW | 0.55mi | 3/2.0 | 1,852 (+4%) | 3mo | $425,000 | $229 | 66 |
| 1699 Emerald Ave SW | 0.49mi | 3/2.0 | 1,856 (+4%) | 7mo | $245,000 | $132 | 65 |
| 1497 Eason St NW | 0.67mi | 3/2.0 | 1,710 (-4%) | 6mo | $300,000 | $175 | 57 |
| 1238 Greenwich St SW | 0.64mi | 3/2.5 | 1,892 (+6%) | 2mo | $485,000 | $256 | 56 |
| 1860 Penelope Rd NW | 0.69mi | 3/2.5 | 1,688 (-5%) | 1mo | $475,000 | $281 | 56 |
| 1265 Oak St SW | 0.71mi | 4/3.0 (+1) | 1,821 (+2%) | 5mo | $460,000 | $253 | 50 |
| 1336 Sharon St | 0.60mi | 4/2.0 (+1) | 1,612 (-10%) | 6mo | $187,000 | $116 | 46 |
| 136 Stafford St | 0.64mi | 3/2.0 | 1,571 (-12%) | 6mo | $445,000 | $283 | 45 |
| 1639 Rogers Ave SW | 0.75mi | 3/2.0 | 1,568 (-12%) | 3mo | $470,000 | $300 | 42 |
| 544 Langhorn St SW | 0.63mi | 4/2.5 (+1) | 1,570 (-12%) | 1mo | $277,500 | $177 | 42 |
Match score weights: distance 35% · size 25% · config 20% · recency 20%. Top-matched comps best support the ARV.
Projected returns pro-forma
-3.0% appreciation · 2.77% rent growth · sell at horizon
- IRR
- -20.5%
- Equity multiple
- 0.29×
- Total profit
- $-63,624
- Equity at exit
- $47,564
- IRR
- -14.2%
- Equity multiple
- 0.19×
- Total profit
- $-72,315
- Equity at exit
- $27,581
Cash invested: $89,320 (down + closing). Projections, not guarantees.
Landlord ↔ Tenant lean methodology
- Overall (STATE)
- 90 Strongly Landlord-Friendly
- State Georgia
- 90 Strongly Landlord-Friendly · R+3
- County
- — inherits STATE
- City
- — inherits STATE
ZIP-level market 30310
- Home prices YoY
- -32.8%
- Rents YoY
- 2.8%
- Active inventory
- 459
- Price-to-rent
- 10.4×
Monthly cashflow live
- Estimated rent
- $2,564 high interval (Pro) →
- Mortgage (P&I)
- −$1,673
- Tax est. 1.5%
- −$399 /mo · $4,785/yr
- Insurance
- −$133
- HOA
- −$0
- Vacancy / Maint / Mgmt
- −$539
- Net cashflow
- $-179
Break-even live
Sensitivity live
| Price | -10% $42 | -5% $-68 | +0% $-179 | +5% $-289 | +10% $-399 |
|---|---|---|---|---|---|
| Rent | -10% $-381 | -5% $-280 | +0% $-179 | +5% $-77 | +10% $24 |
| Rate | -1.0pp $-18 | -0.5pp $-98 | base $-179 | +0.5pp $-261 | +1.0pp $-345 |
UW: 25.0% down · 7.5% · 30yr · 1.5% tax · 5.0% vac · 8.0% maint · 8.0% mgmt
Financing live
Cash to close
- Down payment
- $79,750
- Closing costs
- $9,570
- Reserves months
- —
- Total cash needed
- —
Loan-product check · same deal, 3 products live
Conventional
25% down · 7.5% · 30yr
- Down + closing
- —
- Monthly P&I
- —
- Monthly cashflow
- —
- DSCR
- —
- Eligible?
- —
Personal DTI + credit; lowest rate.
DSCR
20% down · 8.5% · 30yr
- Down + closing
- —
- Monthly P&I
- —
- Monthly cashflow
- —
- DSCR
- —
- Eligible?
- —
No personal income docs; deal must DSCR.
Hard money
10% down · 12.0% · 12mo
- Down + closing
- —
- Monthly P&I
- —
- Monthly cashflow
- —
- DSCR
- —
- Eligible?
- —
Short-term bridge; refi at stabilization.
Rent comps 40 comps
| Address | Beds | Baths | Sqft | Rent | $/sqft | DOM | Units | Dist |
|---|---|---|---|---|---|---|---|---|
| 198 Wellington St SW Atlanta, GA | 3.0 | 2.5 | 1787 | $2,700 | $1.51 | 26d | 1 | 0.13mi |
| 176 Racine St SW Atlanta, GA | 3.0 | 2.0 | 1423 | $2,800 | $1.97 | 26d | 1 | 0.24mi |
| 1380 Mozley Pl SW Atlanta, GA | 3.0 | 2.0 | 1941 | $1,400 | $0.72 | 9d | 1 | 0.35mi |
| 1649 Derry Ave SW Atlanta, GA | 4.0 | 2.0 | 1825 | $3,200 | $1.75 | 26d | 1 | 0.37mi |
| 2111 Martin Luther King Junior Dr NW Atlanta, GA | 3.0 | 1.0 | 1470 | $1,800 | $1.22 | 26d | 1 | 0.40mi |
| 167 Rockmart Dr SW Atlanta, GA | 4.0 | 3.5 | 2347 | $3,033 | $1.29 | 26d | 1 | 0.48mi |
| 505 W Ontario Ave SW Atlanta, GA | 3.0 | 2.0 | 1587 | $2,800 | $1.76 | 22d | 1 | 0.48mi |
| 415 Hopkins St SW Atlanta, GA | 3.0 | 1.0 | 2550 | $2,000 | $0.78 | 7d | 1 | 0.50mi |
| 1619 Stokes Ave SW Atlanta, GA | 3.0 | 2.0 | 1332 | $2,400 | $1.80 | 4d | 1 | 0.50mi |
| 29 Chappell Rd NW Atlanta, GA | 3.0 | 2.0 | 1670 | $1,953 | $1.17 | 23d | 1 | 0.55mi |
| 0 W Lake Ave NW Atlanta, GA | 3.0 | 2.5 | 1300 | $1,900 | $1.46 | 3d | 1 | 0.56mi |
| 1420 Ralph David Abernathy Blvd SW Atlanta, GA | 3.0 | 2.0 | 1306 | $2,400 | $1.84 | 26d | 1 | 0.56mi |
| 1758 Emerald Ave SW Atlanta, GA | 4.0 | 2.0 | 1873 | $2,700 | $1.44 | 12d | 1 | 0.60mi |
| 220 Napoleon Dr SW Atlanta, GA | 4.0 | 3.0 | 2500 | $3,199 | $1.28 | 12d | 1 | 0.62mi |
| 66 Holly Rd NW Atlanta, GA | 3.0 | 2.5 | 1632 | $2,228 | $1.37 | 3d | 1 | 0.62mi |
| 1515 Westwood Ave SW Atlanta, GA | 3.0 | 2.5 | 2278 | $6,000 | $2.63 | 23d | 1 | 0.65mi |
| 1181 Westview Dr SW Atlanta, GA | 4.0 | 2.0 | 1392 | $2,400 | $1.72 | 26d | 1 | 0.67mi |
| 1265 Oak St SW Atlanta, GA | 4.0 | 3.0 | 1821 | $3,300 | $1.81 | 26d | 1 | 0.71mi |
| 1501 Rogers Ave SW Atlanta, GA | 3.0 | 1.0 | 1980 | $2,500 | $1.26 | 26d | 1 | 0.73mi |
| 1530 Rogers Ave SW Atlanta, GA | 4.0 | 3.0 | 2184 | $3,300 | $1.51 | 4d | 1 | 0.76mi |
| 1332 Akridge St NW Atlanta, GA | 3.0 | 2.0 | 1400 | $1,775 | $1.27 | 26d | 1 | 0.78mi |
| 1425 Oglethorpe Ave SW Atlanta, GA | 3.0 | 2.0 | 1540 | $2,950 | $1.92 | 7d | 1 | 0.79mi |
| 155 Rosser St SW Atlanta, GA | 3.0 | 2.0 | 1500 | $2,073 | $1.38 | 26d | 1 | 0.79mi |
| 702 Cascade Ave SW Atlanta, GA | 3.0 | 4.0 | 2220 | $2,850 | $1.28 | 26d | 1 | 0.82mi |
| 120 Burbank Dr NW Atlanta, GA | 3.0 | 2.0 | 1331 | $1,795 | $1.35 | 26d | 1 | 0.86mi |
| 195 W Lake Ave NW Unit 1 Atlanta, GA | 3.0 | 2.0 | 1245 | $2,850 | $2.29 | 0d | 1 | 0.88mi |
| 195 W Lake Ave NW Unit 1 Atlanta, GA | 3.0 | 2.0 | 1245 | $2,654 | $2.13 | 26d | 1 | 0.88mi |
| 1578 Linda Way SW Atlanta, GA | 3.0 | 2.0 | 1343 | $2,030 | $1.51 | 15d | 1 | 0.95mi |
| 1770 Springview Rd NW Atlanta, GA | 3.0 | 2.0 | 1262 | $2,000 | $1.58 | 26d | 1 | 0.95mi |
| 1735 Alvarado Ter SW Atlanta, GA | 3.0 | 2.0 | 1235 | $1,595 | $1.29 | 23d | 1 | 0.98mi |
| 1473 Beecher St SW Atlanta, GA | 3.0 | 2.0 | 1547 | $2,600 | $1.68 | 26d | 1 | 1.00mi |
| 1474 Beecher St SW Atlanta, GA | 3.0 | 2.0 | 1332 | $3,200 | $2.40 | 26d | 1 | 1.03mi |
| 1448 Rome Dr NW Unit 1448 Atlanta, GA | 3.0 | 2.5 | 1400 | $2,300 | $1.64 | 14d | 1 | 1.04mi |
| 1000 Palmetto Ave SW Atlanta, GA | 3.0 | 2.0 | 1566 | $1,925 | $1.23 | 26d | 1 | 1.04mi |
| 684 Grady Pl SW Atlanta, GA | 4.0 | 2.5 | 1806 | $2,550 | $1.41 | 14d | 1 | 1.05mi |
| 660 Queen St SW Unit B Atlanta, GA | 3.0 | 3.0 | 1840 | $3,250 | $1.77 | 26d | 1 | 1.06mi |
| 660 Queen St SW Unit A Atlanta, GA | 3.0 | 2.0 | 1840 | $2,500 | $1.36 | 26d | 1 | 1.06mi |
| 15 Ollie St NW Atlanta, GA | 3.0 | 2.5 | 1594 | $3,150 | $1.98 | 26d | 1 | 1.09mi |
| 316 Henry Aaron Ave SW Atlanta, GA | 3.0 | 2.0 | 1740 | $1,580 | $0.91 | 26d | 1 | 1.10mi |
| 1448 Westboro Dr SW Atlanta, GA | 3.0 | 2.0 | 1437 | $2,300 | $1.60 | 9d | 1 | 1.13mi |
Listing history 41 events
-
2026-06-21days on market $319,000 Active 60 DOM
-
2026-06-18days on market $319,000 Active 57 DOM
-
2026-06-17days on market $319,000 Active 56 DOM
-
2026-06-16days on market $319,000 Active 55 DOM
-
2026-06-15days on market $319,000 Active 54 DOM
-
2026-06-13days on market $319,000 Active 52 DOM
-
2026-06-13days on market $319,000 Active 51 DOM
-
2026-06-09days on market $319,000 Active 48 DOM
-
2026-06-08days on market $319,000 Active 47 DOM
-
2026-06-07days on market $319,000 Active 46 DOM
-
2026-06-04days on market $319,000 Active 43 DOM
-
2026-06-03days on market $319,000 Active 42 DOM
-
2026-06-02days on market $319,000 Active 41 DOM
-
2026-06-01days on market $319,000 Active 40 DOM
-
2026-05-31days on market $319,000 Active 39 DOM
-
2026-04-22$319,000 Active 2324-char remark
-
2026-01-13historical
-
2026-01-05status Active
-
2025-12-17status Active
-
2025-11-08historical $2,245
-
2025-11-06price $2,245
-
2025-11-05price $2,345
-
2025-11-04price $2,445
-
2025-11-02price $2,545
-
2025-10-31price $2,645
-
2025-10-28price $2,945
-
2025-10-23price $2,299
-
2025-10-16price $2,550
-
2025-10-13$2,850
-
2025-10-01price $385,000
-
2025-09-11$389,900 Active
-
2025-07-25historical $2,750
-
2025-06-29$2,995
-
2020-12-14historical
-
2020-10-30price $319,000
-
2020-10-14price $325,000
-
2020-10-02$329,000 New
-
2020-08-14historical
-
2020-07-01price $319,000
-
2020-06-04price $329,000
-
2020-03-12$335,000 New
ⓘ Source: listings_history table (triggers on properties + properties_extension) + one-shot
backfill from property_details.listing_events for pre-trigger history.
Climate risk First Street
- Flood 1/10 Low FEMA zone X (unshaded) · 0% chance over 30 yrs
- Wildfire 1/10 Low
- Heat 5/10 Major 7 d/yr ≥103°F today · 18 d/yr by 30 yrs out
- Wind 6/10 Major 27% chance of damaging wind over 30 yrs
- Air quality 4/10 Moderate 4 unhealthy d/yr today · 6 by 30 yrs out
Nearby sold comps map
Loading sold comps map…
Walkable amenities ~0.75 mi
Loading nearby amenities…
Taxation est. · year 1
- Rental income
- $30,773
- − Mortgage interest
- −$17,869
- − Property taxes
- −$4,785
- − Insurance
- −$1,595
- − Repairs & maintenance
- −$2,462
- − Management
- −$2,462
- − Depreciation
- −$9,280
- Taxable loss
- −$7,680
- Est. tax savings @ 24.0%
- +$1,843
- After-tax cash flow
- $-301/yr
For passive investors: Depreciation is non-cash, so a rental often shows a tax loss while cash-flowing — sheltering income. Rental losses are passive: they offset passive income freely, and up to $25,000/yr can offset ordinary (W-2) income if you actively participate and your MAGI is under $100k (phasing out to $0 by $150k); unused losses carry forward. On sale, claimed depreciation is recaptured at up to 25%, and gains may owe capital-gains tax (a 1031 exchange can defer both). Figures are a year-1 estimate at your 24.0% rate — not tax advice; consult a CPA.
Schools (NCES district)
- District
- Atlanta Public Schools
- NCES district ID
- 1300120
- Math proficiency
- 28% ▼ -6.00%
- Reading proficiency
- 35% ▼ -2.00%
- Median HH income
- $48,306
- Composite
- 27.27/100
- National rank
- #7006
- State rank
- #80 of 174 in GA
Livability — Atlanta
- Score
- 83/100
- State rank
- #6
- US rank
- #919
Category grades
Schools grade is shown separately in the Schools card above.
Census & demographics
- Census place
- Atlanta, GA
- County
- Fulton County · 1,094,430 people
- City population
- 629,525
- Metro
- Atlanta-Sandy Springs-Alpharetta, GA
- Population (ZIP)
- 27,186
- Household income
- $53,037
- Rent vs Own
- Severe rent burden
- 1676.0
Population outlook (Fulton County) Hauer SSP2
- Today (2025)
- 1,203,707 people
- By 2030
- 1,299,706 · +8.0%
- By 2040
- 1,488,256 · +23.6%
- By 2050
- 1,664,580 · +38.3%
- By 2075
- 2,036,072 · +69.2%
- By 2100
- 2,222,402 · +84.6%
Race, ethnicity, and origin ACS 2023
- Neighborhood character
- Predominantly Black (76%)
- Race & ethnicity
- Black 76% White 14% Two or more races 4% Hispanic / Latino 4% Asian 2%
- Common ancestry
- Lithuanian 1% Slovak 1% Serbian 0%
- Foreign-born
- 5% · Canada, South Korea, Vietnam
- Languages at home
- 92% English-only · Spanish 4% French/Haitian/Cajun 1% Other Indo-European 1%
Political lean MEDSL · Fulton
- 2024 margin
- Solid D (+44.9) · D 71.9% · R 27.0% · Other 1.1%
- 2008→2024 swing
- +9.8pp toward D · 2008: 35.0pp · 2024: 44.9pp
- All cycles
- 2024: D+44.9 2020: D+46.4 2016: D+42.1 2012: D+29.6 2008: D+35.0
Not yet ingested
- Civics
- —
Market trends
- HPI YoY
- ▼ -204.00%
- Current HPI
- 418.7297
- Rent YoY
- ▲ 2.77%
- Metro
- Atlanta-Sandy Springs-Alpharetta, GA
- State GDP YoY
- ▲ 2.66%
- F500 in state
- 28
Industry mix (Fortune 500 HQ in GA)
| Industry | F500 HQs | Revenue |
|---|---|---|
| Paper / Packaging | 2 | $29B |
|
||
| Retail | 1 | $160B |
|
||
| Transportation / Logistics | 1 | $91B |
|
||
| Airlines | 1 | $62B |
|
||
| Consumer Goods | 1 | $47B |
|
||
| Utilities | 1 | $25B |
|
||
Price history
-4.8% since first listed26 events — show timeline
- 2026-04-22 Listed $319,000 FMLS
- 2026-01-13 Listing Removed — FMLS
- 2026-01-05 Relisted — FMLS
- 2025-12-17 Relisted — FMLS
- 2025-11-08 Rental Removed $2,245 RENTSPREE
- 2025-11-06 Price Changed $2,245 RENTSPREE
- 2025-11-05 Price Changed $2,345 RENTSPREE
- 2025-11-04 Price Changed $2,445 RENTSPREE
- 2025-11-02 Price Changed $2,545 RENTSPREE
- 2025-10-31 Price Changed $2,645 RENTSPREE
- 2025-10-28 Price Changed $2,945 RENTSPREE
- 2025-10-23 Price Changed $2,299 RENTSPREE
- 2025-10-16 Price Changed $2,550 RENTSPREE
- 2025-10-13 Listed for Rent $2,850 RENTSPREE
- 2025-10-01 Price Changed $385,000 FMLS
- 2025-09-11 Listed $389,900 FMLS
- 2025-07-25 Rental Removed $2,750 RENTSPREE
- 2025-06-29 Listed for Rent $2,995 RENTSPREE
- 2020-12-14 Listing Removed — GAMLS
- 2020-10-30 Price Changed $319,000 GAMLS
- 2020-10-14 Price Changed $325,000 GAMLS
- 2020-10-02 Listed $329,000 GAMLS
- 2020-08-14 Listing Removed — GAMLS
- 2020-07-01 Price Changed $319,000 GAMLS
- 2020-06-04 Price Changed $329,000 GAMLS
- 2020-03-12 Listed $335,000 GAMLS
Cash-flow waterfall
monthlySold comps — $/sqft
last 12 mo · ≤1 miLoading sold comps…