 Duplex
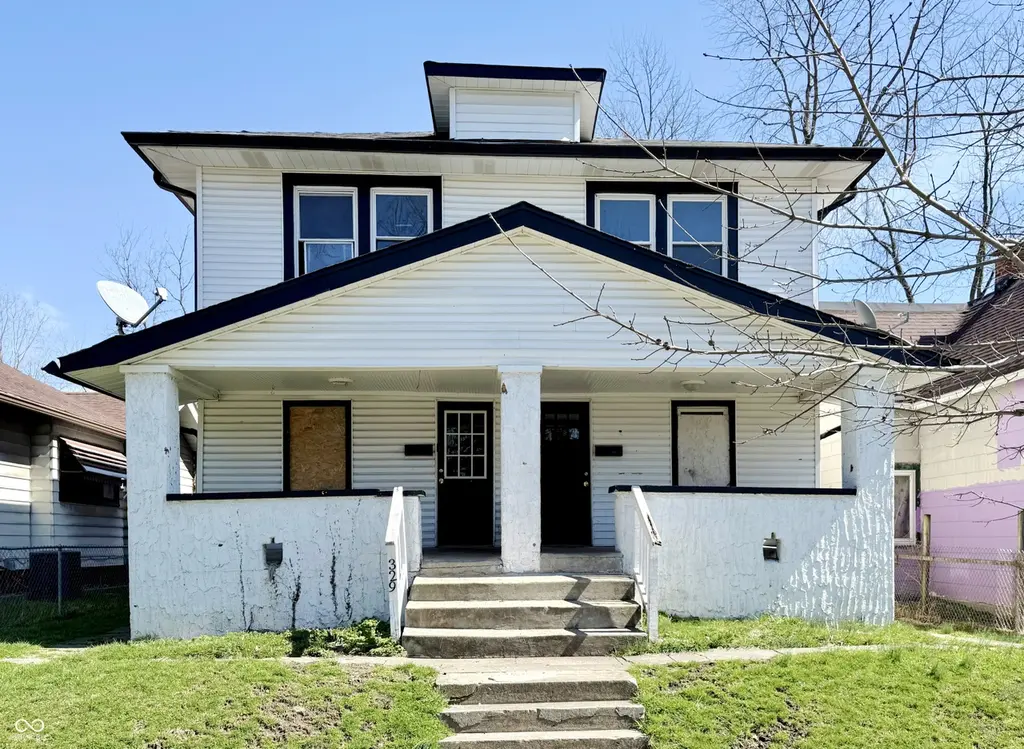
327 N Denny St · Indianapolis city (balance), IN
Flood risk No data
- FEMA flood zone
- —
- Chance of flooding over 30 yrs
- —
- Est. flood insurance / yr
- —
Fire risk No data
- Est. fire insurance / yr
- —
Heat risk No data
- Hot days now (above threshold)
- —
- Hot days in 30 yrs
- —
Wind risk No data
- Chance of severe wind over 30 yrs
- —
Air-quality risk No data
- Unhealthy air days now
- —
- Unhealthy air days in 30 yrs
- —
Risk factors via First Street. Map © Google.
Why this score? — see what drove the B- grade
The composite is a weighted blend of 9 inputs, each scored 0–100. Each bar is that input's sub-score; the figure is the points it added to the 100-point composite (weight × sub-score).
- Cash flow +30.0/30.0
- 1% rule +10.0/10.0
- DSCR +10.0/10.0
- ARV discount +7.8/15.0
- Rent growth +4.3/5.0
- Livability +2.5/5.0
- Condition / age +2.2/5.0
- Schools +1.4/10.0
- Appreciation +0.0/10.0
$169,900
🖨 Deal sheet (PDF) 📄 Offer letter ✓ Due diligence
Multi-family units
County records classify this as Multi-Family (2-4 Unit). Listing-text estimate: 2 units. confirmed
Listing remarks MLS
Nestled near the vibrant heart of Indianapolis, this duplex is minutes away from everything: entertainment, dining, and more. Come and see why this is perfect as an investment or a house hack. With some updates throughout, you already have a great start on this 2 level home featuring spacious rooms, additional storage, plenty of natural light, and some retained character. A covered porch houses two separate entrances and a large back yard gives access to the alley. Come and see why this is the one for you!
Key facts
- 5,401 sq ft lot
- Built 1925
- Listed 47 days
Neighborhood map
What this means for you Summary
Snapshot
- This is a 2 × 3-bed/2.0-bath units multifamily listed at $170k. Condition is rated fair.
Deal economics
- At list price, monthly cash flow is $882 ($11k/yr) — positive. Per door: $441/mo.
- The deal already cash-flows at list — no discount required.
- Meets the 1% rule at list price ($3k rent vs $170k).
- Recommended offer: $165k (3.0% below list) — sets the bar for market timing.
- Cap rate 12.5% vs local median 4.4% in Indianapolis city (balance) — top-decile yield for the area; either an underpriced asset or a hidden risk that comps aren't pricing in. Stress-test before assuming the spread holds.
Location & tenants
- Location reads: area grade B — affects rentability + tenant quality, not the cash-flow math above.
- Indianapolis Public Schools (urban): math 14% / reading 20% proficiency, ranked #286 of 301 in IN (top 95%) — low school quality limits family demand, transient renter base, plan for 1-2y turnover; 77% free/reduced lunch — lower-income household profile, screen leases tightly.
- Zoned schools: Frederick Douglass School 19 (math 9% / reading 13%, grade F, #909 of 994 statewide, top 92%, 444 students, 81% FRL); H L Harshman Middle School (math 3% / reading 16%, grade F, #316 of 330 statewide, top 96%, 549 students, 84% FRL).
- Market conditions: Rents rising fast (+7.3%/yr); 483 active listings in the ZIP; 1,906 units permitted in Marion County in 2024 (621 in 5+ unit buildings).
- At $2,603/mo this rent would consume 63% of the median local household income ($49k/yr) (locally 1906% of renters already pay >50% of income on rent) — very limited rent-growth headroom before tenants either downsize or default.
Forward outlook
- Local home prices are declining (-3.0%/yr); year-one equity from $1k of loan paydown is wiped out by about $5k of value loss. Plan a longer hold.
- Marion County population projected at +18% by 2050 — long-run rental-demand tailwind backs the buy-and-hold thesis.
- At projected returns (-3.0% appreciation + 7.3% rent growth), your $48k cash investment doubles in ~5 years — after that, you're playing with house money.
Negotiation context
- It's been on market 47 days — a 3% lower offer ($165k) is reasonable based on typical stale-listing flexibility.
- 2 sale attempts since 15y ago; this cycle's ask has dropped $10k (6%) from the opening price — seller is motivated, your offer sets the floor, not the list.
Risks & watch-outs
- Watch-outs: built in 1925 — expect roof / HVAC / electrical / plumbing capex.
Questions for the listing agent
- It's been on market 47 days. Have you received any prior offers? Is the seller open to a 3% concession, seller financing, or rate buy-down credit?
- Can we see the unit-by-unit rent roll, current vacancy, and any below-market leases? What's the average tenancy length?
- What capital expenditures (roof, boiler, parking lot, exteriors) have been made in the last 5 years, and what's planned in the next 2?
- Have any recent inspections been done? Can we get a copy of the seller's disclosures and any deferred-maintenance estimates?
- Built in 1925 — when were the roof, HVAC, electrical panel, plumbing, and water heater last replaced?
- Is there a deadline driving the sale (1031 exchange, divorce, estate, relocation)? That informs how much negotiation room exists.
- What's the average days-on-market for RENTAL listings here right now (not sales)? A rising rental-DOM trend means longer vacancies and softer asking-rent achievability than the comps imply.
- What's the recent tenant-quality profile in this submarket — average credit score on applications, eviction rate, late-payment / NSF rate, and stable-employment percentage? A property-management company in the area should have these aggregated.
- How much new apartment / multifamily construction is in the pipeline within 1–3 miles? Heavy new supply (>2% of stock underway) typically softens rents 12–24 months out; light construction supports rent growth.
Investment metrics
- 1% rule
- 1.53% ✓
- Cap rate
- 12.52%
- Cash-on-cash
- 22.25%
- DSCR
- 1.99
- GRM
- 5.4
CMA / ARV
- ARV (median comp)
- $170,968
- List price
- $169,900
- Delta
- -0.62%
- Verdict
- FAIR
- Comps
- 20 within 1.0 mi
Show comp detail 12 sales within ~0.75 mi
| Address | Dist | Beds/Ba | Sqft | Sold | Price | $/sf | Match |
|---|---|---|---|---|---|---|---|
| 33 N Sherman Dr | 0.22mi | 6/4.0 | 2,576 (-2%) | 5mo | $240,000 | $93 | 82 |
| 513 N Colorado Ave | 0.30mi | 6/2.0 | 2,568 (-2%) | 6mo | $75,000 | $29 | 69 |
| 450 N Kealing Ave | 0.26mi | 6/6.0 | 2,442 (-7%) | 10mo | $240,000 | $98 | 60 |
| 118 N Euclid Ave | 0.31mi | 6/2.0 | 2,628 (-0%) | 21mo | $125,000 | $48 | 60 |
| 30 & 32 N Dequincy St | 0.65mi | 6/4.0 | 2,674 (+2%) | 16mo | $290,000 | $108 | 54 |
| 442 N Denny St | 0.12mi | 6/2.0 | 2,280 (-13%) | 16mo | $159,000 | $70 | 51 |
| 4826 E Michigan St | 0.64mi | 7/3.0 (+1) | 2,775 (+5%) | 5mo | $291,000 | $105 | 48 |
| 18 N Gray St | 0.70mi | 6/2.0 | 2,668 (+1%) | 14mo | $105,000 | $39 | 45 |
| 4912 E Washington St | 0.70mi | 6/3.0 | 2,900 (+10%) | 2mo | $235,000 | $81 | 44 |
| 325 N Lasalle St | 0.52mi | 6/3.0 | 2,370 (-10%) | 15mo | $140,000 | $59 | 43 |
| 556 N Gray St N | 0.70mi | 6/3.0 | 2,382 (-10%) | 12mo | $169,000 | $71 | 37 |
| 28 S Dearborn St | 0.69mi | 5/3.0 (-1) | 2,266 (-14%) | 3mo | $240,000 | $106 | 33 |
Match score weights: distance 35% · size 25% · config 20% · recency 20%. Top-matched comps best support the ARV.
Projected returns pro-forma
-3.0% appreciation · 7.31% rent growth · sell at horizon
- IRR
- 19.8%
- Equity multiple
- 1.85×
- Total profit
- $40,475
- Equity at exit
- $25,333
- IRR
- 30.9%
- Equity multiple
- 4.38×
- Total profit
- $160,589
- Equity at exit
- $14,690
Cash invested: $47,572 (down + closing). Projections, not guarantees.
Landlord ↔ Tenant lean methodology
- Overall (STATE)
- 90 Strongly Landlord-Friendly
- State Indiana
- 90 Strongly Landlord-Friendly · R+11
- County
- — inherits STATE
- City
- — inherits STATE
ZIP-level market 46201
- Home prices YoY
- -33.9%
- Rents YoY
- 7.3%
- Active inventory
- 483
- Price-to-rent
- 10.9×
Monthly cashflow live
- Estimated rent
- $2,603 high interval (Pro) →
- Mortgage (P&I)
- −$891
- Tax est. 1.5%
- −$212 /mo · $2,548/yr
- Insurance
- −$71
- HOA
- −$0
- Vacancy / Maint / Mgmt
- −$547
- Net cashflow
- $882
Break-even live
Sensitivity live
| Price | -10% $1,000 | -5% $941 | +0% $882 | +5% $824 | +10% $765 |
|---|---|---|---|---|---|
| Rent | -10% $677 | -5% $779 | +0% $882 | +5% $985 | +10% $1,088 |
| Rate | -1.0pp $968 | -0.5pp $925 | base $882 | +0.5pp $838 | +1.0pp $793 |
2-unit breakdown (identical units grouped — click to expand)
| Units | Beds | Baths | Est. rent |
|---|---|---|---|
| 2× units | 3 | 2 | $2,602 |
| #1 | 3 | 2 | $1,301 |
| #2 | 3 | 2 | $1,301 |
| Total (2 units) | $2,603 | ||
UW: 25.0% down · 7.5% · 30yr · 1.5% tax · 5.0% vac · 8.0% maint · 8.0% mgmt
Financing live
Cash to close
- Down payment
- $42,475
- Closing costs
- $5,097
- Reserves months
- —
- Total cash needed
- —
Loan-product check · same deal, 3 products live
Conventional
25% down · 7.5% · 30yr
- Down + closing
- —
- Monthly P&I
- —
- Monthly cashflow
- —
- DSCR
- —
- Eligible?
- —
Personal DTI + credit; lowest rate.
DSCR
20% down · 8.5% · 30yr
- Down + closing
- —
- Monthly P&I
- —
- Monthly cashflow
- —
- DSCR
- —
- Eligible?
- —
No personal income docs; deal must DSCR.
Hard money
10% down · 12.0% · 12mo
- Down + closing
- —
- Monthly P&I
- —
- Monthly cashflow
- —
- DSCR
- —
- Eligible?
- —
Short-term bridge; refi at stabilization.
Listing history 5 events
-
2026-05-12status Pending 511-char remark
Show marketing remark (511 chars)
Nestled near the vibrant heart of Indianapolis, this duplex is minutes away from everything: entertainment, dining, and more. Come and see why this is perfect as an investment or a house hack. With some updates throughout, you already have a great start on this 2 level home featuring spacious rooms, additional storage, plenty of natural light, and some retained character. A covered porch houses two separate entrances and a large back yard gives access to the alley. Come and see why this is the one for you!
-
2026-04-22price $169,900 511-char remark
Show marketing remark (511 chars)
Nestled near the vibrant heart of Indianapolis, this duplex is minutes away from everything: entertainment, dining, and more. Come and see why this is perfect as an investment or a house hack. With some updates throughout, you already have a great start on this 2 level home featuring spacious rooms, additional storage, plenty of natural light, and some retained character. A covered porch houses two separate entrances and a large back yard gives access to the alley. Come and see why this is the one for you!
-
2026-03-26$179,900 Active 511-char remark
Show marketing remark (511 chars)
Nestled near the vibrant heart of Indianapolis, this duplex is minutes away from everything: entertainment, dining, and more. Come and see why this is perfect as an investment or a house hack. With some updates throughout, you already have a great start on this 2 level home featuring spacious rooms, additional storage, plenty of natural light, and some retained character. A covered porch houses two separate entrances and a large back yard gives access to the alley. Come and see why this is the one for you!
-
2012-08-24historical
-
2011-08-23$49,900
ⓘ Source: listings_history table (triggers on properties + properties_extension) + one-shot
backfill from property_details.listing_events for pre-trigger history.
Nearby sold comps map
Loading sold comps map…
Walkable amenities ~0.75 mi
Loading nearby amenities…
Taxation est. · year 1
- Rental income
- $31,236
- − Mortgage interest
- −$9,517
- − Property taxes
- −$2,548
- − Insurance
- −$850
- − Repairs & maintenance
- −$2,499
- − Management
- −$2,499
- − Depreciation
- −$4,943
- Taxable income
- $8,381
- Est. tax owed @ 24.0%
- −$2,011
- After-tax cash flow
- $8,575/yr
For passive investors: Depreciation is non-cash, so a rental often shows a tax loss while cash-flowing — sheltering income. Rental losses are passive: they offset passive income freely, and up to $25,000/yr can offset ordinary (W-2) income if you actively participate and your MAGI is under $100k (phasing out to $0 by $150k); unused losses carry forward. On sale, claimed depreciation is recaptured at up to 25%, and gains may owe capital-gains tax (a 1031 exchange can defer both). Figures are a year-1 estimate at your 24.0% rate — not tax advice; consult a CPA.
Condition & rehab AI · 12 photos
This 2-level home requires significant repairs and updates to its exterior and interior, but has potential for a substantial increase in value with proper renovations.
Repairs flagged
- Major exterior siding — Severe peeling and cracking
- Major interior walls — Significant damage and uneven surfaces
- Major flooring — Worn-out and in need of replacement
- Major windows — Missing panes and overall poor condition
Value-add opportunities
- Both exterior paint job — Enhances curb appeal and property value
- Both interior paint job — Improves the look and feel of the home
- Both flooring replacement — Enhances the overall appearance and comfort
- Both window replacement — Improves energy efficiency and safety
Renovation cost estimate screening
| Repair item | Severity | Est. cost |
|---|---|---|
| exterior siding · Severe peeling and cracking | Major | $15,000–50,000 |
| interior walls · Significant damage and uneven surfaces | Major | $15,000–50,000 |
| flooring · Worn-out and in need of replacement | Major | $15,000–50,000 |
| windows · Missing panes and overall poor condition | Major | $15,000–50,000 |
| Total estimated repair cost · 4 items | $60,000–200,000 |
Value-add ROI direction
- Both exterior paint job — Enhances curb appeal and property value ↑
- Both interior paint job — Improves the look and feel of the home ↑
- Both flooring replacement — Enhances the overall appearance and comfort ↑
- Both window replacement — Improves energy efficiency and safety ↑
ⓘ Cost ranges are severity-bucket heuristics (US national rule-of-thumb). Get contractor quotes + a written scope before underwriting a rehab budget.
Schools (NCES district)
- District
- Indianapolis Public Schools
- NCES district ID
- 1804770
- Math proficiency
- 14% ▼ -7.00%
- Reading proficiency
- 20% ▼ -3.00%
- Median HH income
- $32,034
- Composite
- 13.69/100
- National rank
- #9499
- State rank
- #286 of 301 in IN
Livability — Indianapolis city (balance)
No livability data for this city. (Only ~50 U.S. cities are tracked.)
Census & demographics
- Census place
- Indianapolis city (balance), IN
- County
- Marion County · 998,460 people
- City population
- 881,119
- Metro
- Indianapolis-Carmel-Anderson, IN
- Population (ZIP)
- 30,335
- Household income
- $49,195
- Rent vs Own
- Severe rent burden
- 1906.0
Population outlook (Marion County) Hauer SSP2
- Today (2025)
- 1,025,572 people
- By 2030
- 1,065,727 · +3.9%
- By 2040
- 1,141,577 · +11.3%
- By 2050
- 1,208,920 · +17.9%
- By 2075
- 1,367,288 · +33.3%
- By 2100
- 1,438,201 · +40.2%
Race, ethnicity, and origin ACS 2023
- Neighborhood character
- Diverse neighborhood (Simpson 0.63)
- Race & ethnicity
- White 53% Hispanic / Latino 23% Black 18% Two or more races 9%
- Hispanic origin (detail)
- Mexican 14% Puerto Rican 2%
- Common ancestry
- Slovak 2% Lithuanian 2% Italian 1%
- Foreign-born
- 9% · Canada
- Languages at home
- 81% English-only · Spanish 17%
Political lean MEDSL · Marion
- 2024 margin
- Strong D (+27.7) · D 63.0% · R 35.3% · Other 1.7%
- 2008→2024 swing
- -0.7pp no change · 2008: 28.4pp · 2024: 27.7pp
- All cycles
- 2024: D+27.7 2020: D+29.1 2016: D+22.8 2012: D+22.2 2008: D+28.4
Not yet ingested
- Civics
- —
Market trends
- HPI YoY
- ▼ -192.51%
- Current HPI
- 375.0969
- Rent YoY
- ▲ 7.31%
- Metro
- Indianapolis-Carmel-Anderson, IN
- State GDP YoY
- ▲ 2.90%
- F500 in state
- 18
Industry mix (Fortune 500 HQ in IN)
| Industry | F500 HQs | Revenue |
|---|---|---|
| Industrial Machinery | 2 | $37B |
|
||
| Healthcare | 1 | $177B |
|
||
| Pharmaceuticals | 1 | $45B |
|
||
| Metals / Steel | 1 | $18B |
|
||
| Agriculture | 1 | $17B |
|
||
| Packaging | 1 | $12B |
|
||
Price history
+240.5% since first listed5 events — show timeline
- 2026-05-12 Pending — MIBOR as Distributed by MLS Grid
- 2026-04-22 Price Changed $169,900 MIBOR as Distributed by MLS Grid
- 2026-03-26 Listed $179,900 MIBOR as Distributed by MLS Grid
- 2012-08-24 Listing Removed — MIBOR as Distributed by MLS Grid
- 2011-08-23 Listed $49,900 MIBOR as Distributed by MLS Grid
Cash-flow waterfall
monthlySold comps — $/sqft
last 12 mo · ≤1 miLoading sold comps…