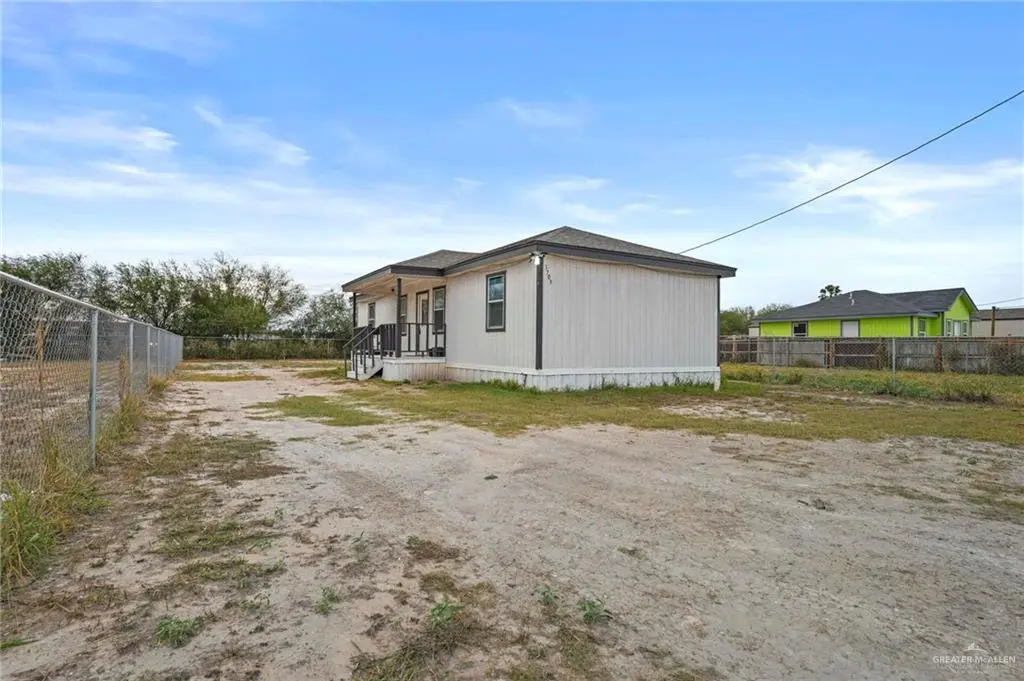
1703 Bahia Magdalena Dr · César Chávez, TX
Flood risk 4/10 · Minor
- FEMA flood zone
- —
- Chance of flooding over 30 yrs
- 0.22%
- Est. flood insurance / yr
- —
Fire risk 9/10 · Severe
- Est. fire insurance / yr
- $1,222 – $2,270
Heat risk 9/10 · Severe
- Hot days now (above 111°F)
- 7 days/yr
- Hot days in 30 yrs
- 23 days/yr
Wind risk 9/10 · Severe
- Chance of severe wind over 30 yrs
- 99.0%
Air-quality risk 1/10 · Minimal
- Unhealthy air days now
- 0 days/yr
- Unhealthy air days in 30 yrs
- 0 days/yr
Risk factors via First Street. Map © Google.
Why this score? — see what drove the C grade
The composite is a weighted blend of 9 inputs, each scored 0–100. Each bar is that input's sub-score; the figure is the points it added to the 100-point composite (weight × sub-score).
- Cash flow +21.4/30.0
- ARV discount +15.0/15.0
- DSCR +6.8/10.0
- 1% rule +5.7/10.0
- Condition / age +3.8/5.0
- Livability +2.5/5.0
- Rent growth +2.2/5.0
- Schools +2.2/10.0
- Appreciation +0.0/10.0
$120,000
🖨 Deal sheet (PDF) 📄 Offer letter ✓ Due diligence
Listing remarks MLS
home featuring an open-concept design with bright living and dining areas that offer both comfort and efficiency. The kitchen flows seamlessly into the main living space, ideal for daily living or hosting. The primary suite includes a private bath, while additional bedrooms provide flexibility for growing families, multigenerational living, or rental use. With modern finishes, low-maintenance outdoor space, and a functional floor plan, this property presents a strong opportunity for investor families looking to hold, rent, or resell while also appealing to owner-occupants seeking a practical, move-in ready home. Conveniently located near schools, shopping, and major roadways. Easy to show.
Key facts
- Open-concept design
- Private bath
- 6,530 sq ft lot
Tags
Neighborhood map
What this means for you Summary
Snapshot
- This is a 3-bed/1.0-bath single-family listed at $120k. Condition is rated good.
Deal economics
- At list price, monthly cash flow is $177 ($2k/yr) — positive.
- The deal already cash-flows at list — no discount required.
- Meets the 1% rule at list price ($1k rent vs $120k).
- Recommended offer: $106k (12.0% below list) — sets the bar for market timing.
Location & tenants
- Location reads: area grade C — affects rentability + tenant quality, not the cash-flow math above.
- Edinburg CISD (urban): math 20% / reading 34% proficiency, ranked #699 of 826 in TX (top 85%) — low school quality limits family demand, transient renter base, plan for 1-2y turnover; 62% free/reduced lunch — lower-income household profile, screen leases tightly.
- Market conditions: Rents soft (-1.1%/yr); 1003 active listings in the ZIP; 7,378 units permitted in Hidalgo County in 2024 (641 in 5+ unit buildings).
Forward outlook
- Local home prices are declining (-3.0%/yr); year-one equity from $830 of loan paydown is wiped out by about $4k of value loss. Plan a longer hold.
- Hidalgo County population projected at +28% by 2050 — long-run rental-demand tailwind backs the buy-and-hold thesis.
Negotiation context
- It's been on market 129 days — a 12% lower offer ($106k) is reasonable based on typical stale-listing flexibility.
Risks & watch-outs
- Climate carrying-cost: severe wind risk, 99% chance of damaging wind over 30y; severe wildfire risk; extreme-heat days projected 7→23/yr by 2055 (HVAC capex compounding) — expect insurance premiums to compound above CPI over the hold.
Questions for the listing agent
- It's been on market 129 days. Have you received any prior offers? Is the seller open to a 12% concession, seller financing, or rate buy-down credit?
- Why hasn't it sold? Are there any deal-killer items the seller is aware of (foundation, flood, title, zoning, code violations)?
- Is there a deadline driving the sale (1031 exchange, divorce, estate, relocation)? That informs how much negotiation room exists.
- What's the average days-on-market for RENTAL listings here right now (not sales)? A rising rental-DOM trend means longer vacancies and softer asking-rent achievability than the comps imply.
- What's the recent tenant-quality profile in this submarket — average credit score on applications, eviction rate, late-payment / NSF rate, and stable-employment percentage? A property-management company in the area should have these aggregated.
- How much new for-sale + rental construction is in the pipeline within 1–3 miles? Heavy new supply typically softens prices + rents 12–24 months out; constrained supply supports both.
Investment metrics
- 1% rule
- 1.07% ✓
- Cap rate
- 8.06%
- Cash-on-cash
- 6.32%
- DSCR
- 1.28
- GRM
- 7.8
CMA / ARV
- ARV (median comp)
- $149,112
- List price
- $120,000
- Delta
- -19.52%
- Verdict
- UNDERPRICED
- Comps
- 14 within 1.0 mi
Show comp detail 2 sales within ~0.75 mi
| Address | Dist | Beds/Ba | Sqft | Sold | Price | $/sf | Match |
|---|---|---|---|---|---|---|---|
| 1606 Baja Dr | 0.16mi | 3/2.0 | 916 (-9%) | 2mo | $169,000 | $184 | 72 |
| 714 Zenon Moya St | 0.74mi | 3/1.0 | 1,025 (+2%) | 14mo | $165,000 | $161 | 51 |
Match score weights: distance 35% · size 25% · config 20% · recency 20%. Top-matched comps best support the ARV.
Projected returns pro-forma
-3.0% appreciation · 0.0% rent growth · sell at horizon
- IRR
- -10.0%
- Equity multiple
- 0.65×
- Total profit
- $-11,917
- Equity at exit
- $17,892
- IRR
- -5.5%
- Equity multiple
- 0.69×
- Total profit
- $-10,346
- Equity at exit
- $10,375
Cash invested: $33,600 (down + closing). Projections, not guarantees.
Landlord ↔ Tenant lean methodology
- Overall (STATE)
- 87 Strongly Landlord-Friendly
- State Texas
- 87 Strongly Landlord-Friendly · R+5
- County
- — inherits STATE
- City
- — inherits STATE
ZIP-level market 78542
- Home prices YoY
- -13.4%
- Rents YoY
- -1.1%
- Active inventory
- 1003
- Price-to-rent
- 7.8×
Monthly cashflow live
- Estimated rent
- $1,289 medium interval (Pro) →
- Mortgage (P&I)
- −$629
- Tax from tax record
- −$162 /mo · $1,945/yr
- Insurance
- −$50
- HOA
- −$0
- Vacancy / Maint / Mgmt
- −$271
- Net cashflow
- $177
Break-even live
Sensitivity live
| Price | -10% $245 | -5% $211 | +0% $177 | +5% $143 | +10% $109 |
|---|---|---|---|---|---|
| Rent | -10% $75 | -5% $126 | +0% $177 | +5% $228 | +10% $279 |
| Rate | -1.0pp $238 | -0.5pp $208 | base $177 | +0.5pp $146 | +1.0pp $114 |
UW: 25.0% down · 7.5% · 30yr · 1.5% tax · 5.0% vac · 8.0% maint · 8.0% mgmt
Financing live
Cash to close
- Down payment
- $30,000
- Closing costs
- $3,600
- Reserves months
- —
- Total cash needed
- —
Loan-product check · same deal, 3 products live
Conventional
25% down · 7.5% · 30yr
- Down + closing
- —
- Monthly P&I
- —
- Monthly cashflow
- —
- DSCR
- —
- Eligible?
- —
Personal DTI + credit; lowest rate.
DSCR
20% down · 8.5% · 30yr
- Down + closing
- —
- Monthly P&I
- —
- Monthly cashflow
- —
- DSCR
- —
- Eligible?
- —
No personal income docs; deal must DSCR.
Hard money
10% down · 12.0% · 12mo
- Down + closing
- —
- Monthly P&I
- —
- Monthly cashflow
- —
- DSCR
- —
- Eligible?
- —
Short-term bridge; refi at stabilization.
Listing history 16 events
-
2026-06-18days on market $120,000 Active 129 DOM
-
2026-06-17days on market $120,000 Active 128 DOM
-
2026-06-16days on market $120,000 Active 127 DOM
-
2026-06-15days on market $120,000 Active 126 DOM
-
2026-06-14days on market $120,000 Active 124 DOM
-
2026-06-13days on market $120,000 Active 123 DOM
-
2026-06-10days on market $120,000 Active 121 DOM
-
2026-06-09days on market $120,000 Active 120 DOM
-
2026-06-08days on market $120,000 Active 119 DOM
-
2026-06-07pricedays on market $120,000 Active 118 DOM
-
2026-06-03days on market $129,999 Active 114 DOM
-
2026-06-02pricedays on market $129,999 Active 113 DOM
-
2026-06-01days on market $130,000 Active 112 DOM
-
2026-05-31days on market $130,000 Active 111 DOM
-
2026-05-31days on market $130,000 Active 110 DOM
-
2026-02-06$130,000 Active 698-char remark
Show marketing remark (698 chars)
home featuring an open-concept design with bright living and dining areas that offer both comfort and efficiency. The kitchen flows seamlessly into the main living space, ideal for daily living or hosting. The primary suite includes a private bath, while additional bedrooms provide flexibility for growing families, multigenerational living, or rental use. With modern finishes, low-maintenance outdoor space, and a functional floor plan, this property presents a strong opportunity for investor families looking to hold, rent, or resell while also appealing to owner-occupants seeking a practical, move-in ready home. Conveniently located near schools, shopping, and major roadways. Easy to show.
ⓘ Source: listings_history table (triggers on properties + properties_extension) + one-shot
backfill from property_details.listing_events for pre-trigger history.
Tax reassessment forecast TX · Resets to sale price
- Current annual tax
- $1,945 · $162/mo
- Projected year-2 tax
- $2,196 · $183/mo
- Expected delta
- +$251/yr (+$21/mo · 12.9%)
ⓘ Screening estimate from a state-policy table — verify with the county assessor before closing.
Climate risk First Street
- Flood 4/10 Moderate 22% chance over 30 yrs
- Wildfire 9/10 Extreme
- Heat 9/10 Extreme 7 d/yr ≥111°F today · 23 d/yr by 30 yrs out
- Wind 9/10 Extreme 99% chance of damaging wind over 30 yrs
- Air quality 1/10 Low 0 unhealthy d/yr today · 0 by 30 yrs out
Nearby sold comps map
Loading sold comps map…
Walkable amenities ~0.75 mi
Loading nearby amenities…
Taxation est. · year 1
- Rental income
- $15,470
- − Mortgage interest
- −$6,722
- − Property taxes
- −$1,945
- − Insurance
- −$600
- − Repairs & maintenance
- −$1,238
- − Management
- −$1,238
- − Depreciation
- −$3,491
- Taxable income
- $237
- Est. tax owed @ 24.0%
- −$57
- After-tax cash flow
- $2,068/yr
For passive investors: Depreciation is non-cash, so a rental often shows a tax loss while cash-flowing — sheltering income. Rental losses are passive: they offset passive income freely, and up to $25,000/yr can offset ordinary (W-2) income if you actively participate and your MAGI is under $100k (phasing out to $0 by $150k); unused losses carry forward. On sale, claimed depreciation is recaptured at up to 25%, and gains may owe capital-gains tax (a 1031 exchange can defer both). Figures are a year-1 estimate at your 24.0% rate — not tax advice; consult a CPA.
Condition & rehab AI · 12 photos
This single-family home is in good condition with a modern kitchen and bathroom. It has a good roof and exterior siding, and the interior walls and flooring are in good condition. The property is located near schools, shopping, and major roadways, making it a strong opportunity for investors.
Value-add opportunities
- Both Paint exterior siding — Enhances curb appeal and property value.
- Both Landscaping improvements — Improves curb appeal and enhances property value.
- Both Add outdoor lighting — Enhances safety and curb appeal.
- Both Install a front door — Improves curb appeal and security.
- Both Add a front porch — Enhances curb appeal and provides a welcoming entrance.
Renovation cost estimate screening
Value-add ROI direction
- Both Paint exterior siding — Enhances curb appeal and property value. ↑
- Both Landscaping improvements — Improves curb appeal and enhances property value. ↑
- Both Add outdoor lighting — Enhances safety and curb appeal. ↑
- Both Install a front door — Improves curb appeal and security. ↑
- Both Add a front porch — Enhances curb appeal and provides a welcoming entrance. ↑
ⓘ Cost ranges are severity-bucket heuristics (US national rule-of-thumb). Get contractor quotes + a written scope before underwriting a rehab budget.
Schools (NCES district)
- District
- Edinburg CISD
- NCES district ID
- 4818180
- Math proficiency
- 20% ▼ -34.00%
- Reading proficiency
- 34% ▼ -11.00%
- Median HH income
- $36,985
- Composite
- 22.42/100
- National rank
- #8114
- State rank
- #699 of 826 in TX
Livability — César Chávez
No livability data for this city. (Only ~50 U.S. cities are tracked.)
Census & demographics
- County
- Hidalgo County · 623,128 people
- Metro
- McAllen-Edinburg-Mission, TX
- Population (ZIP)
- 89,401
- Household income
- $55,243
- Rent vs Own
- Severe rent burden
- 1240.0
Population outlook (Hidalgo County) Hauer SSP2
- Today (2025)
- 955,232 people
- By 2030
- 1,009,774 · +5.7%
- By 2040
- 1,120,332 · +17.3%
- By 2050
- 1,225,036 · +28.2%
- By 2075
- 1,439,189 · +50.7%
- By 2100
- 1,533,429 · +60.5%
Race, ethnicity, and origin ACS 2023
- Neighborhood character
- Predominantly Hispanic (95%)
- Race & ethnicity
- Hispanic / Latino 95% Two or more races 59% White 4%
- Hispanic origin (detail)
- Mexican 91%
- Foreign-born
- 25% · Canada
- Languages at home
- 15% English-only · Spanish 84%
Political lean MEDSL · Hidalgo
- 2024 margin
- Toss-up / Even · D 48.1% · R 51.0%
- 2008→2024 swing
- -41.6pp toward R · 2008: 38.7pp · 2024: -2.9pp
- All cycles
- 2024: R+2.9 2020: D+17.1 2016: D+40.5 2012: D+41.8 2008: D+38.7
Not yet ingested
- Civics
- —
Market trends
- HPI YoY
- ▼ -34.17%
- Current HPI
- 220.921
- Rent YoY
- ▼ -1.07%
- Metro
- McAllen-Edinburg-Mission, TX
- State GDP YoY
- ▲ 3.95%
- F500 in state
- 110
Industry mix (Fortune 500 HQ in TX)
| Industry | F500 HQs | Revenue |
|---|---|---|
| Energy | 16 | $1,198B |
|
||
| Technology | 5 | $198B |
|
||
| Engineering / Construction | 4 | $72B |
|
||
| Energy Services | 3 | $60B |
|
||
| Utilities | 3 | $41B |
|
||
| Healthcare | 2 | $330B |
|
||
Price history
1 event — show timeline
- 2026-02-06 Listed $130,000 MCALLENMLS
Property tax history
+53.3%/yrLatest (2025): $1,945 · +19.2% YoY. Source: county tax records.
Cash-flow waterfall
monthlySold comps — $/sqft
last 12 mo · ≤1 miLoading sold comps…