8535 Wiggins St · Houston, TX
Flood risk 7/10 · Major
- FEMA flood zone
- X (unshaded)
- Chance of flooding over 30 yrs
- 0.99%
- Est. flood insurance / yr
- $507 – $1,088
Fire risk 3/10 · Minor
- Est. fire insurance / yr
- $1,222 – $2,270
Heat risk 9/10 · Severe
- Hot days now (above 110°F)
- 7 days/yr
- Hot days in 30 yrs
- 24 days/yr
Wind risk 9/10 · Severe
- Chance of severe wind over 30 yrs
- 99.0%
Air-quality risk 3/10 · Minor
- Unhealthy air days now
- 2 days/yr
- Unhealthy air days in 30 yrs
- 3 days/yr
Risk factors via First Street. Map © Google.
Why this score? — see what drove the B+ grade
The composite is a weighted blend of 9 inputs, each scored 0–100. Each bar is that input's sub-score; the figure is the points it added to the 100-point composite (weight × sub-score).
- Cash flow +26.3/30.0
- ARV discount +15.0/15.0
- Appreciation +10.0/10.0
- DSCR +8.9/10.0
- 1% rule +7.9/10.0
- Livability +3.7/5.0
- Schools +2.7/10.0
- Rent growth +2.5/5.0
- Condition / age +2.5/5.0
$135,000
🖨 Deal sheet (PDF) 📄 Offer letter ✓ Due diligence
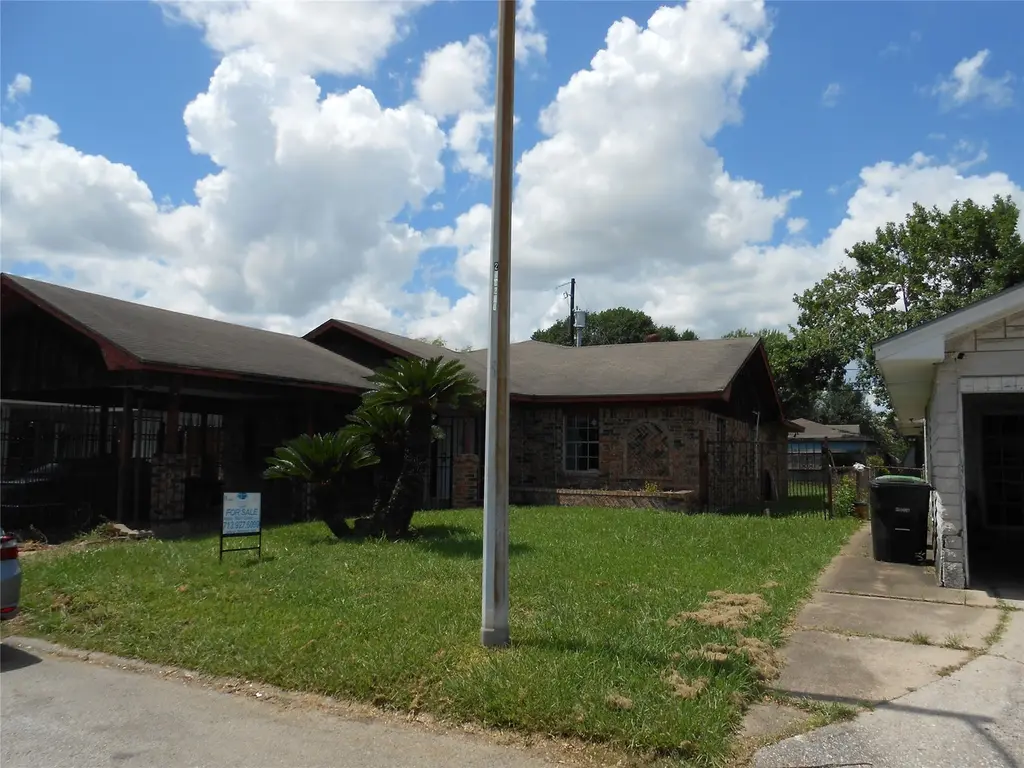
Listing remarks
As Is 3 bedroom, 2 bathroom with garage converted into den area. The property needs work to turn into your Dream Home!
Key facts
- 5,667 sq ft lot
- Parking
- Built 1940
Property features AI
Exterior
- Parking: Attached carport; 1-car carport
- Utilities: Public water; Public sewer
- Home design: Residential property; One-story entry (first floor layout)
- Construction: Brick construction; Built in 1940; Composition roof; Slab foundation
- Exterior features: Subdivision lot
Interior
- Kitchen: Kitchen; Breakfast nook adjacent to kitchen
- Bedrooms: Primary bedroom (first floor); Bedroom (first floor); Bedroom (first floor)
- Bathrooms: 2 full bathrooms
- Heating & cooling: Central heating (electric); Central air conditioning (electric)
- Interior features: Den; Living room; Dining room; Breakfast nook
Neighborhood map
What this means for you Summary
Snapshot
- This is a 3-bed/1.0-bath single-family listed at $135k.
Deal economics
- At list price, monthly cash flow is $281 ($3k/yr) — positive.
- The deal already cash-flows at list — no discount required.
- Meets the 1% rule at list price ($2k rent vs $135k).
- Recommended offer: $133k (1.5% below list) — sets the bar for market timing.
Location & tenants
- Location reads 74/100 on livability (#184 in TX, #4,771 nationally) — a middle-class / working-renter tenant base. Strengths: amenities A+, cost of living A+, housing A+; Watch: crime F.
- Houston ISD (urban): math 27% / reading 35% proficiency, ranked #593 of 826 in TX (top 72%) — families likely to look elsewhere, expect single-tenant / working-renter base with shorter leases; 71% free/reduced lunch — lower-income household profile, screen leases tightly.
- Zoned schools: Pleasantville El (math 8% / reading 22%, grade F, #4,021 of 4,322 statewide, top 94%, 233 students, 97% FRL); Holland Middle (math 10% / reading 16%, grade F, #1,609 of 1,662 statewide, top 97%, 644 students, 98% FRL) — zoned schools average 97% FRL vs 71% district-wide (26 pts higher); higher-poverty schools than district average — tighter screening recommended.
- Zoned-school proficiency averages 14% at this address vs 31% district-wide (-17 pts) — the specific schools serving this property underperform the Houston ISD average; the district grade overstates school quality for this exact location.
- Market conditions: 154 active listings in the ZIP; 6 comparable units currently listed for rent nearby; rentals lingering (median 45d on market — plan ~5-8 weeks vacancy on turnover, expect pricing pressure); 50% of comp listings sitting > 30 days — soft ceiling on asking rent; 29,883 units permitted in Harris County in 2024 (8,621 in 5+ unit buildings).
Forward outlook
- In year one you build about $14k of equity ($933 loan paydown + $14k appreciation (10.0% local appreciation)).
- Harris County population projected at +47% by 2050 — long-run rental-demand tailwind backs the buy-and-hold thesis.
- At projected returns (10.0% appreciation + 3.0% rent growth), your $38k cash investment doubles in ~3 years — after that, you're playing with house money.
- By year 3, paydown + projected appreciation supports a ~$37k cash-out refi (75% LTV) — recoverable capital for the next deal without selling this one.
Negotiation context
- It's been on market 18 days — a 2% lower offer ($133k) is reasonable based on typical stale-listing flexibility.
- 3 sale attempts since 2y ago with the ask held roughly flat each time — persistent listings suggest the price (not the market) is what's stuck; bring a comps-based counter.
Risks & watch-outs
- Watch-outs: flood insurance adds $66/mo; built in 1940 — expect roof / HVAC / electrical / plumbing capex.
- Climate carrying-cost: major flood risk; severe wind risk, 99% chance of damaging wind over 30y; extreme-heat days projected 7→24/yr by 2055 (HVAC capex compounding) — expect insurance premiums to compound above CPI over the hold.
Questions for the listing agent
- Built in 1940 — when were the roof, HVAC, electrical panel, plumbing, and water heater last replaced?
- What's the actual annual flood-insurance premium (NFIP or private), and is the property in a SFHA with mandatory coverage?
- Is there a deadline driving the sale (1031 exchange, divorce, estate, relocation)? That informs how much negotiation room exists.
- Schools are D-rated, which usually means shorter tenancies and higher turnover. Who's the typical renter profile here, and what's been the actual vacancy rate?
- Crime grade is F in this area — have there been break-ins, vandalism, or insurance claims at this property in the last 3 years? What carrier currently insures it and at what premium?
- What's the average days-on-market for RENTAL listings here right now (not sales)? A rising rental-DOM trend means longer vacancies and softer asking-rent achievability than the comps imply.
- What's the recent tenant-quality profile in this submarket — average credit score on applications, eviction rate, late-payment / NSF rate, and stable-employment percentage? A property-management company in the area should have these aggregated.
- How much new for-sale + rental construction is in the pipeline within 1–3 miles? Heavy new supply typically softens prices + rents 12–24 months out; constrained supply supports both.
Investment metrics
- 1% rule
- 1.29% ✓
- Cap rate
- 9.38%
- Cash-on-cash
- 11.03%
- DSCR
- 1.49
- GRM
- 6.5
CMA / ARV
- ARV (on-the-fly)
- $208,000
- Comps found
- 12
Show comp detail 12 sales within ~0.75 mi
| Address | Dist | Beds/Ba | Sqft | Sold | Price | $/sf | Match |
|---|---|---|---|---|---|---|---|
| 8530 Guinevere St | 0.34mi | 3/2.0 | 1,597 (-0%) | 4mo | $229,900 | $144 | 77 |
| 8702 Josie St | 0.27mi | 4/2.0 (+1) | 1,602 (+0%) | 2mo | $208,000 | $130 | 76 |
| 8754 Guinevere St | 0.48mi | 3/2.0 | 1,620 (+1%) | 4mo | $234,900 | $145 | 69 |
| 8743 Pattibob St | 0.33mi | 3/2.0 | 1,576 (-2%) | 12mo | $208,000 | $132 | 68 |
| 8727 Othello St | 0.36mi | 4/2.0 (+1) | 1,627 (+2%) | 11mo | $164,999 | $101 | 62 |
| 1442 Silverdale St | 0.11mi | 3/3.0 | 1,747 (+9%) | 12mo | $140,000 | $80 | 61 |
| 1426 Laurentide St | 0.42mi | 3/1.5 | 1,500 (-6%) | 13mo | $153,450 | $102 | 57 |
| 8726 Tilgham St | 0.28mi | 4/2.0 (+1) | 1,456 (-9%) | 11mo | $189,990 | $130 | 54 |
| 8527 Bucroft St | 0.49mi | 4/2.0 (+1) | 1,504 (-6%) | 7mo | $189,900 | $126 | 52 |
| 8766 Flossie Mae St | 0.44mi | 3/1.0 | 1,412 (-12%) | 12mo | $194,750 | $138 | 50 |
| 8522 Northton St | 0.62mi | 4/1.0 (+1) | 1,398 (-13%) | 3mo | $174,999 | $125 | 43 |
| 8522 Richcroft St | 0.57mi | 4/2.0 (+1) | 1,839 (+15%) | 10mo | $150,000 | $82 | 31 |
Match score weights: distance 35% · size 25% · config 20% · recency 20%. Top-matched comps best support the ARV.
Projected returns pro-forma
10.0% appreciation · 3.0% rent growth · sell at horizon
- IRR
- 30.8%
- Equity multiple
- 3.42×
- Total profit
- $91,541
- Equity at exit
- $121,619
- IRR
- 26.7%
- Equity multiple
- 7.77×
- Total profit
- $255,746
- Equity at exit
- $262,275
Cash invested: $37,800 (down + closing). Projections, not guarantees.
Landlord ↔ Tenant lean methodology
- Overall (STATE)
- 87 Strongly Landlord-Friendly
- State Texas
- 87 Strongly Landlord-Friendly · R+5
- County
- — inherits STATE
- City
- — inherits STATE
ZIP-level market 77029
- Home prices YoY
- 7.2%
- Active inventory
- 154
- Price-to-rent
- 6.5×
Monthly cashflow live
- Estimated rent
- $1,735 high interval (Pro) →
- Mortgage (P&I)
- −$708
- Tax from tax record
- −$259 /mo · $3,111/yr
- Insurance
- −$56
- Flood insurance flood zone
- −$66 /mo · $798/yr
- HOA
- −$0
- Vacancy / Maint / Mgmt
- −$364
- Net cashflow
- $281
Break-even live
Sensitivity live
| Price | -10% $357 | -5% $319 | +0% $281 | +5% $243 | +10% $205 |
|---|---|---|---|---|---|
| Rent | -10% $144 | -5% $212 | +0% $281 | +5% $349 | +10% $418 |
| Rate | -1.0pp $349 | -0.5pp $315 | base $281 | +0.5pp $246 | +1.0pp $210 |
UW: 25.0% down · 7.5% · 30yr · 1.5% tax · 5.0% vac · 8.0% maint · 8.0% mgmt
Financing live
Cash to close
- Down payment
- $33,750
- Closing costs
- $4,050
- Reserves months
- —
- Total cash needed
- —
Loan-product check · same deal, 3 products live
Conventional
25% down · 7.5% · 30yr
- Down + closing
- —
- Monthly P&I
- —
- Monthly cashflow
- —
- DSCR
- —
- Eligible?
- —
Personal DTI + credit; lowest rate.
DSCR
20% down · 8.5% · 30yr
- Down + closing
- —
- Monthly P&I
- —
- Monthly cashflow
- —
- DSCR
- —
- Eligible?
- —
No personal income docs; deal must DSCR.
Hard money
10% down · 12.0% · 12mo
- Down + closing
- —
- Monthly P&I
- —
- Monthly cashflow
- —
- DSCR
- —
- Eligible?
- —
Short-term bridge; refi at stabilization.
Rent comps 6 comps
| Address | Beds | Baths | Sqft | Rent | $/sqft | DOM | Units | Dist |
|---|---|---|---|---|---|---|---|---|
| 8735 Cowart St Houston, TX | 3.0 | 1.0 | 1136 | $1,000 | $0.88 | 44d | 1 | 0.28mi |
| 1629 Demaree Ln Houston, TX | 4.0 | 2.0 | 1520 | $2,225 | $1.46 | 25d | 1 | 0.36mi |
| 2203 Pearl St Houston, TX | 3.0 | 2.0 | 1298 | $1,570 | $1.21 | 15d | 1 | 0.92mi |
| 9709 Cargill St Houston, TX | 3.0 | 2.0 | 1184 | $2,300 | $1.94 | 44d | 1 | 1.06mi |
| 9710 Tuffly St Houston, TX | 3.0 | 2.0 | 1275 | $1,795 | $1.41 | 25d | 1 | 1.18mi |
| 9821 Turnbow St Unit C Houston, TX | 3.0 | 2.0 | 1140 | $1,720 | $1.51 | 44d | 1 | 1.47mi |
Listing history 12 events
-
2026-06-21days on market $135,000 Active 18 DOM
-
2026-06-18status $135,000 Active 15 DOM
-
2026-06-18days on market $135,000 Pending 15 DOM
-
2026-06-17days on market $135,000 Pending 14 DOM
-
2026-06-16days on market $135,000 Pending 13 DOM
-
2026-06-15days on market $135,000 Pending 12 DOM
-
2026-06-13statusdays on market $135,000 Pending 10 DOM
-
2026-06-09days on market $135,000 Active 6 DOM
-
2026-06-08days on market $135,000 Active 5 DOM
-
2026-06-07days on market $135,000 Active 4 DOM
-
2026-06-04remarks 118-char remark
-
2026-06-04$135,000 Active 1 DOM
ⓘ Source: listings_history table (triggers on properties + properties_extension) + one-shot
backfill from property_details.listing_events for pre-trigger history.
Tax reassessment forecast TX · Resets to sale price
- Current annual tax
- $3,111 · $259/mo
- Projected year-2 tax
- $3,111 · $259/mo
- Expected delta
- $0/yr ($0/mo · 0.0%)
ⓘ Screening estimate from a state-policy table — verify with the county assessor before closing.
Climate risk First Street
- Flood 7/10 Severe FEMA zone X (unshaded) · 99% chance over 30 yrs
- Wildfire 3/10 Moderate
- Heat 9/10 Extreme 7 d/yr ≥110°F today · 24 d/yr by 30 yrs out
- Wind 9/10 Extreme 99% chance of damaging wind over 30 yrs
- Air quality 3/10 Moderate 2 unhealthy d/yr today · 3 by 30 yrs out
Nearby sold comps map
Loading sold comps map…
Walkable amenities ~0.75 mi
Loading nearby amenities…
Taxation est. · year 1
- Rental income
- $20,823
- − Mortgage interest
- −$7,562
- − Property taxes
- −$3,111
- − Insurance
- −$1,472
- − Repairs & maintenance
- −$1,666
- − Management
- −$1,666
- − Depreciation
- −$3,927
- Taxable income
- $1,419
- Est. tax owed @ 24.0%
- −$340
- After-tax cash flow
- $3,031/yr
For passive investors: Depreciation is non-cash, so a rental often shows a tax loss while cash-flowing — sheltering income. Rental losses are passive: they offset passive income freely, and up to $25,000/yr can offset ordinary (W-2) income if you actively participate and your MAGI is under $100k (phasing out to $0 by $150k); unused losses carry forward. On sale, claimed depreciation is recaptured at up to 25%, and gains may owe capital-gains tax (a 1031 exchange can defer both). Figures are a year-1 estimate at your 24.0% rate — not tax advice; consult a CPA.
Schools (NCES district)
- District
- Houston ISD
- NCES district ID
- 4823640
- Math proficiency
- 27% ▼ -18.00%
- Reading proficiency
- 35% ▼ -6.00%
- Median HH income
- $46,054
- Composite
- 26.63/100
- National rank
- #7173
- State rank
- #593 of 826 in TX
Livability — Houston
- Score
- 74/100
- State rank
- #184
- US rank
- #4771
Category grades
Schools grade is shown separately in the Schools card above.
Census & demographics
- Census place
- Houston, TX
- County
- Harris County · 4,702,590 people
- City population
- 3,226,434
- Metro
- Houston-The Woodlands-Sugar Land, TX
- Population (ZIP)
- 16,154
- Household income
- $48,279
- Rent vs Own
- Severe rent burden
- 457.0
Population outlook (Harris County) Hauer SSP2
- Today (2025)
- 5,571,493 people
- By 2030
- 6,089,821 · +9.3%
- By 2040
- 7,142,806 · +28.2%
- By 2050
- 8,185,864 · +46.9%
- By 2075
- 10,574,329 · +89.8%
- By 2100
- 12,109,958 · +117.4%
Race, ethnicity, and origin ACS 2023
- Neighborhood character
- Predominantly Hispanic (72%)
- Race & ethnicity
- Hispanic / Latino 72% Two or more races 32% Black 22% White 5%
- Hispanic origin (detail)
- Mexican 66%
- Foreign-born
- 31% · Canada
- Languages at home
- 39% English-only · Spanish 61%
Political lean MEDSL · Harris
- 2024 margin
- Lean D (+5.5) · D 52.0% · R 46.4% · Other 1.6%
- 2008→2024 swing
- +3.9pp toward D · 2008: 1.6pp · 2024: 5.5pp
- All cycles
- 2024: D+5.5 2020: D+13.3 2016: D+12.4 2012: D+0.1 2008: D+1.6
Not yet ingested
- Civics
- —
Market trends
- HPI YoY
- ▲ 18.53%
- Current HPI
- 276.1811
- Rent YoY
- —
- Metro
- Houston-The Woodlands-Sugar Land, TX
- State GDP YoY
- ▲ 3.95%
- F500 in state
- 110
Industry mix (Fortune 500 HQ in TX)
| Industry | F500 HQs | Revenue |
|---|---|---|
| Energy | 16 | $1,198B |
|
||
| Technology | 5 | $198B |
|
||
| Engineering / Construction | 4 | $72B |
|
||
| Energy Services | 3 | $60B |
|
||
| Utilities | 3 | $41B |
|
||
| Healthcare | 2 | $330B |
|
||
Price history
-15.6% since first listed8 events — show timeline
- 2026-06-03 Listed $135,000 HARMLS
- 2025-06-24 Pending — HARMLS
- 2024-08-09 Pending — HARMLS
- 2024-08-09 Relisted — HARMLS
- 2024-08-07 Listing Removed — HARMLS
- 2024-07-22 Pending — HARMLS
- 2024-07-15 Listed $160,000 HARMLS
- 1988-01-02 Sold (Public Records) — Public Records
Property tax history
+1.3%/yrLatest (2025): $3,111 · +11.7% YoY. Source: county tax records.
Cash-flow waterfall
monthlySold comps — $/sqft
last 12 mo · ≤1 miLoading sold comps…