111 Pecan Flats Rd · Balch Springs, TX
Flood risk No data
- FEMA flood zone
- —
- Chance of flooding over 30 yrs
- —
- Est. flood insurance / yr
- —
Fire risk No data
- Est. fire insurance / yr
- —
Heat risk No data
- Hot days now (above threshold)
- —
- Hot days in 30 yrs
- —
Wind risk No data
- Chance of severe wind over 30 yrs
- —
Air-quality risk No data
- Unhealthy air days now
- —
- Unhealthy air days in 30 yrs
- —
Risk factors via First Street. Map © Google.
Why this score? — see what drove the C- grade
The composite is a weighted blend of 9 inputs, each scored 0–100. Each bar is that input's sub-score; the figure is the points it added to the 100-point composite (weight × sub-score).
- Cash flow +20.6/30.0
- ARV discount +7.5/15.0
- DSCR +6.5/10.0
- 1% rule +4.8/10.0
- Livability +3.4/5.0
- Schools +2.9/10.0
- Rent growth +2.5/5.0
- Condition / age +2.5/5.0
- Appreciation +0.0/10.0
$272,999
🖨 Deal sheet 📄 Offer letter ✓ Due diligence
Listing remarks
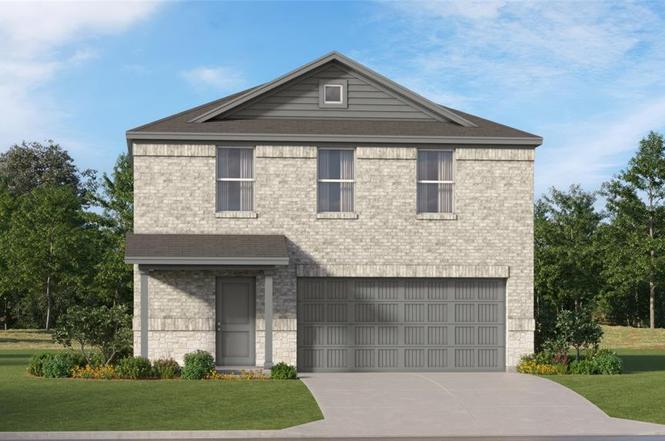
The first floor of this two-story home shares a spacious open layout between the kitchen, dining room and family room for easy entertaining. Upstairs are three secondary bedrooms, ideal for residents and overnight guests, surrounding a versatile loft that serves as an additional shared living space. An owner's suite sprawls across the rear of the second floor and enjoys an en-suite bathroom and a walk-in closet.
Key facts
- Walk-in closet
- Open layout
- En-suite bathroom
Tags
Neighborhood map
What this means for you Summary
Snapshot
- This is a 4-bed/2.0-bath land listed at $273k.
Deal economics
- At list price, monthly cash flow is $362 ($4k/yr) — positive.
- The deal already cash-flows at list — no discount required.
- To meet the 1% rule (rent ≥ 1% of price), the offer needs to be $268k (1.9% below list).
- Recommended offer: $268k (1.9% below list) — sets the bar for 1% rule.
- Cap rate 7.9% vs local median 4.7% in Balch Springs — top-decile yield for the area; either an underpriced asset or a hidden risk that comps aren't pricing in. Stress-test before assuming the spread holds.
Location & tenants
- Location reads 68/100 on livability (#487 in TX) — a middle-class / working-renter tenant base. Strengths: cost of living A+, housing A+, health & safety B+; Watch: employment D, crime F, amenities F.
- Mesquite ISD (suburban): math 35% / reading 32% proficiency, ranked #536 of 826 in TX (top 65%) — families likely to look elsewhere, expect single-tenant / working-renter base with shorter leases; 63% free/reduced lunch — lower-income household profile, screen leases tightly.
- Zoned schools: Gentry El (math 34% / reading 40%, grade F, #1,769 of 4,322 statewide, top 44%, 637 students, 79% FRL) — zoned schools average 79% FRL vs 63% district-wide (16 pts higher); higher-poverty schools than district average — tighter screening recommended.
- Market conditions: Rents flat; 590 active listings in the ZIP; 15 comparable units currently listed for rent nearby; rentals leasing fast (median 13d on market — plan ~1-2 weeks tenant-placement turnaround); high-income renter base; 12,577 units permitted in Dallas County in 2024 (6,829 in 5+ unit buildings).
Forward outlook
- Local home prices are declining (-3.0%/yr); year-one equity from $2k of loan paydown is wiped out by about $8k of value loss. Plan a longer hold.
- Dallas County population projected at +35% by 2050 — long-run rental-demand tailwind backs the buy-and-hold thesis.
Negotiation context
- Only 13 days on market — expect competitive offers; lowballing is unlikely to land.
Questions for the listing agent
- What does the HOA fee cover, when was the last increase, and are there any pending special assessments or reserve-fund shortfalls?
- Is there a deadline driving the sale (1031 exchange, divorce, estate, relocation)? That informs how much negotiation room exists.
- Schools are F-rated, which usually means shorter tenancies and higher turnover. Who's the typical renter profile here, and what's been the actual vacancy rate?
- Crime grade is F in this area — have there been break-ins, vandalism, or insurance claims at this property in the last 3 years? What carrier currently insures it and at what premium?
- What's the average days-on-market for RENTAL listings here right now (not sales)? A rising rental-DOM trend means longer vacancies and softer asking-rent achievability than the comps imply.
- What's the recent tenant-quality profile in this submarket — average credit score on applications, eviction rate, late-payment / NSF rate, and stable-employment percentage? A property-management company in the area should have these aggregated.
- How much new for-sale + rental construction is in the pipeline within 1–3 miles? Heavy new supply typically softens prices + rents 12–24 months out; constrained supply supports both.
Investment metrics
- 1% rule
- 0.98% ✗
- Cap rate
- 7.89%
- Cash-on-cash
- 5.69%
- DSCR
- 1.25
- GRM
- 8.5
CMA / ARV
No comps found within radius.
Projected returns pro-forma
-3.0% appreciation · 0.07% rent growth · sell at horizon
- IRR
- -10.7%
- Equity multiple
- 0.62×
- Total profit
- $-28,867
- Equity at exit
- $40,705
- IRR
- -5.8%
- Equity multiple
- 0.67×
- Total profit
- $-25,277
- Equity at exit
- $23,604
Cash invested: $76,440 (down + closing). Projections, not guarantees.
Landlord ↔ Tenant lean methodology
- Overall (STATE)
- 87 Strongly Landlord-Friendly
- State Texas
- 87 Strongly Landlord-Friendly · R+5
- County
- — inherits STATE
- City
- — inherits STATE
ZIP-level market 75181
- Home prices YoY
- -9.4%
- Rents YoY
- 0.1%
- Active inventory
- 590
- Price-to-rent
- 8.5×
Monthly cashflow live
- Estimated rent
- $2,679 high interval (Pro) →
- Mortgage (P&I)
- −$1,432
- Tax from tax record
- −$130 /mo · $1,559/yr
- Insurance
- −$114
- HOA
- −$79
- Vacancy / Maint / Mgmt
- −$563
- Net cashflow
- $362
Break-even live
UW: 25.0% down · 7.5% · 30yr · 1.5% tax · 5.0% vac · 8.0% maint · 8.0% mgmt
Financing live
Cash to close
- Down payment
- $68,250
- Closing costs
- $8,190
- Reserves months
- —
- Total cash needed
- —
Loan-product check · same deal, 3 products live
Conventional
25% down · 7.5% · 30yr
- Down + closing
- —
- Monthly P&I
- —
- Monthly cashflow
- —
- DSCR
- —
- Eligible?
- —
Personal DTI + credit; lowest rate.
DSCR
20% down · 8.5% · 30yr
- Down + closing
- —
- Monthly P&I
- —
- Monthly cashflow
- —
- DSCR
- —
- Eligible?
- —
No personal income docs; deal must DSCR.
Hard money
10% down · 12.0% · 12mo
- Down + closing
- —
- Monthly P&I
- —
- Monthly cashflow
- —
- DSCR
- —
- Eligible?
- —
Short-term bridge; refi at stabilization.
Rent comps 15 comps
| Address | Beds | Baths | Sqft | Rent | $/sqft | DOM | Units | Dist |
|---|---|---|---|---|---|---|---|---|
| 127 Woodhill St Mesquite, TX | 3.0 | 2.0 | 1545 | $1,950 | $1.26 | 11d | 1 | 0.70mi |
| 4642 Elm Point Dr Balch Springs, TX | 3.0 | 2.0 | 2100 | $2,199 | $1.05 | 5d | 1 | 0.73mi |
| 1332 Nimitz Way Mesquite, TX | 4.0 | 2.0 | 2109 | $2,280 | $1.08 | 20d | 1 | 0.92mi |
| 1308 Dawson Way Mesquite, TX | 4.0 | 2.5 | 2476 | $3,573 | $1.44 | 24d | 1 | 0.98mi |
| 1309 Dawson Way Mesquite, TX | 4.0 | 2.0 | 1952 | $2,222 | $1.14 | 7d | 1 | 1.01mi |
| 2749 Ingram Cir Mesquite, TX | 3.0 | 2.0 | 1791 | $2,119 | $1.18 | 3d | 1 | 1.03mi |
| 12416 Fish Rd Dallas, TX | 4.0 | 2.0 | 1427 | $2,011 | $1.41 | 5d | 1 | 1.10mi |
| 2829 Kerrville Dr Mesquite, TX | 4.0 | 2.5 | 2349 | $2,700 | $1.15 | 4d | 1 | 1.11mi |
| 2805 Cameron Way Mesquite, TX | 3.0 | 2.0 | 1660 | $2,150 | $1.30 | 12d | 1 | 1.20mi |
| 13131 Rocky Ledge Dr Balch Springs, TX | 3.0 | 2.0 | 1565 | $1,883 | $1.20 | 3d | 1 | 1.29mi |
| 2801 Sonora Ln Mesquite, TX | 4.0 | 2.0 | 1938 | $2,245 | $1.16 | 24d | 1 | 1.29mi |
| 2800 Crockett Pl Mesquite, TX | 3.0 | 2.0 | 1660 | $1,895 | $1.14 | 22d | 1 | 1.33mi |
| 716 Elm Falls Pl Mesquite, TX | 3.0 | 2.0 | 2444 | $2,300 | $0.94 | 20d | 1 | 1.42mi |
| 2724 Windswept Ln Mesquite, TX | 3.0 | 2.0 | 1402 | $2,300 | $1.64 | 24d | 1 | 1.45mi |
| 1908 Twisted Tree Ln Mesquite, TX | 5.0 | 2.5 | 2750 | $3,670 | $1.33 | 24d | 1 | 1.49mi |
HOA detail
- Monthly dues
- $79 · $948/yr
Listing history 7 events
-
2026-06-07statusdays on market $272,999 Pending 13 DOM
-
2026-06-04days on market $272,999 Active 11 DOM
-
2026-06-03days on market $272,999 Active 10 DOM
-
2026-06-02days on market $272,999 Active 9 DOM
-
2026-06-02status $272,999 Active 8 DOM
-
2026-02-15status Pending
-
2026-02-07$272,999 Active
ⓘ Source: listings_history table (triggers on properties + properties_extension) + one-shot
backfill from property_details.listing_events for pre-trigger history.
Tax reassessment forecast TX · Resets to sale price
- Current annual tax
- $1,559 · $130/mo
- Projected year-2 tax
- $4,996 · $416/mo
- Expected delta
- +$3,437/yr (+$286/mo · 220.5%)
ⓘ Screening estimate from a state-policy table — verify with the county assessor before closing.
Nearby sold comps map
Loading sold comps map…
Walkable amenities ~0.75 mi
Loading nearby amenities…
Taxation est. · year 1
- Rental income
- $32,153
- − Mortgage interest
- −$15,292
- − Property taxes
- −$1,559
- − Insurance
- −$1,365
- − Repairs & maintenance
- −$2,572
- − Management
- −$2,572
- − HOA
- −$948
- − Depreciation
- −$7,942
- Taxable loss
- −$97
- Est. tax savings @ 24.0%
- +$23
- After-tax cash flow
- $4,373/yr
For passive investors: Depreciation is non-cash, so a rental often shows a tax loss while cash-flowing — sheltering income. Rental losses are passive: they offset passive income freely, and up to $25,000/yr can offset ordinary (W-2) income if you actively participate and your MAGI is under $100k (phasing out to $0 by $150k); unused losses carry forward. On sale, claimed depreciation is recaptured at up to 25%, and gains may owe capital-gains tax (a 1031 exchange can defer both). Figures are a year-1 estimate at your 24.0% rate — not tax advice; consult a CPA.
Schools (NCES district)
- District
- Mesquite ISD
- NCES district ID
- 4830390
- Math proficiency
- 35% ▼ -11.00%
- Reading proficiency
- 32% ▼ -7.00%
- Median HH income
- $49,372
- Composite
- 29.06/100
- National rank
- #6606
- State rank
- #536 of 826 in TX
Livability — Balch Springs
- Score
- 68/100
- State rank
- #487
- US rank
- #9673
Category grades
Schools grade is shown separately in the Schools card above.
Census & demographics
- County
- Dallas County · 2,612,404 people
- City population
- 26,455
- Metro
- Dallas-Fort Worth-Arlington, TX
- Population (ZIP)
- 29,788
- Household income
- $111,052
- Rent vs Own
- Severe rent burden
- 857.0
Population outlook (Dallas County) Hauer SSP2
- Today (2025)
- 2,979,839 people
- By 2030
- 3,191,823 · +7.1%
- By 2040
- 3,619,611 · +21.5%
- By 2050
- 4,026,915 · +35.1%
- By 2075
- 4,957,073 · +66.4%
- By 2100
- 5,508,725 · +84.9%
Race, ethnicity, and origin ACS 2023
- Neighborhood character
- Highly diverse neighborhood (Simpson 0.71)
- Race & ethnicity
- Black 39% Hispanic / Latino 32% Two or more races 21% White 16% Asian 5% Native American 1%
- Hispanic origin (detail)
- Mexican 27% Puerto Rican 1%
- Common ancestry
- Slovak 2% Italian 1%
- Foreign-born
- 22% · Canada, Vietnam
- Languages at home
- 64% English-only · Spanish 27% Tagalog/Filipino 3% Other Asian/Pacific 1%
Political lean MEDSL · Dallas
- 2024 margin
- Strong D (+22.2) · D 60.2% · R 38.0% · Other 1.8%
- 2008→2024 swing
- +6.9pp toward D · 2008: 15.3pp · 2024: 22.2pp
- All cycles
- 2024: D+22.2 2020: D+31.6 2016: D+26.2 2012: D+15.4 2008: D+15.3
Not yet ingested
- Civics
- —
Market trends
- HPI YoY
- ▼ -26.63%
- Current HPI
- 257.0959
- Rent YoY
- ▲ 0.07%
- Metro
- Dallas-Fort Worth-Arlington, TX
- State GDP YoY
- ▲ 3.95%
- F500 in state
- 110
Industry mix (Fortune 500 HQ in TX)
| Industry | F500 HQs | Revenue |
|---|---|---|
| Energy | 16 | $1,198B |
|
||
| Technology | 5 | $198B |
|
||
| Engineering / Construction | 4 | $72B |
|
||
| Energy Services | 3 | $60B |
|
||
| Utilities | 3 | $41B |
|
||
| Healthcare | 2 | $330B |
|
||
Price history
2 events — show timeline
- 2026-02-15 Pending — NTREIS
- 2026-02-07 Listed $272,999 NTREIS
Property tax history
+60.7%/yrLatest (2025): $1,559 · +60.7% YoY. Source: county tax records.
Cash-flow waterfall
monthlySold comps — $/sqft
last 12 mo · ≤1 miLoading sold comps…