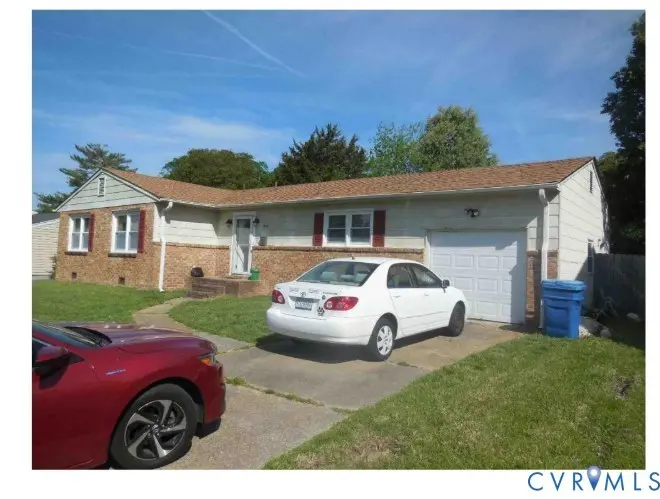
3808 William Penn Blvd · Virginia Beach, VA
Flood risk 3/10 · Minor
- FEMA flood zone
- X (unshaded)
- Chance of flooding over 30 yrs
- 0.09%
- Est. flood insurance / yr
- $507 – $1,088
Fire risk 1/10 · Minimal
- Est. fire insurance / yr
- $666 – $1,236
Heat risk 9/10 · Severe
- Hot days now (above 105°F)
- 7 days/yr
- Hot days in 30 yrs
- 17 days/yr
Wind risk 8/10 · Major
- Chance of severe wind over 30 yrs
- 99.0%
Air-quality risk 3/10 · Minor
- Unhealthy air days now
- 2 days/yr
- Unhealthy air days in 30 yrs
- 4 days/yr
Risk factors via First Street. Map © Google.
Why this score? — see what drove the C+ grade
The composite is a weighted blend of 9 inputs, each scored 0–100. Each bar is that input's sub-score; the figure is the points it added to the 100-point composite (weight × sub-score).
- Cash flow +19.9/30.0
- ARV discount +15.0/15.0
- Schools +6.4/10.0
- DSCR +6.3/10.0
- 1% rule +4.9/10.0
- Livability +4.2/5.0
- Rent growth +3.7/5.0
- Condition / age +2.5/5.0
- Appreciation +0.0/10.0
$233,700
🖨 Deal sheet 📄 Offer letter ✓ Due diligence
Key facts
- 7,553 sq ft lot
- Garage
- Built 1967
Property features AI
Exterior
- Parking: Attached garage; Driveway parking; Paved parking; Garage (1 car)
- Utilities: Public water; Public sewer
- Home design: Single-story property; Entry level is 1; Resale condition
- Construction: Brick, frame and vinyl siding exterior; Composition roof
- Exterior features: Paved driveway; Back yard with fencing; Fenced yard; Level lot
Interior
- Kitchen: Stove
- Bedrooms: Total of 6 rooms (bedroom count not specified)
- Flooring: Wood
- Bathrooms: 2 full bathrooms; Tub and shower in full bath on first level
- Heating & cooling: Electric heating; Electric cooling
- Interior features: Wood flooring; Crawl space basement
- Laundry & utility: Electric water heater
Neighborhood map
What this means for you Summary
Snapshot
- This is a 4-bed/2.0-bath single-family listed at $234k.
Deal economics
- At list price, monthly cash flow is $282 ($3k/yr) — positive.
- The deal already cash-flows at list — no discount required.
- To meet the 1% rule (rent ≥ 1% of price), the offer needs to be $232k (0.8% below list).
- Recommended offer: $232k (0.8% below list) — sets the bar for 1% rule.
- Cap rate 7.7% vs local median 3.5% in Virginia Beach — top-decile yield for the area; either an underpriced asset or a hidden risk that comps aren't pricing in. Stress-test before assuming the spread holds.
Location & tenants
- Location reads 83/100 on livability (#38 in VA, #880 nationally) — a professional / high-income tenant draw. Strengths: schools A+, amenities A+, employment A+; Watch: cost of living C-, commute F.
- Va Beach City Public School District (urban): math 69% / reading 78% proficiency, ranked #10 of 131 in VA (top 8%) — strong family-tenant draw, lease renewals of 3-5y typical.
- Market conditions: Rents rising fast (+4.9%/yr); 226 active listings in the ZIP; 30 comparable units currently listed for rent nearby; rentals at typical pace (median 22d on market — plan ~3-4 weeks tenant-placement turnaround); solid renter incomes; 666 units permitted in Virginia Beach city in 2024 (347 in 5+ unit buildings).
- This rent runs 35% of the median local income ($79k/yr) — at the standard rent-burdened threshold; future hikes will face affordability resistance.
Forward outlook
- Local home prices are declining (-3.0%/yr); year-one equity from $2k of loan paydown is wiped out by about $7k of value loss. Plan a longer hold.
- Virginia Beach County population projected at +6% by 2050 — modest demand growth; plan on rents tracking national, not racing it.
Negotiation context
- Only 1 days on market — expect competitive offers; lowballing is unlikely to land.
- Current owner paid $16k; list at $234k implies a 1316% gain — meaningful room to come down on a strong offer.
Risks & watch-outs
- Climate carrying-cost: severe wind risk, 99% chance of damaging wind over 30y; extreme-heat days projected 7→17/yr by 2055 (HVAC capex compounding) — expect insurance premiums to compound above CPI over the hold.
Questions for the listing agent
- Built in 1967 — when were the roof, HVAC, electrical panel, plumbing, and water heater last replaced?
- Is there a deadline driving the sale (1031 exchange, divorce, estate, relocation)? That informs how much negotiation room exists.
- Schools are A-rated — typically a magnet for longer-tenancy family renters. What's the average tenant stay here, and is there a school-zone premium baked into asking?
- What's the average days-on-market for RENTAL listings here right now (not sales)? A rising rental-DOM trend means longer vacancies and softer asking-rent achievability than the comps imply.
- What's the recent tenant-quality profile in this submarket — average credit score on applications, eviction rate, late-payment / NSF rate, and stable-employment percentage? A property-management company in the area should have these aggregated.
- How much new for-sale + rental construction is in the pipeline within 1–3 miles? Heavy new supply typically softens prices + rents 12–24 months out; constrained supply supports both.
Investment metrics
- 1% rule
- 0.99% ✗
- Cap rate
- 7.74%
- Cash-on-cash
- 5.18%
- DSCR
- 1.23
- GRM
- 8.4
CMA / ARV
- ARV (on-the-fly)
- $406,464
- Comps found
- 12
Show comp detail 12 sales within ~0.75 mi
| Address | Dist | Beds/Ba | Sqft | Sold | Price | $/sf | Match |
|---|---|---|---|---|---|---|---|
| 3841 Colonial Pkwy | 0.19mi | 4/2.0 | 1,392 (0%) | 2mo | $426,483 | $306 | 90 |
| 3905 W Colonial Pkwy | 0.28mi | 4/2.0 | 1,372 (-1%) | 2mo | $435,000 | $317 | 83 |
| 504 Old Forge Cir | 0.52mi | 4/2.0 | 1,392 (0%) | 0mo | $410,000 | $295 | 76 |
| 508 S Kings Point Rd | 0.49mi | 3/2.0 (-1) | 1,388 (-0%) | 1mo | $385,000 | $277 | 71 |
| 3812 William Penn Blvd | 0.02mi | 3/2.0 (-1) | 1,200 (-14%) | 1mo | $400,000 | $333 | 70 |
| 253 Waverly Dr | 0.63mi | 4/2.0 | 1,400 (+1%) | 1mo | $370,000 | $264 | 69 |
| 3753 Old Forge Rd | 0.53mi | 3/2.0 (-1) | 1,460 (+5%) | 1mo | $375,000 | $257 | 61 |
| 3961 W Colonial Pkwy | 0.42mi | 3/2.0 (-1) | 1,236 (-11%) | 1mo | $412,600 | $334 | 56 |
| 232 Waverly Dr | 0.66mi | 3/2.0 (-1) | 1,456 (+5%) | 2mo | $385,000 | $264 | 55 |
| 321 Caren Dr | 0.68mi | 3/2.0 (-1) | 1,529 (+10%) | 0mo | $308,600 | $202 | 47 |
| 3544 Club House Rd | 0.75mi | 3/2.0 (-1) | 1,512 (+9%) | 1mo | $385,000 | $255 | 45 |
| 3521 Melinda Pl | 0.71mi | 4/2.0 | 1,200 (-14%) | 2mo | $350,000 | $292 | 42 |
Match score weights: distance 35% · size 25% · config 20% · recency 20%. Top-matched comps best support the ARV.
Projected returns pro-forma
-3.0% appreciation · 4.92% rent growth · sell at horizon
- IRR
- -6.2%
- Equity multiple
- 0.77×
- Total profit
- $-15,325
- Equity at exit
- $34,845
- IRR
- 5.6%
- Equity multiple
- 1.45×
- Total profit
- $29,276
- Equity at exit
- $20,206
Cash invested: $65,436 (down + closing). Projections, not guarantees.
Landlord ↔ Tenant lean methodology
- Overall (STATE)
- 55 Moderately Landlord-Leaning
- State Virginia
- 55 Moderately Landlord-Leaning · D+2
- County
- — inherits STATE
- City
- — inherits STATE
ZIP-level market 23452
- Rents YoY
- 4.9%
- Active inventory
- 226
- Price-to-rent
- 8.4×
Monthly cashflow live
- Estimated rent
- $2,319 high interval (Pro) →
- Mortgage (P&I)
- −$1,226
- Tax from tax record
- −$227 /mo · $2,721/yr
- Insurance
- −$97
- HOA
- −$0
- Vacancy / Maint / Mgmt
- −$487
- Net cashflow
- $282
Break-even live
UW: 25.0% down · 7.5% · 30yr · 1.5% tax · 5.0% vac · 8.0% maint · 8.0% mgmt
Financing live
Cash to close
- Down payment
- $58,425
- Closing costs
- $7,011
- Reserves months
- —
- Total cash needed
- —
Loan-product check · same deal, 3 products live
Conventional
25% down · 7.5% · 30yr
- Down + closing
- —
- Monthly P&I
- —
- Monthly cashflow
- —
- DSCR
- —
- Eligible?
- —
Personal DTI + credit; lowest rate.
DSCR
20% down · 8.5% · 30yr
- Down + closing
- —
- Monthly P&I
- —
- Monthly cashflow
- —
- DSCR
- —
- Eligible?
- —
No personal income docs; deal must DSCR.
Hard money
10% down · 12.0% · 12mo
- Down + closing
- —
- Monthly P&I
- —
- Monthly cashflow
- —
- DSCR
- —
- Eligible?
- —
Short-term bridge; refi at stabilization.
Rent comps 30 comps
| Address | Beds | Baths | Sqft | Rent | $/sqft | DOM | Units | Dist |
|---|---|---|---|---|---|---|---|---|
| 224 Thalia Trace Dr Virginia Beach, VA | 3.0 | 1.5 | 1248 | $1,800 | $1.44 | 1d | 1 | 0.33mi |
| 278 Thalia Trace Dr Virginia Beach, VA | 3.0 | 1.5 | 1178 | $1,900 | $1.61 | 17d | 1 | 0.34mi |
| 3910 Inverness Rd Virginia Beach, VA | 3.0 | 1.5 | 1200 | $2,250 | $1.88 | 14d | 1 | 0.39mi |
| 3632 Silina Dr Virginia Beach, VA | 4.0 | 2.5 | 1666 | $2,495 | $1.50 | 7d | 1 | 0.52mi |
| 220 S Rosemont Rd Virginia Beach, VA | 4.0 | 2.0 | 1350 | $2,650 | $1.96 | 23d | 1 | 0.62mi |
| 212 Paladin Dr Virginia Beach, VA | 3.0 | 2.0 | 1456 | $2,800 | $1.92 | 23d | 1 | 0.72mi |
| 3600 Malibu Palms Dr Virginia Beach, VA | 1.0–3.0 | 1.0–1.5 | 1025 | $2,103 | $2.05 | 2d | 19 | 0.85mi |
| 149 S Budding Ave Virginia Beach, VA | 1.0–3.0 | 1.0–2.0 | 1100 | $2,169 | $1.97 | 1d | 30 | 0.87mi |
| 3444 Terrazzo Trl Virginia Beach, VA | 3.0 | 2.0 | 1217 | $1,650 | $1.36 | 4d | 1 | 0.89mi |
| 3424 Rainey Rd Virginia Beach, VA | 3.0 | 1.0 | 1002 | $1,995 | $1.99 | 7d | 1 | 0.91mi |
| 129 S Plaza Trl Virginia Beach, VA | 3.0 | 1.0 | 1456 | $2,000 | $1.37 | 23d | 1 | 0.96mi |
| 640 Counselor Sq Virginia Beach, VA | 3.0 | 1.5 | 1320 | $2,000 | $1.52 | 14d | 1 | 1.00mi |
| 629 Counselor Sq Virginia Beach, VA | 3.0 | 1.5 | 1326 | $1,995 | $1.50 | 23d | 1 | 1.00mi |
| 621 Chancery Sq Virginia Beach, VA | 3.0 | 1.0 | 1320 | $1,970 | $1.49 | 17d | 1 | 1.01mi |
| 3963 Wyckoff Dr Virginia Beach, VA | 3.0 | 2.5 | 1536 | $2,395 | $1.56 | 23d | 1 | 1.01mi |
| 3564 Faraday Ln Virginia Beach, VA | 4.0 | 2.5 | 1700 | $2,600 | $1.53 | 23d | 1 | 1.02mi |
| 3841 Forrester Ln Virginia Beach, VA | 3.0 | 2.0 | 1522 | $2,300 | $1.51 | 23d | 1 | 1.02mi |
| 104 S Palm Ave Virginia Beach, VA | 3.0 | 2.5 | 1700 | $2,900 | $1.71 | 23d | 1 | 1.07mi |
| 4016 Richard Lee Ct Virginia Beach, VA | 3.0 | 1.5 | 1470 | $2,100 | $1.43 | 2d | 1 | 1.10mi |
| 3416 Alcott Rd Virginia Beach, VA | 3.0 | 1.0 | 1043 | $1,800 | $1.73 | 23d | 1 | 1.14mi |
| 701 Arthur Ave Virginia Beach, VA | 4.0 | 1.5 | 1404 | $2,500 | $1.78 | 17d | 1 | 1.15mi |
| 3996 Roebling Ln Virginia Beach, VA | 3.0 | 2.5 | 1560 | $2,050 | $1.31 | 23d | 1 | 1.16mi |
| 408 Lineberry Rd Virginia Beach, VA | 4.0 | 2.0 | 1561 | $2,700 | $1.73 | 23d | 1 | 1.19mi |
| 412 Lineberry Rd Virginia Beach, VA | 4.0 | 2.5 | 1014 | $2,600 | $2.56 | 21d | 1 | 1.19mi |
| 3825 Annie Ln Virginia Beach, VA | 3.0 | 1.5 | 1460 | $2,100 | $1.44 | 12d | 1 | 1.20mi |
| 717 Grant Ave Virginia Beach, VA | 3.0 | 2.5 | 1248 | $2,160 | $1.73 | 23d | 1 | 1.21mi |
| 344 Dillon Dr Virginia Beach, VA | 3.0 | 1.5 | 1042 | $2,400 | $2.30 | 23d | 1 | 1.37mi |
| 3700 Snowdrift Cir Virginia Beach, VA | 1.0–3.0 | 1.0–2.0 | 887 | $2,599 | $2.93 | 23d | 1 | 1.38mi |
| 3816 Banyan Grove Ln Virginia Beach, VA | 1.0–3.0 | 1.0–2.0 | 945 | $2,630 | $2.78 | 1d | 15 | 1.45mi |
| 833 Tamarack Ct Virginia Beach, VA | 3.0 | 2.0 | 1650 | $2,100 | $1.27 | 16d | 1 | 1.48mi |
Listing history 3 events
-
2026-05-22status Pending
-
2026-04-23$233,700 Active
-
1966-03-31soldstatus $16,500
ⓘ Source: listings_history table (triggers on properties + properties_extension) + one-shot
backfill from property_details.listing_events for pre-trigger history.
Tax reassessment forecast VA · Resets to sale price
- Current annual tax
- $2,721 · $227/mo
- Projected year-2 tax
- $2,721 · $227/mo
- Expected delta
- $0/yr ($0/mo · 0.0%)
ⓘ Screening estimate from a state-policy table — verify with the county assessor before closing.
Climate risk First Street
- Flood 3/10 Moderate FEMA zone X (unshaded) · 9% chance over 30 yrs
- Wildfire 1/10 Low
- Heat 9/10 Extreme 7 d/yr ≥105°F today · 17 d/yr by 30 yrs out
- Wind 8/10 Severe 99% chance of damaging wind over 30 yrs
- Air quality 3/10 Moderate 2 unhealthy d/yr today · 4 by 30 yrs out
Nearby sold comps map
Loading sold comps map…
Walkable amenities ~0.75 mi
Loading nearby amenities…
Taxation est. · year 1
- Rental income
- $27,828
- − Mortgage interest
- −$13,091
- − Property taxes
- −$2,721
- − Insurance
- −$1,168
- − Repairs & maintenance
- −$2,226
- − Management
- −$2,226
- − Depreciation
- −$6,799
- Taxable loss
- −$403
- Est. tax savings @ 24.0%
- +$97
- After-tax cash flow
- $3,485/yr
For passive investors: Depreciation is non-cash, so a rental often shows a tax loss while cash-flowing — sheltering income. Rental losses are passive: they offset passive income freely, and up to $25,000/yr can offset ordinary (W-2) income if you actively participate and your MAGI is under $100k (phasing out to $0 by $150k); unused losses carry forward. On sale, claimed depreciation is recaptured at up to 25%, and gains may owe capital-gains tax (a 1031 exchange can defer both). Figures are a year-1 estimate at your 24.0% rate — not tax advice; consult a CPA.
Schools (NCES district)
- District
- Va Beach City Public School District
- NCES district ID
- 5103840
- Math proficiency
- 69% ▼ -19.00%
- Reading proficiency
- 78% ▼ -7.00%
- Median HH income
- $66,452
- Composite
- 63.81/100
- National rank
- #594
- State rank
- #10 of 131 in VA
Livability — Virginia Beach
- Score
- 83/100
- State rank
- #38
- US rank
- #880
Category grades
Schools grade is shown separately in the Schools card above.
Census & demographics
- Census place
- Virginia Beach, VA
- County
- Virginia Beach City · 448,227 people
- City population
- 448,227
- Metro
- Virginia Beach-Norfolk-Newport News, VA-NC
- Population (ZIP)
- 58,455
- Household income
- $79,085
- Rent vs Own
- Severe rent burden
- 2293.0
Population outlook (Virginia Beach County) Hauer SSP2
- Today (2025)
- 480,401 people
- By 2030
- 491,221 · +2.3%
- By 2040
- 504,882 · +5.1%
- By 2050
- 508,847 · +5.9%
- By 2075
- 504,831 · +5.1%
- By 2100
- 465,867 · -3.0%
Race, ethnicity, and origin ACS 2023
- Neighborhood character
- Diverse neighborhood (Simpson 0.59)
- Race & ethnicity
- White 60% Black 20% Two or more races 10% Hispanic / Latino 9% Asian 5%
- Hispanic origin (detail)
- Mexican 2% Puerto Rican 3%
- Common ancestry
- Romanian 2% Italian 2% Lithuanian 2%
- Foreign-born
- 8% · Canada, Jamaica
- Languages at home
- 88% English-only · Spanish 6% Tagalog/Filipino 2% Other Asian/Pacific 1%
Political lean MEDSL · Virginia Beach
- 2024 margin
- Toss-up / Even · D 50.7% · R 48.0% · Other 1.3%
- 2008→2024 swing
- +3.4pp toward D · 2008: -0.7pp · 2024: 2.6pp
- All cycles
- 2024: D+2.6 2020: D+5.4 2016: R+4.5 2012: R+2.5 2008: R+0.7
Not yet ingested
- Civics
- —
Market trends
- HPI YoY
- ▼ -363.80%
- Current HPI
- 328.5435
- Rent YoY
- ▲ 4.92%
- Metro
- Virginia Beach-Norfolk-Newport News, VA-NC
- State GDP YoY
- ▲ 2.40%
- F500 in state
- 50
Industry mix (Fortune 500 HQ in VA)
| Industry | F500 HQs | Revenue |
|---|---|---|
| Aerospace / Defense | 4 | $236B |
|
||
| Technology / Defense | 3 | $32B |
|
||
| Financial Services | 2 | $176B |
|
||
| Utilities | 2 | $27B |
|
||
| Insurance | 2 | $25B |
|
||
| Technology | 2 | $15B |
|
||
Price history
+1316.4% since first listed3 events — show timeline
- 2026-05-22 Pending — CVRMLS
- 2026-04-23 Listed $233,700 CVRMLS
- 1966-03-31 Sold (Public Records) $16,500 Public Records
Property tax history
+4.2%/yrLatest (2025): $2,721 · +129.1% YoY. Source: county tax records.
Cash-flow waterfall
monthlySold comps — $/sqft
last 12 mo · ≤1 miLoading sold comps…