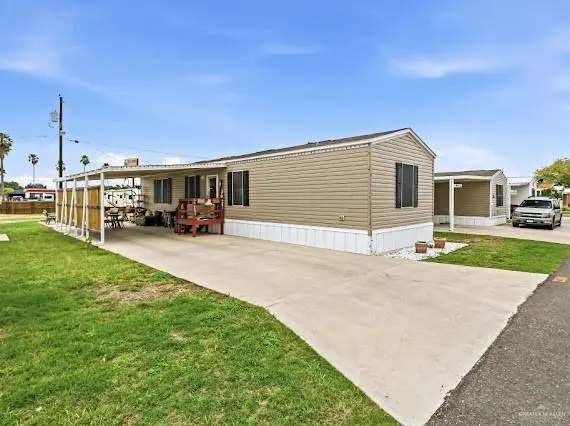
1005 N Stewart Rd #71 · Mission, TX
Flood risk 5/10 · Moderate
- FEMA flood zone
- X
- Chance of flooding over 30 yrs
- 0.67%
- Est. flood insurance / yr
- $507 – $1,088
Fire risk 1/10 · Minimal
- Est. fire insurance / yr
- $1,222 – $2,270
Heat risk 9/10 · Severe
- Hot days now (above 111°F)
- 7 days/yr
- Hot days in 30 yrs
- 20 days/yr
Wind risk 8/10 · Major
- Chance of severe wind over 30 yrs
- 94.0%
Air-quality risk 2/10 · Minimal
- Unhealthy air days now
- 1 days/yr
- Unhealthy air days in 30 yrs
- 2 days/yr
Risk factors via First Street. Map © Google.
Why this score? — see what drove the B+ grade
The composite is a weighted blend of 9 inputs, each scored 0–100. Each bar is that input's sub-score; the figure is the points it added to the 100-point composite (weight × sub-score).
- Cash flow +30.0/30.0
- ARV discount +15.0/15.0
- 1% rule +10.0/10.0
- DSCR +10.0/10.0
- Livability +3.8/5.0
- Condition / age +3.8/5.0
- Rent growth +2.7/5.0
- Schools +1.7/10.0
- Appreciation +0.0/10.0
$50,000
🖨 Deal sheet 📄 Offer letter ✓ Due diligence
Listing remarks
Lot 71. Spacious manufactured home situated on a desirable mobile park! This well-maintained home features an open layout, updated flooring, and a generously sized living area. The kitchen includes refrigerator, stove, and microwave ). Enjoy outdoor living with a covered patio complete with patio set. Additional highlights include a 2-car carport, A/C unit, walk-in closet, and washer & dryer included. Located in an 55+ community (buyer to verify lot rent and park requirements). Schedule your showing today!
Key facts
- 2-car carport
- A/c unit
- Walk-in closet
Tags
Property features AI
Finance
- Other: Located in a space within Tradewinds Trailer Park (space 71); Living area source: HidalgoCAD
- Financial info: Escrow information not applicable
- HOA & community: No homeowners association; Community amenities include a pool and sidewalks; Senior community
Exterior
- Parking: 2 covered parking spaces; 2-car carport (counts toward covered spaces); Other garage or carport configuration
- Security: Smoke detector(s)
- Utilities: Sewer: other; Cable available; Electric water heater
- Home design: Mobile/manufactured home (located in a trailer park); Energy Star rated
- Construction: Vinyl siding; Shingle roof; Pillar/post/pier foundation; Built area approximately 928 square feet
- Exterior features: Covered patio with patio slab; In-ground pool; Fencing (unspecified type); Other exterior features; Paved road access
Interior
- Kitchen: Electric smooth-top range; Refrigerator; Dishwasher not listed
- Bedrooms: Primary bedroom with walk-in closet
- Flooring: Laminate
- Bathrooms: 2 full bathrooms
- Heating & cooling: Central heating; Central air conditioning; Has heating and cooling
- Interior features: Granite countertops; Ceiling fans; Split bedroom layout; Walk-in closet(s); Mini blinds; Laminate flooring
- Laundry & utility: Laundry room; Washer; Dryer; Electric water heater
Neighborhood map
What this means for you Summary
Snapshot
- This is a 2-bed/2.0-bath manufactured listed at $50k. Condition is rated good.
Deal economics
- At list price, monthly cash flow is $515 ($6k/yr) — positive.
- The deal already cash-flows at list — no discount required.
- Meets the 1% rule at list price ($1k rent vs $50k).
- Recommended offer: $48k (3.0% below list) — sets the bar for market timing.
- Cap rate 18.7% vs local median 3.5% in Mission — top-decile yield for the area; either an underpriced asset or a hidden risk that comps aren't pricing in. Stress-test before assuming the spread holds.
Location & tenants
- Location reads 75/100 on livability (#148 in TX, #4,155 nationally) — a middle-class / working-renter tenant base. Strengths: cost of living A+, housing A+, health & safety A+; Watch: amenities F, commute F, employment D-.
- Mission CISD (urban): math 15% / reading 28% proficiency, ranked #775 of 826 in TX (top 94%) — low school quality limits family demand, transient renter base, plan for 1-2y turnover; 78% free/reduced lunch — lower-income household profile, screen leases tightly.
- Zoned schools: Bryan El (math 17% / reading 32%, grade F, #3,052 of 4,322 statewide, top 74%, 651 students, 71% FRL); Mission J H (math 13% / reading 26%, grade F, #1,445 of 1,662 statewide, top 88%, 680 students, 78% FRL); Veterans Memorial H S (math 19% / reading 44%, grade F, #1,073 of 1,632 statewide, top 66%, 1,932 students, 81% FRL) — zoned schools at 77% FRL track the district average.
- Market conditions: Rents flat; 852 active listings in the ZIP; 32 comparable units currently listed for rent nearby; rentals lingering (median 44d on market — plan ~5-8 weeks vacancy on turnover, expect pricing pressure); 66% of comp listings sitting > 30 days — soft ceiling on asking rent; 7,378 units permitted in Hidalgo County in 2024 (641 in 5+ unit buildings).
Forward outlook
- Local home prices are declining (-3.0%/yr); year-one equity from $346 of loan paydown is wiped out by about $2k of value loss. Plan a longer hold.
- Hidalgo County population projected at +28% by 2050 — long-run rental-demand tailwind backs the buy-and-hold thesis.
- At projected returns (-3.0% appreciation + 0.9% rent growth), your $14k cash investment doubles in ~3 years — after that, you're playing with house money.
Negotiation context
- It's been on market 56 days — a 3% lower offer ($48k) is reasonable based on typical stale-listing flexibility.
Risks & watch-outs
- Climate carrying-cost: moderate flood risk; severe wind risk, 94% chance of damaging wind over 30y; extreme-heat days projected 7→20/yr by 2055 (HVAC capex compounding) — expect insurance premiums to compound above CPI over the hold.
Questions for the listing agent
- It's been on market 56 days. Have you received any prior offers? Is the seller open to a 3% concession, seller financing, or rate buy-down credit?
- Is there a deadline driving the sale (1031 exchange, divorce, estate, relocation)? That informs how much negotiation room exists.
- What's the average days-on-market for RENTAL listings here right now (not sales)? A rising rental-DOM trend means longer vacancies and softer asking-rent achievability than the comps imply.
- What's the recent tenant-quality profile in this submarket — average credit score on applications, eviction rate, late-payment / NSF rate, and stable-employment percentage? A property-management company in the area should have these aggregated.
- How much new for-sale + rental construction is in the pipeline within 1–3 miles? Heavy new supply typically softens prices + rents 12–24 months out; constrained supply supports both.
Investment metrics
- 1% rule
- 2.18% ✓
- Cap rate
- 18.66%
- Cash-on-cash
- 44.17%
- DSCR
- 2.97
- GRM
- 3.8
CMA / ARV
- ARV (median comp)
- $75,163
- List price
- $50,000
- Delta
- -33.48%
- Verdict
- UNDERPRICED
- Comps
- 20 within 1.0 mi
Show comp detail 9 sales within ~0.75 mi
| Address | Dist | Beds/Ba | Sqft | Sold | Price | $/sf | Match |
|---|---|---|---|---|---|---|---|
| 1510 E Business 83 Unit F22 | 0.17mi | 2/1.5 | 854 (-8%) | 6mo | $75,000 | $88 | 72 |
| 1304 Breezy Dr | 0.27mi | 2/2.0 | 952 (+3%) | 15mo | $89,900 | $94 | 71 |
| 1400 Tropical Cir | 0.31mi | 2/1.5 | 910 (-2%) | 13mo | $57,000 | $63 | 69 |
| 1301 Breezy Dr | 0.26mi | 2/1.0 | 832 (-10%) | 3mo | $99,900 | $120 | 64 |
| 708 Showers Dr #122 | 0.26mi | 2/1.5 | 840 (-10%) | 8mo | $49,900 | $59 | 64 |
| 510 Santa Cruz Dr | 0.48mi | 2/2.0 | 900 (-3%) | 10mo | $160,000 | $178 | 64 |
| 802 Showers Dr | 0.19mi | 2/1.5 | 1,024 (+10%) | 12mo | $77,000 | $75 | 62 |
| 415 Saturn St | 0.45mi | 2/2.0 | 896 (-3%) | 17mo | $79,000 | $88 | 59 |
| 502 Sagittarius St | 0.42mi | 2/2.0 | 1,064 (+15%) | 4mo | $110,000 | $103 | 53 |
Match score weights: distance 35% · size 25% · config 20% · recency 20%. Top-matched comps best support the ARV.
Projected returns pro-forma
-3.0% appreciation · 0.93% rent growth · sell at horizon
- IRR
- 38.8%
- Equity multiple
- 2.61×
- Total profit
- $22,509
- Equity at exit
- $7,455
- IRR
- 44.2%
- Equity multiple
- 4.80×
- Total profit
- $53,173
- Equity at exit
- $4,323
Cash invested: $14,000 (down + closing). Projections, not guarantees.
Landlord ↔ Tenant lean methodology
- Overall (STATE)
- 87 Strongly Landlord-Friendly
- State Texas
- 87 Strongly Landlord-Friendly · R+5
- County
- — inherits STATE
- City
- — inherits STATE
ZIP-level market 78572
- Home prices YoY
- -22.9%
- Rents YoY
- 0.9%
- Active inventory
- 852
- Price-to-rent
- 3.8×
Monthly cashflow live
- Estimated rent
- $1,090 high interval (Pro) →
- Mortgage (P&I)
- −$262
- Tax est. 1.5%
- −$62 /mo · $750/yr
- Insurance
- −$21
- HOA
- −$0
- Vacancy / Maint / Mgmt
- −$229
- Net cashflow
- $515
Break-even live
UW: 25.0% down · 7.5% · 30yr · 1.5% tax · 5.0% vac · 8.0% maint · 8.0% mgmt
Financing live
Cash to close
- Down payment
- $12,500
- Closing costs
- $1,500
- Reserves months
- —
- Total cash needed
- —
Loan-product check · same deal, 3 products live
Conventional
25% down · 7.5% · 30yr
- Down + closing
- —
- Monthly P&I
- —
- Monthly cashflow
- —
- DSCR
- —
- Eligible?
- —
Personal DTI + credit; lowest rate.
DSCR
20% down · 8.5% · 30yr
- Down + closing
- —
- Monthly P&I
- —
- Monthly cashflow
- —
- DSCR
- —
- Eligible?
- —
No personal income docs; deal must DSCR.
Hard money
10% down · 12.0% · 12mo
- Down + closing
- —
- Monthly P&I
- —
- Monthly cashflow
- —
- DSCR
- —
- Eligible?
- —
Short-term bridge; refi at stabilization.
Rent comps 32 comps
| Address | Beds | Baths | Sqft | Rent | $/sqft | DOM | Units | Dist |
|---|---|---|---|---|---|---|---|---|
| 513 San Antonio Ave Apt 8 Mission, TX | 1.0 | 1.5 | 971 | $975 | $1.00 | 43d | 1 | 0.49mi |
| 606 San Antonio Ave Unit 1 Mission, TX | 2.0 | 2.0 | 900 | $850 | $0.94 | 23d | 1 | 0.50mi |
| 606 San Antonio Ave Unit 606-4 Mission, TX | 2.0 | 1.0 | 900 | $850 | $0.94 | 43d | 1 | 0.51mi |
| 606 San Antonio Ave Unit 4 Mission, TX | 2.0 | 2.0 | 900 | $895 | $0.99 | 21d | 1 | 0.51mi |
| 600 San Antonio Ave Unit 7 Mission, TX | 2.0 | 2.0 | 900 | $880 | $0.98 | 43d | 1 | 0.52mi |
| 103 Yosemite Dr Unit 2 Mission, TX | 3.0 | 2.0 | 1116 | $1,375 | $1.23 | 43d | 1 | 0.70mi |
| 1006 Fairway Dr Mission, TX | 2.0 | 2.0 | 1072 | $1,100 | $1.03 | 43d | 1 | 0.76mi |
| 806 Ragland Rd Unit 1 Mission, TX | 1.0 | 1.0 | 651 | $925 | $1.42 | 43d | 1 | 0.83mi |
| 800 Ragland Rd Unit 10 Mission, TX | 3.0 | 2.0 | 1053 | $1,325 | $1.26 | 43d | 1 | 0.83mi |
| 800 Ragland Rd Unit 5 Mission, TX | 1.0 | 1.0 | 651 | $925 | $1.42 | 43d | 1 | 0.83mi |
| 800 Ragland Rd Unit 9 Mission, TX | 2.0 | 2.0 | 913 | $1,150 | $1.26 | 43d | 1 | 0.83mi |
| 720 Ragland Rd #8 Mission, TX | 3.0 | 2.0 | 1053 | $1,300 | $1.23 | 23d | 1 | 0.84mi |
| 720 Ragland Rd #6 Mission, TX | 1.0 | 1.0 | 651 | $925 | $1.42 | 43d | 1 | 0.84mi |
| 716 Ragland Rd #3 Mission, TX | 1.0 | 1.0 | 651 | $925 | $1.42 | 43d | 1 | 0.84mi |
| 106 S Bryan Rd Unit 13 Mission, TX | 2.0 | 1.0 | 720 | $725 | $1.01 | 43d | 1 | 0.84mi |
| 2105 Selena St Mission, TX | 3.0 | 2.0 | 1100 | $1,500 | $1.36 | 14d | 1 | 0.85mi |
| 1901 N Glasscock Rd Unit 17-A Mission, TX | 3.0 | 2.0 | 924 | $950 | $1.03 | 43d | 1 | 0.92mi |
| 1901 N Glasscock Rd Lot 61 Mission, TX | 3.0 | 2.0 | 960 | $526 | $0.55 | 19d | 1 | 0.92mi |
| 2113 Amy St Mission, TX | 2.0 | 2.0 | 784 | $875 | $1.12 | 23d | 1 | 0.93mi |
| 2002 E 1st St Mission, TX | 3.0 | 2.0 | 1017 | $1,300 | $1.28 | 43d | 1 | 0.96mi |
| 1901 N Glasscock Rd Unit 150 Mission, TX | 2.0 | 2.0 | 800 | $850 | $1.06 | 43d | 1 | 0.96mi |
| 2008 Selena St Unit 3 Mission, TX | 3.0 | 2.0 | 1092 | $1,450 | $1.33 | 43d | 1 | 0.99mi |
| 104 Sunflower St Unit 5 Mission, TX | 3.0 | 2.0 | 950 | $1,550 | $1.63 | 14d | 1 | 1.02mi |
| 2311 Dora Jeanne Dr Unit A Mission, TX | 2.0 | 2.0 | 975 | $950 | $0.97 | 43d | 1 | 1.05mi |
| 405 Cory Dr Mission, TX | 2.0 | 1.0 | 832 | $750 | $0.90 | 21d | 1 | 1.06mi |
| 402 Cory Dr Unit B-10 Mission, TX | 2.0 | 1.0 | 714 | $750 | $1.05 | 43d | 1 | 1.06mi |
| 1500 E 24th St Unit B-6 Mission, TX | 2.0 | 2.0 | 1010 | $975 | $0.97 | 43d | 1 | 1.06mi |
| 2112 Cassandra St Unit 2 Mission, TX | 3.0 | 2.0 | 1050 | $1,395 | $1.33 | 43d | 1 | 1.07mi |
| 816 Travis St Mission, TX | 1.0–2.0 | 1.0–2.0 | 952 | $1,215 | $1.28 | 43d | 12 | 1.17mi |
| 2210 E 1st St Unit 34 Mission, TX | 1.0 | 1.0 | 700 | $850 | $1.21 | 23d | 1 | 1.20mi |
| 900 Travis St Mission, TX | 1.0–2.0 | 1.0–2.0 | 1053 | $1,250 | $1.19 | 14d | 1 | 1.28mi |
| 1400 N Dunlap Ave Mission, TX | 2.0 | 1.0 | 1068 | $800 | $0.75 | 19d | 1 | 1.43mi |
Listing history 16 events
-
2026-06-18days on market $50,000 Active 56 DOM
-
2026-06-17days on market $50,000 Active 55 DOM
-
2026-06-16days on market $50,000 Active 54 DOM
-
2026-06-15days on market $50,000 Active 53 DOM
-
2026-06-14days on market $50,000 Active 51 DOM
-
2026-06-10days on market $50,000 Active 48 DOM
-
2026-06-09days on market $50,000 Active 47 DOM
-
2026-06-08days on market $50,000 Active 46 DOM
-
2026-06-07days on market $50,000 Active 45 DOM
-
2026-06-03days on market $50,000 Active 41 DOM
-
2026-06-02days on market $50,000 Active 40 DOM
-
2026-06-01days on market $50,000 Active 39 DOM
-
2026-05-31days on market $50,000 Active 38 DOM
-
2026-05-31days on market $50,000 Active 37 DOM
-
2026-05-15price $50,000 517-char remark
-
2026-04-23$55,000 Active 517-char remark
ⓘ Source: listings_history table (triggers on properties + properties_extension) + one-shot
backfill from property_details.listing_events for pre-trigger history.
Climate risk First Street
- Flood 5/10 Major FEMA zone X · 67% chance over 30 yrs
- Wildfire 1/10 Low
- Heat 9/10 Extreme 7 d/yr ≥111°F today · 20 d/yr by 30 yrs out
- Wind 8/10 Severe 94% chance of damaging wind over 30 yrs
- Air quality 2/10 Low 1 unhealthy d/yr today · 2 by 30 yrs out
Nearby sold comps map
Loading sold comps map…
Walkable amenities ~0.75 mi
Loading nearby amenities…
Taxation est. · year 1
- Rental income
- $13,076
- − Mortgage interest
- −$2,801
- − Property taxes
- −$750
- − Insurance
- −$250
- − Repairs & maintenance
- −$1,046
- − Management
- −$1,046
- − Depreciation
- −$1,455
- Taxable income
- $5,728
- Est. tax owed @ 24.0%
- −$1,375
- After-tax cash flow
- $4,809/yr
For passive investors: Depreciation is non-cash, so a rental often shows a tax loss while cash-flowing — sheltering income. Rental losses are passive: they offset passive income freely, and up to $25,000/yr can offset ordinary (W-2) income if you actively participate and your MAGI is under $100k (phasing out to $0 by $150k); unused losses carry forward. On sale, claimed depreciation is recaptured at up to 25%, and gains may owe capital-gains tax (a 1031 exchange can defer both). Figures are a year-1 estimate at your 24.0% rate — not tax advice; consult a CPA.
Condition & rehab AI · 12 photos
This well-maintained mobile home is in good condition with updated features and a spacious layout. Minor exterior touch-ups and landscaping improvements would further enhance its appeal.
Value-add opportunities
- Resale paint exterior — enhances curb appeal
- Both update landscaping — improves curb appeal and adds value
- Both install new outdoor lighting — enhances safety and curb appeal
Renovation cost estimate screening
Value-add ROI direction
- Resale paint exterior — enhances curb appeal ↑
- Both update landscaping — improves curb appeal and adds value ↑
- Both install new outdoor lighting — enhances safety and curb appeal ↑
ⓘ Cost ranges are severity-bucket heuristics (US national rule-of-thumb). Get contractor quotes + a written scope before underwriting a rehab budget.
Schools (NCES district)
- District
- Mission CISD
- NCES district ID
- 4831040
- Math proficiency
- 15% ▼ -35.00%
- Reading proficiency
- 28% ▼ -15.00%
- Median HH income
- $32,855
- Composite
- 17.47/100
- National rank
- #9061
- State rank
- #775 of 826 in TX
Livability — Mission
- Score
- 75/100
- State rank
- #148
- US rank
- #4155
Category grades
Schools grade is shown separately in the Schools card above.
Census & demographics
- Census place
- Mission, TX
- County
- Hidalgo County · 623,128 people
- City population
- 78,024
- Metro
- McAllen-Edinburg-Mission, TX
- Population (ZIP)
- 78,024
- Household income
- $54,298
- Rent vs Own
- Severe rent burden
- 1714.0
Population outlook (Hidalgo County) Hauer SSP2
- Today (2025)
- 955,232 people
- By 2030
- 1,009,774 · +5.7%
- By 2040
- 1,120,332 · +17.3%
- By 2050
- 1,225,036 · +28.2%
- By 2075
- 1,439,189 · +50.7%
- By 2100
- 1,533,429 · +60.5%
Race, ethnicity, and origin ACS 2023
- Neighborhood character
- Predominantly Hispanic (85%)
- Race & ethnicity
- Hispanic / Latino 85% Two or more races 47% White 12% Asian 2%
- Hispanic origin (detail)
- Mexican 80%
- Common ancestry
- Slovak 1% Portuguese 0%
- Foreign-born
- 28% · Canada, South Korea
- Languages at home
- 22% English-only · Spanish 76%
Political lean MEDSL · Hidalgo
- 2024 margin
- Toss-up / Even · D 48.1% · R 51.0%
- 2008→2024 swing
- -41.6pp toward R · 2008: 38.7pp · 2024: -2.9pp
- All cycles
- 2024: R+2.9 2020: D+17.1 2016: D+40.5 2012: D+41.8 2008: D+38.7
Not yet ingested
- Civics
- —
Market trends
- HPI YoY
- ▼ -62.35%
- Current HPI
- 209.3573
- Rent YoY
- ▲ 0.93%
- Metro
- McAllen-Edinburg-Mission, TX
- State GDP YoY
- ▲ 3.95%
- F500 in state
- 110
Industry mix (Fortune 500 HQ in TX)
| Industry | F500 HQs | Revenue |
|---|---|---|
| Energy | 16 | $1,198B |
|
||
| Technology | 5 | $198B |
|
||
| Engineering / Construction | 4 | $72B |
|
||
| Energy Services | 3 | $60B |
|
||
| Utilities | 3 | $41B |
|
||
| Healthcare | 2 | $330B |
|
||
Price history
-9.1% since first listed2 events — show timeline
- 2026-05-15 Price Changed $50,000 MCALLENMLS
- 2026-04-23 Listed $55,000 MCALLENMLS
Cash-flow waterfall
monthlySold comps — $/sqft
last 12 mo · ≤1 miLoading sold comps…