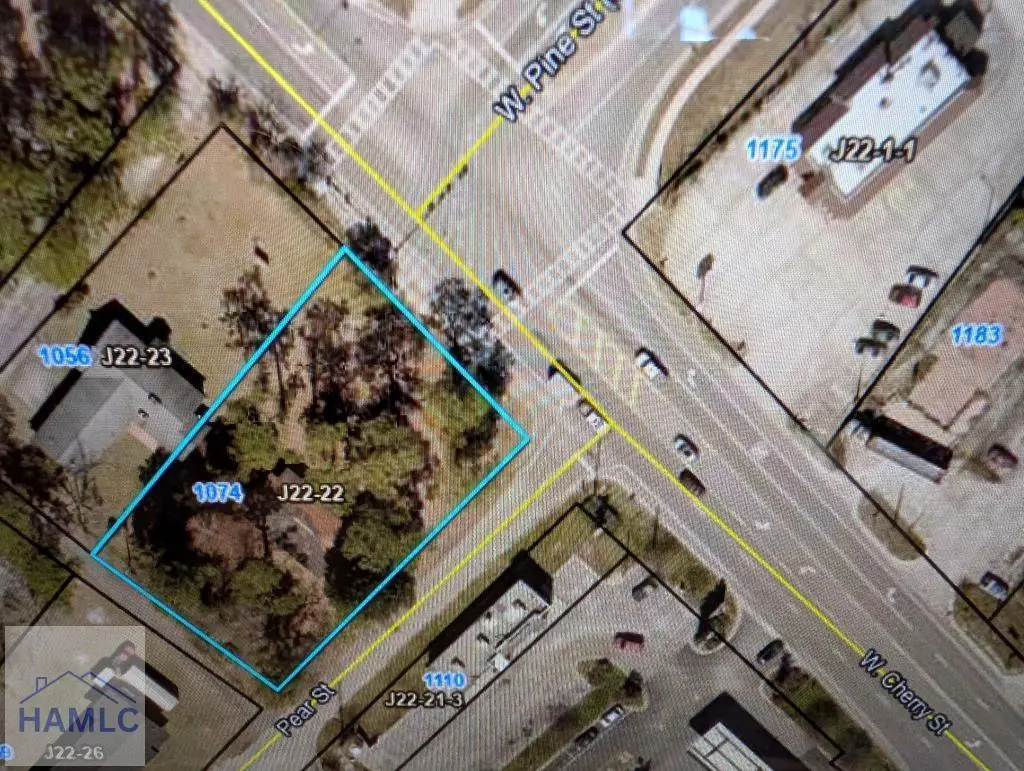
1074 East Cherry St · Jesup, GA
Flood risk 3/10 · Minor
- FEMA flood zone
- X (unshaded)
- Chance of flooding over 30 yrs
- 0.2%
- Est. flood insurance / yr
- $507 – $1,088
Fire risk 5/10 · Moderate
- Est. fire insurance / yr
- $963 – $1,789
Heat risk 9/10 · Severe
- Hot days now (above 109°F)
- 7 days/yr
- Hot days in 30 yrs
- 19 days/yr
Wind risk 8/10 · Major
- Chance of severe wind over 30 yrs
- 99.0%
Air-quality risk 2/10 · Minimal
- Unhealthy air days now
- 2 days/yr
- Unhealthy air days in 30 yrs
- 2 days/yr
Risk factors via First Street. Map © Google.
Why this score? — see what drove the C- grade
The composite is a weighted blend of 9 inputs, each scored 0–100. Each bar is that input's sub-score; the figure is the points it added to the 100-point composite (weight × sub-score).
- Cash flow +26.1/30.0
- DSCR +8.8/10.0
- 1% rule +6.1/10.0
- Livability +3.5/5.0
- Schools +2.9/10.0
- Rent growth +2.5/5.0
- Condition / age +2.5/5.0
- ARV discount +0.0/15.0
- Appreciation +0.0/10.0
$135,250
🖨 Deal sheet (PDF) 📄 Offer letter ✓ Due diligence
Listing remarks MLS
Prime Commercial Potential at Major Highway Intersection, E Cherry and the Hwy 301/341 Bypass. Unlock the value of this high-visibility lot situated directly facing the traffic light at the intersection of E Cherry and the Hwy 301/341 Bypass. While currently zoned R3-Residential, this property is surrounded by established commercial developments, making it a premier candidate for rezoning. The existing structure has been vacant and requires significant renovation; however, the true value lies in the land and its strategic location. Sold As-Is, this is a "lot-value" play perfectly positioned for your next business venture. Bring your Offers.
Key facts
- Commercial potential
- High-visibility lot
- Strategic location
Tags
Neighborhood map
What this means for you Summary
Snapshot
- This is a 3-bed/1.0-bath single-family listed at $135k.
Deal economics
- At list price, monthly cash flow is $342 ($4k/yr) — positive.
- The deal already cash-flows at list — no discount required.
- Meets the 1% rule at list price ($1k rent vs $135k).
- Recommended offer: $123k (9.0% below list) — sets the bar for market timing.
- Cap rate 9.3% vs local median 4.5% in Jesup — top-decile yield for the area; either an underpriced asset or a hidden risk that comps aren't pricing in. Stress-test before assuming the spread holds.
Location & tenants
- Location reads 69/100 on livability (#112 in GA) — a middle-class / working-renter tenant base. Strengths: cost of living A+, housing A+, health & safety A+; Watch: amenities F, commute F, employment D-.
- Wayne County (rural): math 35% / reading 35% proficiency, ranked #68 of 174 in GA (top 39%) — families likely to look elsewhere, expect single-tenant / working-renter base with shorter leases; 60% free/reduced lunch — lower-income household profile, screen leases tightly.
- Zoned schools: Jesup Elementary School (math 32% / reading 22%, grade F, #689 of 1,228 statewide, top 58%, 680 students, 75% FRL); Arthur Williams Middle School (math 33% / reading 39%, grade F, #178 of 470 statewide, top 39%, 650 students, 75% FRL); Wayne County High School (math 32% / reading 40%, grade F, #74 of 424 statewide, top 18%, 1,467 students, 75% FRL) — zoned schools average 75% FRL vs 60% district-wide (15 pts higher); higher-poverty schools than district average — tighter screening recommended.
- Market conditions: 84 active listings in the ZIP; 2 comparable units currently listed for rent nearby; 163 units permitted in Wayne County in 2024 (0 in 5+ unit buildings).
Forward outlook
- Local home prices are declining (-3.0%/yr); year-one equity from $936 of loan paydown is wiped out by about $4k of value loss. Plan a longer hold.
- Wayne County population projected to shrink 10% by 2050 — rents likely to lag national; underwrite the cash flow, not the appreciation.
Negotiation context
- It's been on market 107 days — a 9% lower offer ($123k) is reasonable based on typical stale-listing flexibility.
- Current owner paid $116k; 17% above their basis — modest negotiation headroom, anchor on the comps not their cost.
Risks & watch-outs
- Watch-outs: built in 1949 — expect roof / HVAC / electrical / plumbing capex.
- Climate carrying-cost: severe wind risk, 99% chance of damaging wind over 30y; moderate wildfire risk; extreme-heat days projected 7→19/yr by 2055 (HVAC capex compounding) — expect insurance premiums to compound above CPI over the hold.
Questions for the listing agent
- It's been on market 107 days. Have you received any prior offers? Is the seller open to a 9% concession, seller financing, or rate buy-down credit?
- Built in 1949 — when were the roof, HVAC, electrical panel, plumbing, and water heater last replaced?
- Why hasn't it sold? Are there any deal-killer items the seller is aware of (foundation, flood, title, zoning, code violations)?
- Is there a deadline driving the sale (1031 exchange, divorce, estate, relocation)? That informs how much negotiation room exists.
- Schools are F-rated, which usually means shorter tenancies and higher turnover. Who's the typical renter profile here, and what's been the actual vacancy rate?
- What's the average days-on-market for RENTAL listings here right now (not sales)? A rising rental-DOM trend means longer vacancies and softer asking-rent achievability than the comps imply.
- What's the recent tenant-quality profile in this submarket — average credit score on applications, eviction rate, late-payment / NSF rate, and stable-employment percentage? A property-management company in the area should have these aggregated.
- How much new for-sale + rental construction is in the pipeline within 1–3 miles? Heavy new supply typically softens prices + rents 12–24 months out; constrained supply supports both.
Investment metrics
- 1% rule
- 1.11% ✓
- Cap rate
- 9.33%
- Cash-on-cash
- 10.83%
- DSCR
- 1.48
- GRM
- 7.5
CMA / ARV
- ARV (median comp)
- $105,706
- List price
- $135,250
- Delta
- 27.95%
- Verdict
- OVERPRICED
- Comps
- 20 within 1.0 mi
Show comp detail 7 sales within ~0.75 mi
| Address | Dist | Beds/Ba | Sqft | Sold | Price | $/sf | Match |
|---|---|---|---|---|---|---|---|
| 1312 E Plum St | 0.26mi | 2/2.0 (-1) | 1,253 (-7%) | 4mo | $149,000 | $119 | 63 |
| 242 South Wayne St | 0.72mi | 3/2.0 | 1,336 (-1%) | 13mo | $240,000 | $180 | 49 |
| 484 Austin Ave | 0.68mi | 3/2.0 | 1,335 (-1%) | 20mo | $225,000 | $169 | 46 |
| 113 Mayfair Rd | 0.75mi | 3/1.5 | 1,200 (-11%) | 1mo | $162,000 | $135 | 44 |
| 294 Pine Ridge Rd | 0.74mi | 3/2.0 | 1,204 (-11%) | 8mo | $204,900 | $170 | 37 |
| 102 Tanglewood Dr | 0.61mi | 3/2.0 | 1,448 (+7%) | 23mo | $145,000 | $100 | 36 |
| 342 E Orange St | 0.68mi | 3/2.0 | 1,461 (+8%) | 17mo | $119,000 | $81 | 36 |
Match score weights: distance 35% · size 25% · config 20% · recency 20%. Top-matched comps best support the ARV.
Projected returns pro-forma
-3.0% appreciation · 3.0% rent growth · sell at horizon
- IRR
- -0.1%
- Equity multiple
- 1.00×
- Total profit
- $-177
- Equity at exit
- $20,166
- IRR
- 9.5%
- Equity multiple
- 1.73×
- Total profit
- $27,739
- Equity at exit
- $11,694
Cash invested: $37,870 (down + closing). Projections, not guarantees.
Landlord ↔ Tenant lean methodology
- Overall (STATE)
- 90 Strongly Landlord-Friendly
- State Georgia
- 90 Strongly Landlord-Friendly · R+3
- County
- — inherits STATE
- City
- — inherits STATE
ZIP-level market 31546
- Home prices YoY
- -5.2%
- Active inventory
- 84
- Price-to-rent
- 7.5×
Monthly cashflow live
- Estimated rent
- $1,495 medium interval (Pro) →
- Mortgage (P&I)
- −$709
- Tax from tax record
- −$74 /mo · $882/yr
- Insurance
- −$56
- HOA
- −$0
- Vacancy / Maint / Mgmt
- −$314
- Net cashflow
- $342
Break-even live
Sensitivity live
| Price | -10% $418 | -5% $380 | +0% $342 | +5% $304 | +10% $265 |
|---|---|---|---|---|---|
| Rent | -10% $224 | -5% $283 | +0% $342 | +5% $401 | +10% $460 |
| Rate | -1.0pp $410 | -0.5pp $376 | base $342 | +0.5pp $307 | +1.0pp $271 |
UW: 25.0% down · 7.5% · 30yr · 1.5% tax · 5.0% vac · 8.0% maint · 8.0% mgmt
Financing live
Cash to close
- Down payment
- $33,812
- Closing costs
- $4,058
- Reserves months
- —
- Total cash needed
- —
Loan-product check · same deal, 3 products live
Conventional
25% down · 7.5% · 30yr
- Down + closing
- —
- Monthly P&I
- —
- Monthly cashflow
- —
- DSCR
- —
- Eligible?
- —
Personal DTI + credit; lowest rate.
DSCR
20% down · 8.5% · 30yr
- Down + closing
- —
- Monthly P&I
- —
- Monthly cashflow
- —
- DSCR
- —
- Eligible?
- —
No personal income docs; deal must DSCR.
Hard money
10% down · 12.0% · 12mo
- Down + closing
- —
- Monthly P&I
- —
- Monthly cashflow
- —
- DSCR
- —
- Eligible?
- —
Short-term bridge; refi at stabilization.
Rent comps 2 comps
| Address | Beds | Baths | Sqft | Rent | $/sqft | DOM | Units | Dist |
|---|---|---|---|---|---|---|---|---|
| 275 Myrtle Ave Jesup, GA | 2.0 | 2.0 | 1130 | $1,495 | $1.32 | 45d | 1 | 0.31mi |
| 277 Myrtle Ave Jesup, GA | 2.0 | 2.0 | 1130 | $1,495 | $1.32 | 45d | 1 | 0.31mi |
Listing history 20 events
-
2026-06-19days on market $135,250 Active 107 DOM
-
2026-06-18days on market $135,250 Active 106 DOM
-
2026-06-17days on market $135,250 Active 105 DOM
-
2026-06-16days on market $135,250 Active 104 DOM
-
2026-06-15days on market $135,250 Active 103 DOM
-
2026-06-14days on market $135,250 Active 101 DOM
-
2026-06-13days on market $135,250 Active 100 DOM
-
2026-06-10days on market $135,250 Active 98 DOM
-
2026-06-09days on market $135,250 Active 97 DOM
-
2026-06-08days on market $135,250 Active 96 DOM
-
2026-06-07days on market $135,250 Active 95 DOM
-
2026-06-05days on market $135,250 Active 92 DOM
-
2026-06-02days on market $135,250 Active 90 DOM
-
2026-06-01days on market $135,250 Active 89 DOM
-
2026-05-31days on market $135,250 Active 88 DOM
-
2026-05-30days on market $135,250 Active 87 DOM
-
2026-02-26$135,250 Active 658-char remark
Show marketing remark (658 chars)
Prime Commercial Potential at Major Highway Intersection, E Cherry and the Hwy 301/341 Bypass. Unlock the value of this high-visibility lot situated directly facing the traffic light at the intersection of E Cherry and the Hwy 301/341 Bypass. While currently zoned R3-Residential, this property is surrounded by established commercial developments, making it a premier candidate for rezoning. The existing structure has been vacant and requires significant renovation; however, the true value lies in the land and its strategic location. Sold As-Is, this is a "lot-value" play perfectly positioned for your next business venture. Bring your Offers.
-
2024-01-08soldstatus $116,000
-
2023-04-03soldstatus $125,000
-
2022-12-29soldstatus $750,000
ⓘ Source: listings_history table (triggers on properties + properties_extension) + one-shot
backfill from property_details.listing_events for pre-trigger history.
Tax reassessment forecast GA · Resets to sale price
- Current annual tax
- $882 · $74/mo
- Projected year-2 tax
- $1,244 · $104/mo
- Expected delta
- +$362/yr (+$30/mo · 41.0%)
ⓘ Screening estimate from a state-policy table — verify with the county assessor before closing.
Climate risk First Street
- Flood 3/10 Moderate FEMA zone X (unshaded) · 20% chance over 30 yrs
- Wildfire 5/10 Major
- Heat 9/10 Extreme 7 d/yr ≥109°F today · 19 d/yr by 30 yrs out
- Wind 8/10 Severe 99% chance of damaging wind over 30 yrs
- Air quality 2/10 Low 2 unhealthy d/yr today · 2 by 30 yrs out
Nearby sold comps map
Loading sold comps map…
Walkable amenities ~0.75 mi
Loading nearby amenities…
Taxation est. · year 1
- Rental income
- $17,940
- − Mortgage interest
- −$7,576
- − Property taxes
- −$882
- − Insurance
- −$676
- − Repairs & maintenance
- −$1,435
- − Management
- −$1,435
- − Depreciation
- −$3,935
- Taxable income
- $2,000
- Est. tax owed @ 24.0%
- −$480
- After-tax cash flow
- $3,623/yr
For passive investors: Depreciation is non-cash, so a rental often shows a tax loss while cash-flowing — sheltering income. Rental losses are passive: they offset passive income freely, and up to $25,000/yr can offset ordinary (W-2) income if you actively participate and your MAGI is under $100k (phasing out to $0 by $150k); unused losses carry forward. On sale, claimed depreciation is recaptured at up to 25%, and gains may owe capital-gains tax (a 1031 exchange can defer both). Figures are a year-1 estimate at your 24.0% rate — not tax advice; consult a CPA.
Schools (NCES district)
- District
- Wayne County
- NCES district ID
- 1305550
- Math proficiency
- 35% ▼ -4.00%
- Reading proficiency
- 35% ▼ -3.00%
- Median HH income
- $38,918
- Composite
- 29.3/100
- National rank
- #6554
- State rank
- #68 of 174 in GA
Livability — Jesup
- Score
- 69/100
- State rank
- #112
- US rank
- #8442
Category grades
Schools grade is shown separately in the Schools card above.
Census & demographics
- Census place
- Jesup, GA
- City population
- 1,050
- Population (ZIP)
- 6,931
Population outlook (Wayne County) Hauer SSP2
- Today (2025)
- 28,891 people
- By 2030
- 28,388 · -1.7%
- By 2040
- 27,396 · -5.2%
- By 2050
- 26,135 · -9.5%
- By 2075
- 23,253 · -19.5%
- By 2100
- 19,481 · -32.6%
Race, ethnicity, and origin ACS 2023
- Neighborhood character
- Predominantly White (73%)
- Race & ethnicity
- White 73% Black 20% Hispanic / Latino 5% Two or more races 5%
- Common ancestry
- Serbian 2% Portuguese 2% Slovak 1%
- Foreign-born
- 1% · Canada
- Languages at home
- 98% English-only · Spanish 1%
Political lean MEDSL · Wayne
- 2024 margin
- Solid R (+59.8) · D 20.0% · R 79.7%
- 2008→2024 swing
- -14.8pp toward R · 2008: -44.9pp · 2024: -59.8pp
- All cycles
- 2024: R+59.8 2020: R+57.1 2016: R+58.9 2012: R+48.3 2008: R+44.9
Not yet ingested
- Civics
- —
Market trends
- HPI YoY
- ▼ -12.73%
- Current HPI
- 229.8473
- Rent YoY
- —
- Metro
- —
- State GDP YoY
- ▲ 2.66%
- F500 in state
- 28
Industry mix (Fortune 500 HQ in GA)
| Industry | F500 HQs | Revenue |
|---|---|---|
| Paper / Packaging | 2 | $29B |
|
||
| Retail | 1 | $160B |
|
||
| Transportation / Logistics | 1 | $91B |
|
||
| Airlines | 1 | $62B |
|
||
| Consumer Goods | 1 | $47B |
|
||
| Utilities | 1 | $25B |
|
||
Price history
-82.0% since first listed4 events — show timeline
- 2026-02-26 Listed $135,250 HABR
- 2024-01-08 Sold (Public Records) $116,000 Public Records
- 2023-04-03 Sold (Public Records) $125,000 Public Records
- 2022-12-29 Sold (Public Records) $750,000 Public Records
Property tax history
+7.4%/yrLatest (2025): $882 · +38.8% YoY. Source: county tax records.
Cash-flow waterfall
monthlySold comps — $/sqft
last 12 mo · ≤1 miLoading sold comps…