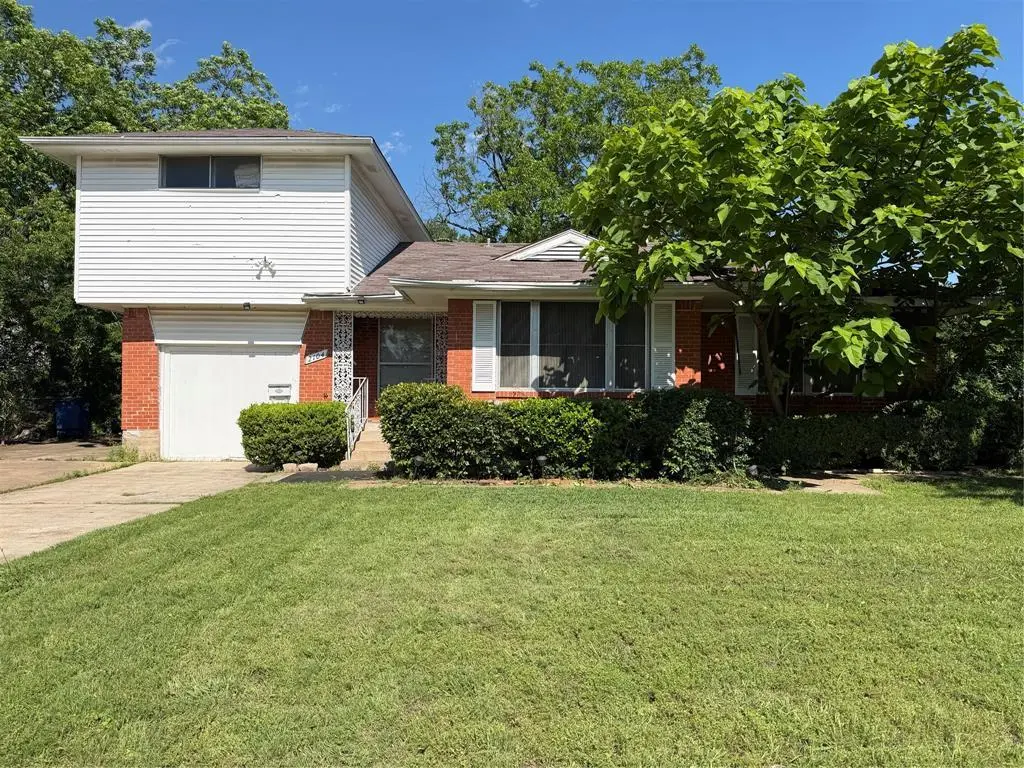
2104 Utica Dr · Dallas, TX
Flood risk 1/10 · Minimal
- FEMA flood zone
- X (unshaded)
- Chance of flooding over 30 yrs
- 0.0%
- Est. flood insurance / yr
- $507 – $1,088
Fire risk 3/10 · Minor
- Est. fire insurance / yr
- $1,222 – $2,270
Heat risk 7/10 · Major
- Hot days now (above 109°F)
- 7 days/yr
- Hot days in 30 yrs
- 24 days/yr
Wind risk 6/10 · Moderate
- Chance of severe wind over 30 yrs
- 27.0%
Air-quality risk 2/10 · Minimal
- Unhealthy air days now
- 1 days/yr
- Unhealthy air days in 30 yrs
- 2 days/yr
Risk factors via First Street. Map © Google.
Why this score? — see what drove the C- grade
The composite is a weighted blend of 9 inputs, each scored 0–100. Each bar is that input's sub-score; the figure is the points it added to the 100-point composite (weight × sub-score).
- ARV discount +15.0/15.0
- Cash flow +13.4/30.0
- 1% rule +6.1/10.0
- DSCR +4.0/10.0
- Livability +4.0/5.0
- Schools +2.8/10.0
- Condition / age +2.5/5.0
- Rent growth +2.4/5.0
- Appreciation +0.0/10.0
$194,000
🖨 Deal sheet 📄 Offer letter ✓ Due diligence
Listing remarks
Nestled on a, tree-lined street in the heart of Dallas, this single-family detached brick home offers the perfect canvas for your next project. 2104 Utica is a great find for DIY enthusiasts or savvy investors looking for a high-potential value-add opportunity.
Key facts
- Brick home
- 9,191 sq ft lot
- Built 1952
Tags
Property features AI
Finance
- Other: Listing possession at closing/funding; Roof noted as needing replacement (seller note suggests buyer may arrange replacement after closing)
- Financial info: Accepts Cash, Conventional, and FHA financing; No second mortgage indicated
- HOA & community: No association
Exterior
- Parking: Driveway and on-site parking; on-street parking available; additional parking and alley access
- Utilities: City water; City sewer; Electricity available; Individual gas meter; Individual water meter; Not in a municipal utility district
- Home design: Single family residence; Residential property; Two levels; Corner lot (subdivision: Piedmont)
- Construction: Brick construction; Composition roof; Brick/mortar foundation; Built in 1952
- Exterior features: Alley access; Concrete and curbs; Additional parking; Driveway; On-site parking; On-street parking
Interior
- Kitchen: Gas range; Built-in cabinets; Eat-in kitchen
- Bedrooms: 4 bedrooms (Primary bedroom on level 1; additional bedrooms on levels 1 and 2)
- Flooring: Carpet
- Bathrooms: 2 full bathrooms
- Heating & cooling: Central air; Natural gas heating
- Interior features: Eat-in kitchen; Two living areas; One dining area; 8 total rooms
- Laundry & utility: Gas water heater
Neighborhood map
What this means for you Summary
Snapshot
- This is a 3-bed/2.0-bath single-family listed at $194k.
Deal economics
- At list price, monthly cash flow is $4 ($53/yr) — positive.
- The deal already cash-flows at list — no discount required.
- Meets the 1% rule at list price ($2k rent vs $194k).
- Recommended offer: $191k (1.5% below list) — sets the bar for market timing.
- Cap rate 6.3% vs local median 2.3% in Dallas — top-decile yield for the area; either an underpriced asset or a hidden risk that comps aren't pricing in. Stress-test before assuming the spread holds.
Location & tenants
- Location reads 81/100 on livability (#24 in TX, #1,380 nationally) — a professional / high-income tenant draw. Strengths: amenities A+, commute A+, housing A+; Watch: crime F.
- Dallas ISD (urban): math 31% / reading 36% proficiency, ranked #559 of 826 in TX (top 68%) — families likely to look elsewhere, expect single-tenant / working-renter base with shorter leases; 83% free/reduced lunch — lower-income household profile, screen leases tightly.
- Zoned schools: San Jacinto El (math 27% / reading 27%, grade F, #2,791 of 4,322 statewide, top 68%, 411 students, 93% FRL).
- Market conditions: Rents soft (-0.4%/yr); 179 active listings in the ZIP; 8 comparable units currently listed for rent nearby; rentals at typical pace (median 25d on market — plan ~3-4 weeks tenant-placement turnaround); 12,577 units permitted in Dallas County in 2024 (6,829 in 5+ unit buildings).
- This rent runs 40% of the median local income ($64k/yr) — at the standard rent-burdened threshold; future hikes will face affordability resistance.
Forward outlook
- Local home prices are declining (-3.0%/yr); year-one equity from $1k of loan paydown is wiped out by about $6k of value loss. Plan a longer hold.
- Dallas County population projected at +35% by 2050 — long-run rental-demand tailwind backs the buy-and-hold thesis.
Negotiation context
- It's been on market 24 days — a 2% lower offer ($191k) is reasonable based on typical stale-listing flexibility.
Risks & watch-outs
- Watch-outs: property tax is 3.7% of price; built in 1952 — expect roof / HVAC / electrical / plumbing capex.
- Climate carrying-cost: major wind risk, 27% chance of damaging wind over 30y; extreme-heat days projected 7→24/yr by 2055 (HVAC capex compounding) — expect insurance premiums to compound above CPI over the hold.
Questions for the listing agent
- Built in 1952 — when were the roof, HVAC, electrical panel, plumbing, and water heater last replaced?
- Property tax is high relative to price — has the assessment been appealed recently, and will the sale trigger a re-assessment?
- Is there a deadline driving the sale (1031 exchange, divorce, estate, relocation)? That informs how much negotiation room exists.
- Crime grade is F in this area — have there been break-ins, vandalism, or insurance claims at this property in the last 3 years? What carrier currently insures it and at what premium?
- What's the average days-on-market for RENTAL listings here right now (not sales)? A rising rental-DOM trend means longer vacancies and softer asking-rent achievability than the comps imply.
- What's the recent tenant-quality profile in this submarket — average credit score on applications, eviction rate, late-payment / NSF rate, and stable-employment percentage? A property-management company in the area should have these aggregated.
- How much new for-sale + rental construction is in the pipeline within 1–3 miles? Heavy new supply typically softens prices + rents 12–24 months out; constrained supply supports both.
Investment metrics
- 1% rule
- 1.11% ✓
- Cap rate
- 6.32%
- Cash-on-cash
- 0.10%
- DSCR
- 1.00
- GRM
- 7.5
CMA / ARV
- ARV (median comp)
- $260,314
- List price
- $194,000
- Delta
- -25.47%
- Verdict
- UNDERPRICED
- Comps
- 20 within 1.0 mi
Show comp detail 12 sales within ~0.75 mi
| Address | Dist | Beds/Ba | Sqft | Sold | Price | $/sf | Match |
|---|---|---|---|---|---|---|---|
| 7812 Bruton Rd | 0.16mi | 4/3.0 (+1) | 1,776 (-6%) | 1mo | $269,900 | $152 | 73 |
| 1915 Gaylord Dr | 0.44mi | 4/2.0 (+1) | 2,001 (+6%) | 5mo | $299,000 | $149 | 60 |
| 7835 Tillman St | 0.32mi | 3/1.5 | 1,711 (-9%) | 11mo | $209,000 | $122 | 58 |
| 2417 Fonville Dr | 0.34mi | 4/2.0 (+1) | 1,629 (-14%) | 2mo | $260,000 | $160 | 55 |
| 2415 Pleasant Dr | 0.52mi | 3/2.5 | 1,789 (-5%) | 14mo | $275,000 | $154 | 53 |
| 8332 Foxwood Ln | 0.59mi | 3/2.0 | 2,064 (+9%) | 5mo | $250,000 | $121 | 52 |
| 2320 Prichard Ln | 0.28mi | 4/2.0 (+1) | 1,668 (-12%) | 18mo | $190,000 | $114 | 48 |
| 2225 Mack Ln | 0.71mi | 4/3.0 (+1) | 1,835 (-3%) | 10mo | $295,000 | $161 | 45 |
| 7934 Blossom Ln | 0.68mi | 3/2.5 | 1,761 (-7%) | 18mo | $430,000 | $244 | 40 |
| 8418 Foxwood Ln | 0.68mi | 3/2.0 | 1,638 (-13%) | 12mo | $299,000 | $183 | 36 |
| 1915 Houghton Rd | 0.60mi | 4/3.0 (+1) | 1,693 (-10%) | 12mo | $279,000 | $165 | 36 |
| 2055 Alhambra St | 0.59mi | 4/2.0 (+1) | 1,654 (-12%) | 17mo | $329,900 | $199 | 33 |
Match score weights: distance 35% · size 25% · config 20% · recency 20%. Top-matched comps best support the ARV.
Projected returns pro-forma
-3.0% appreciation · 0.0% rent growth · sell at horizon
- IRR
- -20.4%
- Equity multiple
- 0.31×
- Total profit
- $-37,222
- Equity at exit
- $28,926
- IRR
- -25.4%
- Equity multiple
- -0.02×
- Total profit
- $-55,445
- Equity at exit
- $16,774
Cash invested: $54,320 (down + closing). Projections, not guarantees.
Landlord ↔ Tenant lean methodology
- Overall (STATE)
- 87 Strongly Landlord-Friendly
- State Texas
- 87 Strongly Landlord-Friendly · R+5
- County
- — inherits STATE
- City
- — inherits STATE
ZIP-level market 75227
- Home prices YoY
- -30.9%
- Rents YoY
- -0.4%
- Active inventory
- 179
- Price-to-rent
- 7.5×
Monthly cashflow live
- Estimated rent
- $2,156 high interval (Pro) →
- Mortgage (P&I)
- −$1,017
- Tax from tax record
- −$601 /mo · $7,209/yr
- Insurance
- −$81
- HOA
- −$0
- Vacancy / Maint / Mgmt
- −$453
- Net cashflow
- $4
Break-even live
UW: 25.0% down · 7.5% · 30yr · 1.5% tax · 5.0% vac · 8.0% maint · 8.0% mgmt
Financing live
Cash to close
- Down payment
- $48,500
- Closing costs
- $5,820
- Reserves months
- —
- Total cash needed
- —
Loan-product check · same deal, 3 products live
Conventional
25% down · 7.5% · 30yr
- Down + closing
- —
- Monthly P&I
- —
- Monthly cashflow
- —
- DSCR
- —
- Eligible?
- —
Personal DTI + credit; lowest rate.
DSCR
20% down · 8.5% · 30yr
- Down + closing
- —
- Monthly P&I
- —
- Monthly cashflow
- —
- DSCR
- —
- Eligible?
- —
No personal income docs; deal must DSCR.
Hard money
10% down · 12.0% · 12mo
- Down + closing
- —
- Monthly P&I
- —
- Monthly cashflow
- —
- DSCR
- —
- Eligible?
- —
Short-term bridge; refi at stabilization.
Rent comps 8 comps
| Address | Beds | Baths | Sqft | Rent | $/sqft | DOM | Units | Dist |
|---|---|---|---|---|---|---|---|---|
| 2104 Hillburn Dr Dallas, TX | 3.0 | 1.5 | 1324 | $1,850 | $1.40 | 15d | 1 | 0.37mi |
| 7632 Livvie Meador Ln Dallas, TX | 4.0 | 2.0 | 1719 | $2,300 | $1.34 | 43d | 1 | 0.44mi |
| 2540 Prichard Ln Dallas, TX | 3.0 | 2.0 | 1888 | $2,475 | $1.31 | 24d | 1 | 0.47mi |
| 8609 Jennie Lee Ln Dallas, TX | 3.0 | 2.0 | 1863 | $2,300 | $1.23 | 5d | 1 | 0.81mi |
| 7323 Daingerfield Dr Dallas, TX | 4.0 | 2.0 | 1996 | $2,950 | $1.48 | 24d | 1 | 0.89mi |
| 8534 Bearden Ln Dallas, TX | 3.0 | 2.0 | 1332 | $1,600 | $1.20 | 24d | 1 | 0.91mi |
| 1201 Rose Garden Ave Dallas, TX | 3.0 | 2.0 | 1472 | $1,750 | $1.19 | 43d | 1 | 1.13mi |
| 3331 Urban Ave Dallas, TX | 4.0 | 2.0 | 1827 | $2,950 | $1.61 | 43d | 1 | 1.35mi |
Listing history 3 events
-
2026-04-28$194,000 Active 261-char remark
-
2007-07-13soldstatus
-
1992-06-24soldstatus
ⓘ Source: listings_history table (triggers on properties + properties_extension) + one-shot
backfill from property_details.listing_events for pre-trigger history.
Tax reassessment forecast TX · Resets to sale price
- Current annual tax
- $7,209 · $601/mo
- Projected year-2 tax
- $7,209 · $601/mo
- Expected delta
- $0/yr ($0/mo · 0.0%)
ⓘ Screening estimate from a state-policy table — verify with the county assessor before closing.
Climate risk First Street
- Flood 1/10 Low FEMA zone X (unshaded) · 0% chance over 30 yrs
- Wildfire 3/10 Moderate
- Heat 7/10 Severe 7 d/yr ≥109°F today · 24 d/yr by 30 yrs out
- Wind 6/10 Major 27% chance of damaging wind over 30 yrs
- Air quality 2/10 Low 1 unhealthy d/yr today · 2 by 30 yrs out
Nearby sold comps map
Loading sold comps map…
Walkable amenities ~0.75 mi
Loading nearby amenities…
Taxation est. · year 1
- Rental income
- $25,873
- − Mortgage interest
- −$10,867
- − Property taxes
- −$7,209
- − Insurance
- −$970
- − Repairs & maintenance
- −$2,070
- − Management
- −$2,070
- − Depreciation
- −$5,644
- Taxable loss
- −$2,956
- Est. tax savings @ 24.0%
- +$709
- After-tax cash flow
- $762/yr
For passive investors: Depreciation is non-cash, so a rental often shows a tax loss while cash-flowing — sheltering income. Rental losses are passive: they offset passive income freely, and up to $25,000/yr can offset ordinary (W-2) income if you actively participate and your MAGI is under $100k (phasing out to $0 by $150k); unused losses carry forward. On sale, claimed depreciation is recaptured at up to 25%, and gains may owe capital-gains tax (a 1031 exchange can defer both). Figures are a year-1 estimate at your 24.0% rate — not tax advice; consult a CPA.
Schools (NCES district)
- District
- Dallas ISD
- NCES district ID
- 4816230
- Math proficiency
- 31% ▼ -16.00%
- Reading proficiency
- 36% ▼ -4.00%
- Median HH income
- $42,881
- Composite
- 28.41/100
- National rank
- #6763
- State rank
- #559 of 826 in TX
Livability — Dallas
- Score
- 81/100
- State rank
- #24
- US rank
- #1380
Category grades
Schools grade is shown separately in the Schools card above.
Census & demographics
- Census place
- Dallas, TX
- County
- Dallas County · 2,612,404 people
- City population
- 1,168,437
- Metro
- Dallas-Fort Worth-Arlington, TX
- Population (ZIP)
- 58,319
- Household income
- $64,008
- Rent vs Own
- Severe rent burden
- 1679.0
Population outlook (Dallas County) Hauer SSP2
- Today (2025)
- 2,979,839 people
- By 2030
- 3,191,823 · +7.1%
- By 2040
- 3,619,611 · +21.5%
- By 2050
- 4,026,915 · +35.1%
- By 2075
- 4,957,073 · +66.4%
- By 2100
- 5,508,725 · +84.9%
Race, ethnicity, and origin ACS 2023
- Neighborhood character
- Majority Hispanic (62%)
- Race & ethnicity
- Hispanic / Latino 62% Two or more races 35% Black 28% White 8%
- Hispanic origin (detail)
- Mexican 56%
- Foreign-born
- 27% · Canada, Vietnam
- Languages at home
- 44% English-only · Spanish 55%
Political lean MEDSL · Dallas
- 2024 margin
- Strong D (+22.2) · D 60.2% · R 38.0% · Other 1.8%
- 2008→2024 swing
- +6.9pp toward D · 2008: 15.3pp · 2024: 22.2pp
- All cycles
- 2024: D+22.2 2020: D+31.6 2016: D+26.2 2012: D+15.4 2008: D+15.3
Not yet ingested
- Civics
- —
Market trends
- HPI YoY
- ▼ -148.56%
- Current HPI
- 332.3303
- Rent YoY
- ▼ -0.36%
- Metro
- Dallas-Fort Worth-Arlington, TX
- State GDP YoY
- ▲ 3.95%
- F500 in state
- 110
Industry mix (Fortune 500 HQ in TX)
| Industry | F500 HQs | Revenue |
|---|---|---|
| Energy | 16 | $1,198B |
|
||
| Technology | 5 | $198B |
|
||
| Engineering / Construction | 4 | $72B |
|
||
| Energy Services | 3 | $60B |
|
||
| Utilities | 3 | $41B |
|
||
| Healthcare | 2 | $330B |
|
||
Price history
4 events — show timeline
- 2026-05-22 Pending — NTREIS
- 2026-04-28 Listed $194,000 NTREIS
- 2007-07-13 Sold (Public Records) — Public Records
- 1992-06-24 Sold (Public Records) — Public Records
Property tax history
+8.2%/yrLatest (2025): $7,209 · -0.4% YoY. Source: county tax records.
Cash-flow waterfall
monthlySold comps — $/sqft
last 12 mo · ≤1 miLoading sold comps…