932 1st St · Brooklyn Park, MD
Flood risk 1/10 · Minimal
- FEMA flood zone
- X (unshaded)
- Chance of flooding over 30 yrs
- 0.0%
- Est. flood insurance / yr
- $473 – $860
Fire risk 1/10 · Minimal
- Est. fire insurance / yr
- $755 – $1,403
Heat risk 8/10 · Major
- Hot days now (above 103°F)
- 7 days/yr
- Hot days in 30 yrs
- 15 days/yr
Wind risk 6/10 · Moderate
- Chance of severe wind over 30 yrs
- 27.0%
Air-quality risk 4/10 · Minor
- Unhealthy air days now
- 5 days/yr
- Unhealthy air days in 30 yrs
- 7 days/yr
Risk factors via First Street. Map © Google.
Why this score? — see what drove the B+ grade
The composite is a weighted blend of 9 inputs, each scored 0–100. Each bar is that input's sub-score; the figure is the points it added to the 100-point composite (weight × sub-score).
- Cash flow +30.0/30.0
- ARV discount +15.0/15.0
- DSCR +10.0/10.0
- 1% rule +9.4/10.0
- Livability +3.9/5.0
- Rent growth +3.5/5.0
- Schools +2.9/10.0
- Condition / age +2.5/5.0
- Appreciation +0.0/10.0
$150,000
🖨 Deal sheet 📄 Offer letter ✓ Due diligence
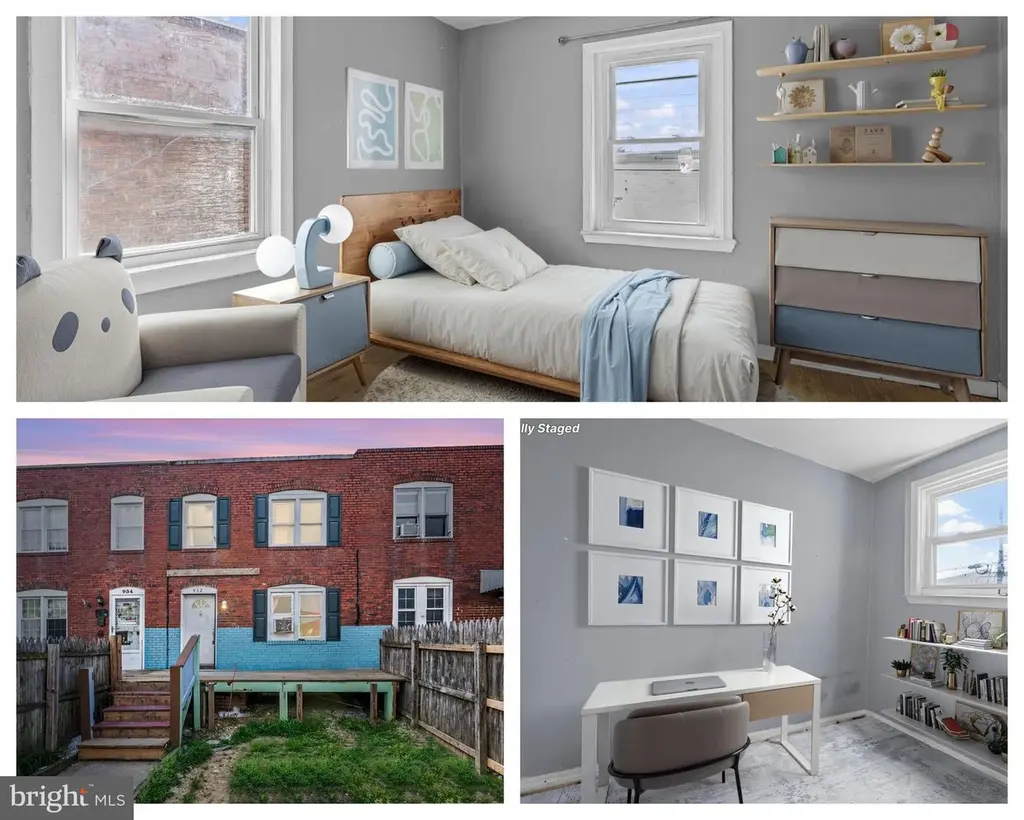
Listing remarks
You have found one of the best deals in all of Anne Arundel County. This 3 level townhome features 5 bedrooms (3 on the top floor and 2 on the main floor) Kitchen is in the basement and parking is on the street and out back. The home is being sold AS-IS but is ready for your finishing touches.
Key facts
- Built 1948
- Listed 15 days
Property features AI
Exterior
- Parking: Off-street parking
- Utilities: Public water; Public sewer
- Home design: Interior townhouse/rowhouse; Ownership is fee simple
- Construction: Brick construction; Foundation: Other/unspecified; Finished area above grade and below grade reported (estimated); Total below-grade area reported
- Exterior features: Not in a federal flood zone; Above-grade and below-grade structures noted
Interior
- Bedrooms: Three bedrooms on the first upper level; Two bedrooms on the first lower level
- Bathrooms: Two full bathrooms total; One full bathroom on the main level; One full bathroom on the first upper level
- Heating & cooling: Heating: Other/unspecified; Cooling: Other/unspecified; Hot water: Other/unspecified
- Interior features: Basement included (finished area present); Living area reported as estimated
Neighborhood map
What this means for you Summary
Snapshot
- This is a 5-bed/2.0-bath townhouse listed at $150k.
Deal economics
- At list price, monthly cash flow is $696 ($8k/yr) — positive.
- The deal already cash-flows at list — no discount required.
- Meets the 1% rule at list price ($2k rent vs $150k).
- Recommended offer: $148k (1.5% below list) — sets the bar for market timing.
- Cap rate 11.9% vs local median 4.4% in Brooklyn Park — top-decile yield for the area; either an underpriced asset or a hidden risk that comps aren't pricing in. Stress-test before assuming the spread holds.
Location & tenants
- Location reads 77/100 on livability (#81 in MD, #3,091 nationally) — a middle-class / working-renter tenant base. Strengths: commute A+, housing A+, health & safety A+; Watch: schools C-, crime F, amenities F.
- Anne Arundel County Public Schools (suburban): math 20% / reading 37% proficiency, ranked #10 of 24 in MD (top 42%) — low school quality limits family demand, transient renter base, plan for 1-2y turnover.
- Market conditions: Rents rising fast (+4.1%/yr); 165 active listings in the ZIP; 2 comparable units currently listed for rent nearby; 1,303 units permitted in Anne Arundel County in 2024 (299 in 5+ unit buildings).
- At $2,154/mo this rent would consume 48% of the median local household income ($54k/yr) (locally 1440% of renters already pay >50% of income on rent) — very limited rent-growth headroom before tenants either downsize or default.
Forward outlook
- Local home prices are declining (-3.0%/yr); year-one equity from $1k of loan paydown is wiped out by about $4k of value loss. Plan a longer hold.
- Anne Arundel County population projected at +17% by 2050 — long-run rental-demand tailwind backs the buy-and-hold thesis.
- At projected returns (-3.0% appreciation + 4.1% rent growth), your $42k cash investment doubles in ~6 years — after that, you're playing with house money.
Negotiation context
- It's been on market 16 days — a 2% lower offer ($148k) is reasonable based on typical stale-listing flexibility.
- 7 sale attempts since 21y ago with the ask held roughly flat each time — persistent listings suggest the price (not the market) is what's stuck; bring a comps-based counter.
- Current owner paid $25k; list at $150k implies a 500% gain — meaningful room to come down on a strong offer.
Risks & watch-outs
- Watch-outs: built in 1948 — expect roof / HVAC / electrical / plumbing capex.
- Climate carrying-cost: major wind risk, 27% chance of damaging wind over 30y; extreme-heat days projected 7→15/yr by 2055 (HVAC capex compounding) — expect insurance premiums to compound above CPI over the hold.
Questions for the listing agent
- Built in 1948 — when were the roof, HVAC, electrical panel, plumbing, and water heater last replaced?
- Is there a deadline driving the sale (1031 exchange, divorce, estate, relocation)? That informs how much negotiation room exists.
- Crime grade is F in this area — have there been break-ins, vandalism, or insurance claims at this property in the last 3 years? What carrier currently insures it and at what premium?
- What's the average days-on-market for RENTAL listings here right now (not sales)? A rising rental-DOM trend means longer vacancies and softer asking-rent achievability than the comps imply.
- What's the recent tenant-quality profile in this submarket — average credit score on applications, eviction rate, late-payment / NSF rate, and stable-employment percentage? A property-management company in the area should have these aggregated.
- How much new for-sale + rental construction is in the pipeline within 1–3 miles? Heavy new supply typically softens prices + rents 12–24 months out; constrained supply supports both.
Investment metrics
- 1% rule
- 1.44% ✓
- Cap rate
- 11.86%
- Cash-on-cash
- 19.89%
- DSCR
- 1.88
- GRM
- 5.8
CMA / ARV
- ARV (median comp)
- $215,296
- List price
- $150,000
- Delta
- -30.33%
- Verdict
- UNDERPRICED
- Comps
- 20 within 1.0 mi
Show comp detail 10 sales within ~0.75 mi
| Address | Dist | Beds/Ba | Sqft | Sold | Price | $/sf | Match |
|---|---|---|---|---|---|---|---|
| 5201 Brookwood Rd | 0.22mi | 5/3.0 | 1,320 (+1%) | 0mo | $165,000 | $125 | 84 |
| 920 1st St | 0.02mi | 4/2.0 (-1) | 1,304 (0%) | 17mo | $160,000 | $123 | 79 |
| 5318 Brookwood | 0.28mi | 4/2.0 (-1) | 1,254 (-4%) | 18mo | $215,000 | $171 | 60 |
| 201 W Riverview Rd | 0.60mi | 4/2.0 (-1) | 1,240 (-5%) | 14mo | $265,000 | $214 | 47 |
| 223 Grove Park Rd | 0.60mi | 5/2.5 | 1,488 (+14%) | 9mo | $258,000 | $173 | 39 |
| 4041 6th St | 0.66mi | 4/2.0 (-1) | 1,109 (-15%) | 5mo | $165,000 | $149 | 35 |
| 205 Arundel Rd W | 0.62mi | 4/2.5 (-1) | 1,216 (-7%) | 22mo | $270,000 | $222 | 35 |
| 412 Seward Ave | 0.42mi | 4/1.5 (-1) | 1,140 (-13%) | 22mo | $250,000 | $219 | 34 |
| 4137 Doris Ave | 0.52mi | 4/2.5 (-1) | 1,488 (+14%) | 17mo | $242,000 | $163 | 31 |
| 131 W Meadow Rd | 0.69mi | 4/2.0 (-1) | 1,440 (+10%) | 22mo | $249,000 | $173 | 27 |
Match score weights: distance 35% · size 25% · config 20% · recency 20%. Top-matched comps best support the ARV.
Projected returns pro-forma
-3.0% appreciation · 4.08% rent growth · sell at horizon
- IRR
- 13.2%
- Equity multiple
- 1.53×
- Total profit
- $22,401
- Equity at exit
- $22,365
- IRR
- 22.9%
- Equity multiple
- 3.06×
- Total profit
- $86,563
- Equity at exit
- $12,969
Cash invested: $42,000 (down + closing). Projections, not guarantees.
Landlord ↔ Tenant lean methodology
- Overall (STATE)
- 27 Tenant-Leaning
- State Maryland
- 27 Tenant-Leaning · D+14
- County
- — inherits STATE
- City
- — inherits STATE
ZIP-level market 21225
- Home prices YoY
- -31.9%
- Rents YoY
- 4.1%
- Active inventory
- 165
- Price-to-rent
- 5.8×
Monthly cashflow live
- Estimated rent
- $2,154 medium interval (Pro) →
- Mortgage (P&I)
- −$787
- Tax from tax record
- −$156 /mo · $1,875/yr
- Insurance
- −$62
- HOA
- −$0
- Vacancy / Maint / Mgmt
- −$452
- Net cashflow
- $696
Break-even live
UW: 25.0% down · 7.5% · 30yr · 1.5% tax · 5.0% vac · 8.0% maint · 8.0% mgmt
Financing live
Cash to close
- Down payment
- $37,500
- Closing costs
- $4,500
- Reserves months
- —
- Total cash needed
- —
Loan-product check · same deal, 3 products live
Conventional
25% down · 7.5% · 30yr
- Down + closing
- —
- Monthly P&I
- —
- Monthly cashflow
- —
- DSCR
- —
- Eligible?
- —
Personal DTI + credit; lowest rate.
DSCR
20% down · 8.5% · 30yr
- Down + closing
- —
- Monthly P&I
- —
- Monthly cashflow
- —
- DSCR
- —
- Eligible?
- —
No personal income docs; deal must DSCR.
Hard money
10% down · 12.0% · 12mo
- Down + closing
- —
- Monthly P&I
- —
- Monthly cashflow
- —
- DSCR
- —
- Eligible?
- —
Short-term bridge; refi at stabilization.
Rent comps 2 comps
| Address | Beds | Baths | Sqft | Rent | $/sqft | DOM | Units | Dist |
|---|---|---|---|---|---|---|---|---|
| 3544 4th St Brooklyn, MD | 4.0 | 2.5 | 1800 | $1,940 | $1.08 | 24d | 1 | 1.00mi |
| 4216 Prudence St Curtis Bay, MD | 4.0 | 3.0 | 1116 | $2,100 | $1.88 | 43d | 1 | 1.10mi |
Listing history 21 events
-
2026-06-04days on market $150,000 Active 16 DOM
-
2026-06-03days on market $150,000 Active 15 DOM
-
2026-06-02status $150,000 Active 14 DOM
-
2026-05-07status Pending 294-char remark
-
2026-04-23$150,000 Active 294-char remark
-
2026-04-23historical
-
2026-04-14status Active
-
2026-03-16status Pending
-
2026-03-06status Active
-
2026-03-06$150,000 Active
-
2026-03-06historical
-
2026-02-14status Pending
-
2026-01-31$150,000 Active
-
2026-01-30historical
-
2016-10-20soldstatus $25,000
-
2005-12-27soldstatus $118,000
-
2005-11-23soldstatus $118,000
-
2005-11-02historical
-
2005-10-27$124,900
-
2003-10-21soldstatus $55,000
-
1987-01-13soldstatus $55,000
ⓘ Source: listings_history table (triggers on properties + properties_extension) + one-shot
backfill from property_details.listing_events for pre-trigger history.
Tax reassessment forecast MD · Partial reset (capped growth)
- Current annual tax
- $1,875 · $156/mo
- Projected year-2 tax
- $1,875 · $156/mo
- Expected delta
- $0/yr ($0/mo · 0.0%)
ⓘ Screening estimate from a state-policy table — verify with the county assessor before closing.
Climate risk First Street
- Flood 1/10 Low FEMA zone X (unshaded) · 0% chance over 30 yrs
- Wildfire 1/10 Low
- Heat 8/10 Severe 7 d/yr ≥103°F today · 15 d/yr by 30 yrs out
- Wind 6/10 Major 27% chance of damaging wind over 30 yrs
- Air quality 4/10 Moderate 5 unhealthy d/yr today · 7 by 30 yrs out
Nearby sold comps map
Loading sold comps map…
Walkable amenities ~0.75 mi
Loading nearby amenities…
Taxation est. · year 1
- Rental income
- $25,843
- − Mortgage interest
- −$8,402
- − Property taxes
- −$1,875
- − Insurance
- −$750
- − Repairs & maintenance
- −$2,067
- − Management
- −$2,067
- − Depreciation
- −$4,364
- Taxable income
- $6,318
- Est. tax owed @ 24.0%
- −$1,516
- After-tax cash flow
- $6,836/yr
For passive investors: Depreciation is non-cash, so a rental often shows a tax loss while cash-flowing — sheltering income. Rental losses are passive: they offset passive income freely, and up to $25,000/yr can offset ordinary (W-2) income if you actively participate and your MAGI is under $100k (phasing out to $0 by $150k); unused losses carry forward. On sale, claimed depreciation is recaptured at up to 25%, and gains may owe capital-gains tax (a 1031 exchange can defer both). Figures are a year-1 estimate at your 24.0% rate — not tax advice; consult a CPA.
Schools (NCES district)
- District
- Anne Arundel County Public Schools
- NCES district ID
- 2400060
- Math proficiency
- 20% ▼ -21.00%
- Reading proficiency
- 37% ▼ -13.00%
- Median HH income
- $87,880
- Composite
- 28.52/100
- National rank
- #6733
- State rank
- #10 of 24 in MD
Livability — Brooklyn Park
- Score
- 77/100
- State rank
- #81
- US rank
- #3091
Category grades
Schools grade is shown separately in the Schools card above.
Census & demographics
- Census place
- Brooklyn Park, MD
- County
- Anne Arundel County · 535,653 people
- City population
- 34,062
- Metro
- Baltimore-Columbia-Towson, MD
- Population (ZIP)
- 34,062
- Household income
- $54,020
- Rent vs Own
- Severe rent burden
- 1440.0
Population outlook (Anne Arundel County) Hauer SSP2
- Today (2025)
- 617,384 people
- By 2030
- 642,094 · +4.0%
- By 2040
- 686,621 · +11.2%
- By 2050
- 723,031 · +17.1%
- By 2075
- 809,346 · +31.1%
- By 2100
- 837,658 · +35.7%
Race, ethnicity, and origin ACS 2023
- Neighborhood character
- Diverse neighborhood (Simpson 0.68)
- Race & ethnicity
- Black 42% White 32% Hispanic / Latino 20% Two or more races 8% Native American 3% Asian 2%
- Hispanic origin (detail)
- Mexican 5% Puerto Rican 1%
- Common ancestry
- Romanian 2% Lithuanian 1% Iranian 1%
- Foreign-born
- 12% · Canada, China
- Languages at home
- 81% English-only · Spanish 16% Other Indo-European 1% French/Haitian/Cajun 1%
Political lean MEDSL · Anne Arundel
- 2024 margin
- D (+13.9) · D 55.7% · R 41.7% · Other 2.6%
- 2008→2024 swing
- +15.7pp toward D · 2008: -1.8pp · 2024: 13.9pp
- All cycles
- 2024: D+13.9 2020: D+14.5 2016: D+0.7 2012: R+0.9 2008: R+1.8
Not yet ingested
- Civics
- —
Market trends
- HPI YoY
- ▼ -119.44%
- Current HPI
- 254.5089
- Rent YoY
- ▲ 4.08%
- Metro
- Baltimore-Columbia-Towson, MD
- State GDP YoY
- ▲ 2.97%
- F500 in state
- 12
Industry mix (Fortune 500 HQ in MD)
| Industry | F500 HQs | Revenue |
|---|---|---|
| Aerospace / Defense | 1 | $71B |
|
||
| Utilities | 1 | $25B |
|
||
| Hotels | 1 | $24B |
|
||
| Consumer Goods | 1 | $7B |
|
||
| Real Estate | 1 | $6B |
|
||
| Chemicals | 1 | $2B |
|
||
Price history
+172.7% since first listed20 events — show timeline
- 2026-06-04 Listing Removed — BRIGHT MLS
- 2026-06-02 Relisted — BRIGHT MLS
- 2026-05-07 Pending — BRIGHT MLS
- 2026-04-23 Listing Removed — BRIGHT MLS
- 2026-04-23 Listed $150,000 BRIGHT MLS
- 2026-04-14 Relisted — BRIGHT MLS
- 2026-03-16 Pending — BRIGHT MLS
- 2026-03-06 Relisted — BRIGHT MLS
- 2026-03-06 Listing Removed — BRIGHT MLS
- 2026-03-06 Listed $150,000 BRIGHT MLS
- 2026-02-14 Pending — BRIGHT MLS
- 2026-01-31 Listed $150,000 BRIGHT MLS
- 2026-01-30 Coming Soon — BRIGHT MLS
- 2016-10-20 Sold (Public Records) $25,000 Public Records
- 2005-12-27 Sold (Public Records) $118,000 Public Records
- 2005-11-23 Sold (MLS) $118,000 MRIS
- 2005-11-02 Delisted — MRIS
- 2005-10-27 Listed $124,900 MRIS
- 2003-10-21 Sold (Public Records) $55,000 Public Records
- 1987-01-13 Sold (Public Records) $55,000 Public Records
Property tax history
+5.9%/yrLatest (2025): $1,875 · +5.4% YoY. Source: county tax records.
Cash-flow waterfall
monthlySold comps — $/sqft
last 12 mo · ≤1 miLoading sold comps…