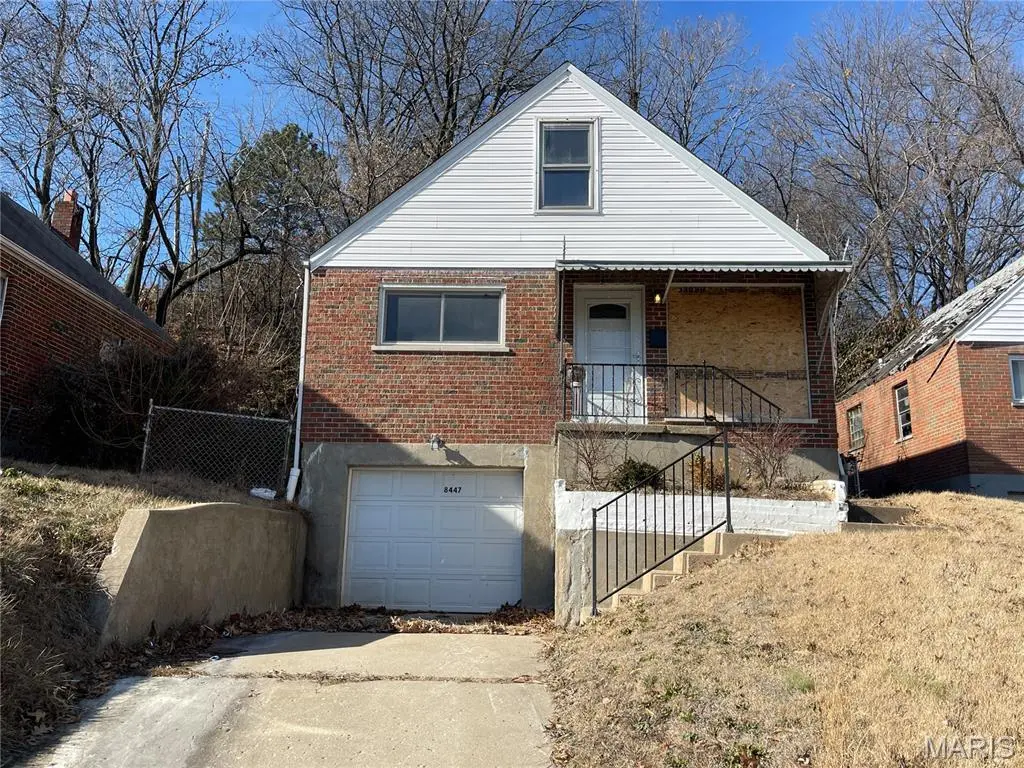
8447 Concord Pl · St. Louis, MO
Flood risk 1/10 · Minimal
- FEMA flood zone
- X (unshaded)
- Chance of flooding over 30 yrs
- 0.0%
- Est. flood insurance / yr
- $473 – $860
Fire risk 1/10 · Minimal
- Est. fire insurance / yr
- $1,054 – $1,958
Heat risk 5/10 · Moderate
- Hot days now (above 107°F)
- 7 days/yr
- Hot days in 30 yrs
- 21 days/yr
Wind risk 2/10 · Minimal
- Chance of severe wind over 30 yrs
- 1.0%
Air-quality risk 4/10 · Minor
- Unhealthy air days now
- 5 days/yr
- Unhealthy air days in 30 yrs
- 6 days/yr
Risk factors via First Street. Map © Google.
Why this score? — see what drove the B- grade
The composite is a weighted blend of 9 inputs, each scored 0–100. Each bar is that input's sub-score; the figure is the points it added to the 100-point composite (weight × sub-score).
- Cash flow +30.0/30.0
- DSCR +10.0/10.0
- 1% rule +9.5/10.0
- ARV discount +7.5/15.0
- Rent growth +2.5/5.0
- Livability +2.5/5.0
- Condition / age +2.5/5.0
- Schools +1.2/10.0
- Appreciation +0.0/10.0
$69,900
🖨 Deal sheet (PDF) 📄 Offer letter ✓ Due diligence
Listing remarks MLS
Calling all investors!!! Check out this rent-ready/move-in ready charmer in Baden. This home boasts two spacious bedrooms and a full bathroom, perfect for comfortable living. The property has been fully renovated and features a host of modern amenities. The kitchen is equipped with top-of-the-line stainless steel appliances, ready to inspire your culinary adventures. The home also features new windows that allow for an abundance of natural light, enhancing the overall ambiance. The luxury vinyl flooring adds a touch of elegance and is easy to maintain. For your convenience, the property includes garage parking, ensuring your vehicle is always safe and secure. The attic and basement offer lots of additional storage space. Seller financing is available. Please text the listing agent for term details.
Key facts
- Fully renovated
- Natural light
- Modern amenities
Tags
Neighborhood map
What this means for you Summary
Snapshot
- This is a 2-bed/1.0-bath single-family listed at $70k.
Deal economics
- At list price, monthly cash flow is $378 ($5k/yr) — positive.
- The deal already cash-flows at list — no discount required.
- Meets the 1% rule at list price ($1k rent vs $70k).
- Recommended offer: $66k (6.0% below list) — sets the bar for market timing.
- Cap rate 12.8% vs local median 5.0% in St. Louis — top-decile yield for the area; either an underpriced asset or a hidden risk that comps aren't pricing in. Stress-test before assuming the spread holds.
Location & tenants
- Location reads: area grade B — affects rentability + tenant quality, not the cash-flow math above.
- St. Louis City (urban): math 10% / reading 18% proficiency, ranked #312 of 324 in MO (top 96%) — low school quality limits family demand, transient renter base, plan for 1-2y turnover; 80% free/reduced lunch — lower-income household profile, screen leases tightly.
- Zoned schools: Nahed Chapman New American Aca (math 2% / reading 2%, grade F, #1,099 of 1,115 statewide, top 100%, 335 students, 99% FRL); Gateway Middle (math 0% / reading 8%, grade F, #389 of 391 statewide, top 100%, 506 students, 99% FRL); Vashon High (math 2% / reading 2%, grade F, #520 of 521 statewide, top 100%, 568 students, 100% FRL) — zoned schools average 99% FRL vs 80% district-wide (19 pts higher); higher-poverty schools than district average — tighter screening recommended.
- Market conditions: 57 active listings in the ZIP; 31 comparable units currently listed for rent nearby; rentals at typical pace (median 25d on market — plan ~3-4 weeks tenant-placement turnaround); lower-income renter base — watch delinquency; 294 units permitted in St. Louis city in 2024 (227 in 5+ unit buildings).
Forward outlook
- Local home prices are declining (-3.0%/yr); year-one equity from $483 of loan paydown is wiped out by about $2k of value loss. Plan a longer hold.
- St. Louis County population projected to shrink 6% by 2050 — rents likely to lag national; underwrite the cash flow, not the appreciation.
- At projected returns (-3.0% appreciation + 3.0% rent growth), your $20k cash investment doubles in ~6 years — after that, you're playing with house money.
Negotiation context
- It's been on market 67 days — a 6% lower offer ($66k) is reasonable based on typical stale-listing flexibility.
- 8 sale attempts since 3y ago; this cycle's ask has dropped $10k (13%) from the opening price — seller is motivated, your offer sets the floor, not the list.
Risks & watch-outs
- Watch-outs: built in 1955 — expect roof / HVAC / electrical / plumbing capex.
- Climate carrying-cost: extreme-heat days projected 7→21/yr by 2055 (HVAC capex compounding) — expect insurance premiums to compound above CPI over the hold.
Questions for the listing agent
- It's been on market 67 days. Have you received any prior offers? Is the seller open to a 6% concession, seller financing, or rate buy-down credit?
- Built in 1955 — when were the roof, HVAC, electrical panel, plumbing, and water heater last replaced?
- Why hasn't it sold? Are there any deal-killer items the seller is aware of (foundation, flood, title, zoning, code violations)?
- Is there a deadline driving the sale (1031 exchange, divorce, estate, relocation)? That informs how much negotiation room exists.
- What's the average days-on-market for RENTAL listings here right now (not sales)? A rising rental-DOM trend means longer vacancies and softer asking-rent achievability than the comps imply.
- What's the recent tenant-quality profile in this submarket — average credit score on applications, eviction rate, late-payment / NSF rate, and stable-employment percentage? A property-management company in the area should have these aggregated.
- How much new for-sale + rental construction is in the pipeline within 1–3 miles? Heavy new supply typically softens prices + rents 12–24 months out; constrained supply supports both.
Investment metrics
- 1% rule
- 1.45% ✓
- Cap rate
- 12.77%
- Cash-on-cash
- 23.15%
- DSCR
- 2.03
- GRM
- 5.8
CMA / ARV
- ARV (median comp)
- $40,305
- List price
- $69,900
- Delta
- 73.43%
- Verdict
- OVERPRICED
- Comps
- 20 within 1.0 mi
Show comp detail 12 sales within ~0.75 mi
| Address | Dist | Beds/Ba | Sqft | Sold | Price | $/sf | Match |
|---|---|---|---|---|---|---|---|
| 853 Nassau Dr | 0.47mi | 2/1.0 | 768 (0%) | 5mo | $39,000 | $51 | 74 |
| 949 Canaan Ave | 0.34mi | 1/1.0 (-1) | 800 (+4%) | 4mo | $47,625 | $60 | 69 |
| 934 Nassau Dr | 0.49mi | 2/1.0 | 768 (0%) | 15mo | $69,900 | $91 | 65 |
| 825 Canaan Ave | 0.28mi | 2/1.0 | 816 (+6%) | 16mo | $15,000 | $18 | 63 |
| 963 Canaan Ave | 0.37mi | 2/2.0 | 816 (+6%) | 7mo | $29,750 | $36 | 62 |
| 1256 Gimblin St | 0.39mi | 3/1.0 (+1) | 800 (+4%) | 12mo | $67,000 | $84 | 60 |
| 925 Riverview Blvd | 0.58mi | 2/1.0 | 830 (+8%) | 0mo | $93,000 | $112 | 59 |
| 8572 Oriole Ave | 0.54mi | 3/1.0 (+1) | 768 (0%) | 15mo | $34,999 | $46 | 58 |
| 820 Elias Ave | 0.31mi | 3/2.0 (+1) | 832 (+8%) | 8mo | $47,500 | $57 | 56 |
| 1266 Lynfield Pl | 0.43mi | 2/1.0 | 840 (+9%) | 18mo | $52,000 | $62 | 49 |
| 1239 Peggy Ct | 0.40mi | 3/2.0 (+1) | 876 (+14%) | 10mo | $102,900 | $117 | 40 |
| 8536 Partridge Ave | 0.64mi | 2/1.0 | 868 (+13%) | 11mo | $119,900 | $138 | 39 |
Match score weights: distance 35% · size 25% · config 20% · recency 20%. Top-matched comps best support the ARV.
Projected returns pro-forma
-3.0% appreciation · 3.0% rent growth · sell at horizon
- IRR
- 16.1%
- Equity multiple
- 1.65×
- Total profit
- $12,696
- Equity at exit
- $10,422
- IRR
- 24.7%
- Equity multiple
- 3.14×
- Total profit
- $41,927
- Equity at exit
- $6,044
Cash invested: $19,572 (down + closing). Projections, not guarantees.
Landlord ↔ Tenant lean methodology
- Overall (STATE)
- 81 Strongly Landlord-Friendly
- State Missouri
- 81 Strongly Landlord-Friendly · R+10
- County
- — inherits STATE
- City
- — inherits STATE
ZIP-level market 63147
- Home prices YoY
- -31.4%
- Active inventory
- 57
- Price-to-rent
- 5.8×
Monthly cashflow live
- Estimated rent
- $1,012 high interval (Pro) →
- Mortgage (P&I)
- −$367
- Tax from tax record
- −$26 /mo · $318/yr
- Insurance
- −$29
- HOA
- −$0
- Vacancy / Maint / Mgmt
- −$213
- Net cashflow
- $378
Break-even live
Sensitivity live
| Price | -10% $417 | -5% $397 | +0% $378 | +5% $358 | +10% $338 |
|---|---|---|---|---|---|
| Rent | -10% $298 | -5% $338 | +0% $378 | +5% $418 | +10% $457 |
| Rate | -1.0pp $413 | -0.5pp $395 | base $378 | +0.5pp $359 | +1.0pp $341 |
UW: 25.0% down · 7.5% · 30yr · 1.5% tax · 5.0% vac · 8.0% maint · 8.0% mgmt
Financing live
Cash to close
- Down payment
- $17,475
- Closing costs
- $2,097
- Reserves months
- —
- Total cash needed
- —
Loan-product check · same deal, 3 products live
Conventional
25% down · 7.5% · 30yr
- Down + closing
- —
- Monthly P&I
- —
- Monthly cashflow
- —
- DSCR
- —
- Eligible?
- —
Personal DTI + credit; lowest rate.
DSCR
20% down · 8.5% · 30yr
- Down + closing
- —
- Monthly P&I
- —
- Monthly cashflow
- —
- DSCR
- —
- Eligible?
- —
No personal income docs; deal must DSCR.
Hard money
10% down · 12.0% · 12mo
- Down + closing
- —
- Monthly P&I
- —
- Monthly cashflow
- —
- DSCR
- —
- Eligible?
- —
Short-term bridge; refi at stabilization.
Rent comps 31 comps
| Address | Beds | Baths | Sqft | Rent | $/sqft | DOM | Units | Dist |
|---|---|---|---|---|---|---|---|---|
| 8612 Halls Ferry Rd Saint Louis, MO | 1.0–2.0 | 1.0 | 625 | $775 | $1.24 | 6d | 2 | 0.22mi |
| 8530 Lowell St Saint Louis, MO | 2.0 | 1.0 | 918 | $1,100 | $1.20 | 45d | 1 | 0.28mi |
| 1131 Canaan Ave Saint Louis, MO | 1.0 | 1.0 | 624 | $900 | $1.44 | 17d | 1 | 0.49mi |
| 8828 Riverview Blvd Apt 2S St. Louis, MO | 1.0 | 1.0 | 816 | $850 | $1.04 | 45d | 1 | 0.55mi |
| 819 Gustav Ave Unit 832 B St. Louis, MO | 1.0 | 1.0 | 550 | $740 | $1.35 | 45d | 1 | 0.58mi |
| 819 Gustav Ave Apt A St. Louis, MO | 1.0 | 1.0 | 550 | $740 | $1.35 | 25d | 1 | 0.58mi |
| 819 Gustav Ave Apt C St. Louis, MO | 1.0 | 1.0 | 550 | $800 | $1.45 | 45d | 1 | 0.58mi |
| 605 Fremont Ave Saint Louis, MO | 2.0 | 1.0 | 750 | $995 | $1.33 | 45d | 1 | 0.59mi |
| 8548 Drury Ln Saint Louis, MO | 3.0 | 2.0 | 1107 | $1,420 | $1.28 | 45d | 1 | 0.80mi |
| 960 Raford Ct St. Louis, MO | 2.0 | 1.0 | 750 | $950 | $1.27 | 25d | 1 | 0.91mi |
| 849 River Trail Ct #102 St. Louis, MO | 1.0 | 1.0 | 700 | $825 | $1.18 | 25d | 1 | 0.94mi |
| 849 River Trail Ct Apt 201 St. Louis, MO | 1.0 | 1.0 | 700 | $825 | $1.18 | 45d | 1 | 0.94mi |
| 2056 Coleridge Dr Saint Louis, MO | 3.0 | 1.0 | 949 | $1,195 | $1.26 | 0d | 1 | 1.05mi |
| 2056 Coleridge Dr Saint Louis, MO | 3.0 | 1.0 | 949 | $1,195 | $1.26 | 25d | 1 | 1.05mi |
| 1225 Newark Dr Saint Louis, MO | 3.0 | 2.0 | 944 | $1,400 | $1.48 | 5d | 1 | 1.18mi |
| 5955 Floy Ave Saint Louis, MO | 2.0 | 1.0 | 1032 | $1,050 | $1.02 | 4d | 1 | 1.19mi |
| 9418 Pattonwood Dr Saint Louis, MO | 2.0 | 2.0 | 982 | $1,500 | $1.53 | 25d | 1 | 1.19mi |
| 5932 Floy Ave Saint Louis, MO | 3.0 | 1.0 | 1080 | $1,373 | $1.27 | 21d | 1 | 1.19mi |
| 1942 Damato Ct Saint Louis, MO | 2.0 | 1.0 | 905 | $1,100 | $1.22 | 0d | 1 | 1.26mi |
| 1942 Damato Ct Saint Louis, MO | 2.0 | 1.0 | 905 | $1,100 | $1.22 | 45d | 1 | 1.26mi |
| 5756 Floy Ave Saint Louis, MO | 2.0 | 1.0 | 1080 | $995 | $0.92 | 45d | 1 | 1.32mi |
| 5741 Floy Ave Saint Louis, MO | 2.0 | 1.0 | 1000 | $1,100 | $1.10 | 25d | 1 | 1.36mi |
| 5721 Floy Ave Saint Louis, MO | 2.0 | 1.0 | 1032 | $1,120 | $1.09 | 25d | 1 | 1.39mi |
| 5931 Emma Ave Saint Louis, MO | 2.0 | 1.0 | 880 | $1,200 | $1.36 | 45d | 1 | 1.39mi |
| 5574 Era Ave Saint Louis, MO | 3.0 | 1.0 | 850 | $1,400 | $1.65 | 13d | 1 | 1.40mi |
| 8527 Dianthus Ln Saint Louis, MO | 3.0 | 1.0 | 976 | $1,295 | $1.33 | 45d | 1 | 1.41mi |
| 8502 Dianthus Ln Saint Louis, MO | 2.0 | 1.0 | 1072 | $1,175 | $1.10 | 25d | 1 | 1.41mi |
| 5654 Acme Ave Saint Louis, MO | 2.0 | 1.0 | 968 | $325 | $0.34 | 23d | 1 | 1.46mi |
| 5546 Floy Ave Saint Louis, MO | 2.0 | 2.0 | 850 | $1,273 | $1.50 | 21d | 1 | 1.47mi |
| 5662 Wilborn Dr Saint Louis, MO | 1.0 | 1.0 | 768 | $850 | $1.11 | 25d | 1 | 1.49mi |
| 8817 Shady Grove Ave Saint Louis, MO | 2.0 | 1.0 | 1085 | $1,075 | $0.99 | 25d | 1 | 1.50mi |
Listing history 40 events
-
2026-06-21days on market $69,900 Active 67 DOM
-
2026-06-18days on market $69,900 Active 64 DOM
-
2026-06-17days on market $69,900 Active 63 DOM
-
2026-06-16days on market $69,900 Active 62 DOM
-
2026-06-15days on market $69,900 Active 61 DOM
-
2026-06-13pricedays on market $69,900 Active 59 DOM
-
2026-06-09days on market $74,900 Active 55 DOM
-
2026-06-08days on market $74,900 Active 54 DOM
-
2026-06-07days on market $74,900 Active 53 DOM
-
2026-06-05days on market $74,900 Active 50 DOM
-
2026-06-03days on market $74,900 Active 49 DOM
-
2026-06-02days on market $74,900 Active 48 DOM
-
2026-06-01days on market $74,900 Active 47 DOM
-
2026-05-31days on market $74,900 Active 46 DOM
-
2026-04-20price $74,900 809-char remark
Show marketing remark (809 chars)
Calling all investors!!! Check out this rent-ready/move-in ready charmer in Baden. This home boasts two spacious bedrooms and a full bathroom, perfect for comfortable living. The property has been fully renovated and features a host of modern amenities. The kitchen is equipped with top-of-the-line stainless steel appliances, ready to inspire your culinary adventures. The home also features new windows that allow for an abundance of natural light, enhancing the overall ambiance. The luxury vinyl flooring adds a touch of elegance and is easy to maintain. For your convenience, the property includes garage parking, ensuring your vehicle is always safe and secure. The attic and basement offer lots of additional storage space. Seller financing is available. Please text the listing agent for term details.
-
2026-04-17historical $1,150
-
2026-04-15$80,000 Active 809-char remark
Show marketing remark (809 chars)
Calling all investors!!! Check out this rent-ready/move-in ready charmer in Baden. This home boasts two spacious bedrooms and a full bathroom, perfect for comfortable living. The property has been fully renovated and features a host of modern amenities. The kitchen is equipped with top-of-the-line stainless steel appliances, ready to inspire your culinary adventures. The home also features new windows that allow for an abundance of natural light, enhancing the overall ambiance. The luxury vinyl flooring adds a touch of elegance and is easy to maintain. For your convenience, the property includes garage parking, ensuring your vehicle is always safe and secure. The attic and basement offer lots of additional storage space. Seller financing is available. Please text the listing agent for term details.
-
2026-01-23$1,150
-
2025-11-18price $80,000
-
2025-09-12$85,000 Active
-
2024-06-18soldstatus Closed
-
2024-05-30status Pending
-
2024-05-05price $59,900
-
2024-05-01status Active
-
2024-04-12status Pending
-
2024-04-03price $62,000
-
2024-03-25status Active
-
2024-03-19status Pending
-
2024-03-14status Active
-
2024-03-06status Pending
-
2024-02-24price $63,900
-
2024-02-14status Active
-
2024-02-06status Pending
-
2024-01-18price $65,000
-
2023-12-15price $68,900
-
2023-11-16price $73,000
-
2023-10-16price $77,900
-
2023-09-08price $87,000
-
2023-08-10price $94,000
-
2023-07-11$97,000 Active
ⓘ Source: listings_history table (triggers on properties + properties_extension) + one-shot
backfill from property_details.listing_events for pre-trigger history.
Tax reassessment forecast MO · Resets to sale price
- Current annual tax
- $318 · $26/mo
- Projected year-2 tax
- $678 · $57/mo
- Expected delta
- +$360/yr (+$30/mo · 113.4%)
ⓘ Screening estimate from a state-policy table — verify with the county assessor before closing.
Climate risk First Street
- Flood 1/10 Low FEMA zone X (unshaded) · 0% chance over 30 yrs
- Wildfire 1/10 Low
- Heat 5/10 Major 7 d/yr ≥107°F today · 21 d/yr by 30 yrs out
- Wind 2/10 Low 100% chance of damaging wind over 30 yrs
- Air quality 4/10 Moderate 5 unhealthy d/yr today · 6 by 30 yrs out
Nearby sold comps map
Loading sold comps map…
Walkable amenities ~0.75 mi
Loading nearby amenities…
Taxation est. · year 1
- Rental income
- $12,147
- − Mortgage interest
- −$3,915
- − Property taxes
- −$318
- − Insurance
- −$350
- − Repairs & maintenance
- −$972
- − Management
- −$972
- − Depreciation
- −$2,033
- Taxable income
- $3,587
- Est. tax owed @ 24.0%
- −$861
- After-tax cash flow
- $3,669/yr
For passive investors: Depreciation is non-cash, so a rental often shows a tax loss while cash-flowing — sheltering income. Rental losses are passive: they offset passive income freely, and up to $25,000/yr can offset ordinary (W-2) income if you actively participate and your MAGI is under $100k (phasing out to $0 by $150k); unused losses carry forward. On sale, claimed depreciation is recaptured at up to 25%, and gains may owe capital-gains tax (a 1031 exchange can defer both). Figures are a year-1 estimate at your 24.0% rate — not tax advice; consult a CPA.
Schools (NCES district)
- District
- St. Louis City
- NCES district ID
- 2929280
- Math proficiency
- 10% ▼ -6.00%
- Reading proficiency
- 18% ▼ -3.00%
- Median HH income
- $35,685
- Composite
- 11.54/100
- National rank
- #9699
- State rank
- #312 of 324 in MO
Livability — St. Louis
No livability data for this city. (Only ~50 U.S. cities are tracked.)
Census & demographics
- Census place
- St. Louis, MO
- County
- Saint Louis City · 254,015 people
- City population
- 283,259
- Metro
- St. Louis, MO-IL
- Population (ZIP)
- 8,173
- Household income
- $41,182
- Rent vs Own
- Severe rent burden
- 418.0
Population outlook (St. Louis County) Hauer SSP2
- Today (2025)
- 315,737 people
- By 2030
- 313,865 · -0.6%
- By 2040
- 305,439 · -3.3%
- By 2050
- 296,529 · -6.1%
- By 2075
- 271,028 · -14.2%
- By 2100
- 255,359 · -19.1%
Race, ethnicity, and origin ACS 2023
- Neighborhood character
- Predominantly Black (92%)
- Race & ethnicity
- Black 92% White 5% Two or more races 2%
- Foreign-born
- 0%
- Languages at home
- 99% English-only · Spanish 1%
Political lean MEDSL · St. Louis
- 2024 margin
- Solid D (+64.7) · D 81.4% · R 16.7% · Other 2.0%
- 2008→2024 swing
- -3.5pp toward R · 2008: 68.2pp · 2024: 64.7pp
- All cycles
- 2024: D+64.7 2020: D+66.2 2016: D+63.7 2012: D+66.6 2008: D+68.2
Not yet ingested
- Civics
- —
Market trends
- HPI YoY
- ▼ -38.51%
- Current HPI
- 84.224
- Rent YoY
- —
- Metro
- St. Louis, MO-IL
- State GDP YoY
- ▲ 1.84%
- F500 in state
- 20
Industry mix (Fortune 500 HQ in MO)
| Industry | F500 HQs | Revenue |
|---|---|---|
| Healthcare | 1 | $163B |
|
||
| Insurance | 1 | $21B |
|
||
| Industrial Technology | 1 | $17B |
|
||
| Retail | 1 | $16B |
|
||
| Industrial Distribution | 1 | $10B |
|
||
| Utilities | 1 | $9B |
|
||
Price history
-22.8% since first listed26 events — show timeline
- 2026-04-20 Price Changed $74,900 MARIS as Distributed by MLS Grid
- 2026-04-17 Rental Removed $1,150 SHOWMOJO
- 2026-04-15 Listed $80,000 MARIS as Distributed by MLS Grid
- 2026-01-23 Listed for Rent $1,150 SHOWMOJO
- 2025-11-18 Price Changed $80,000 MARIS as Distributed by MLS Grid
- 2025-09-12 Listed $85,000 MARIS as Distributed by MLS Grid
- 2024-06-18 Sold (MLS) — MARIS as Distributed by MLS Grid
- 2024-05-30 Pending — MARIS as Distributed by MLS Grid
- 2024-05-05 Price Changed $59,900 MARIS as Distributed by MLS Grid
- 2024-05-01 Relisted — MARIS as Distributed by MLS Grid
- 2024-04-12 Pending — MARIS as Distributed by MLS Grid
- 2024-04-03 Price Changed $62,000 MARIS as Distributed by MLS Grid
- 2024-03-25 Relisted — MARIS as Distributed by MLS Grid
- 2024-03-19 Pending — MARIS as Distributed by MLS Grid
- 2024-03-14 Relisted — MARIS as Distributed by MLS Grid
- 2024-03-06 Pending — MARIS as Distributed by MLS Grid
- 2024-02-24 Price Changed $63,900 MARIS as Distributed by MLS Grid
- 2024-02-14 Relisted — MARIS as Distributed by MLS Grid
- 2024-02-06 Pending — MARIS as Distributed by MLS Grid
- 2024-01-18 Price Changed $65,000 MARIS as Distributed by MLS Grid
- 2023-12-15 Price Changed $68,900 MARIS as Distributed by MLS Grid
- 2023-11-16 Price Changed $73,000 MARIS as Distributed by MLS Grid
- 2023-10-16 Price Changed $77,900 MARIS as Distributed by MLS Grid
- 2023-09-08 Price Changed $87,000 MARIS as Distributed by MLS Grid
- 2023-08-10 Price Changed $94,000 MARIS as Distributed by MLS Grid
- 2023-07-11 Listed $97,000 MARIS as Distributed by MLS Grid
Property tax history
-4.8%/yrLatest (2023): $318 · -0.1% YoY. Source: county tax records.
Cash-flow waterfall
monthlySold comps — $/sqft
last 12 mo · ≤1 miLoading sold comps…