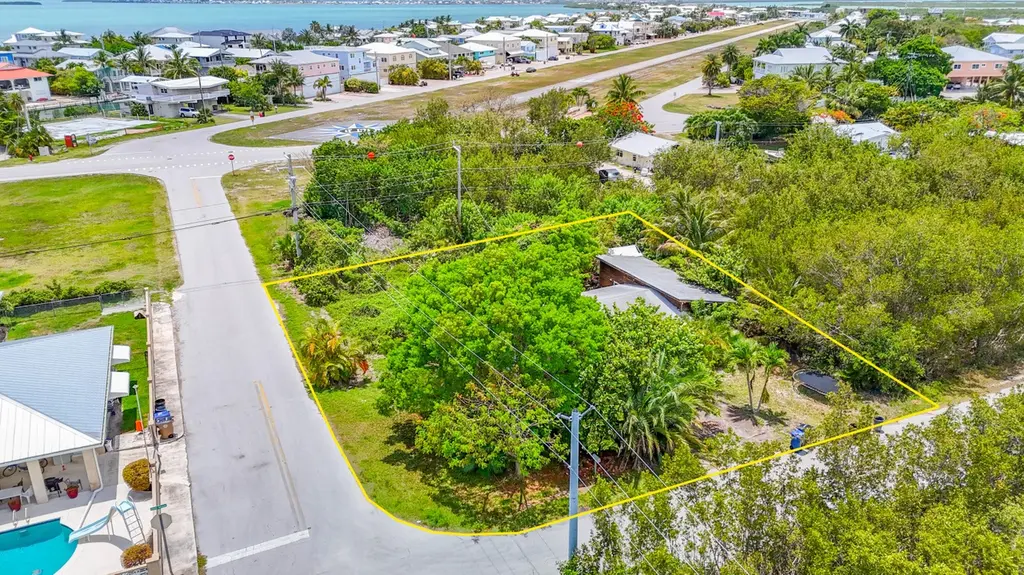
290 46th St · Cudjoe Key, FL
Flood risk 10/10 · Severe
- FEMA flood zone
- AE
- Chance of flooding over 30 yrs
- 0.99%
- Est. flood insurance / yr
- $1,737 – $8,500
Fire risk 1/10 · Minimal
- Est. fire insurance / yr
- $947 – $1,759
Heat risk No data
- Hot days now (above threshold)
- —
- Hot days in 30 yrs
- —
Wind risk 10/10 · Severe
- Chance of severe wind over 30 yrs
- 99.0%
Air-quality risk 1/10 · Minimal
- Unhealthy air days now
- 0 days/yr
- Unhealthy air days in 30 yrs
- 0 days/yr
Risk factors via First Street. Map © Google.
Why this score? — see what drove the C grade
The composite is a weighted blend of 9 inputs, each scored 0–100. Each bar is that input's sub-score; the figure is the points it added to the 100-point composite (weight × sub-score).
- Cash flow +19.0/30.0
- Appreciation +10.0/10.0
- ARV discount +7.5/15.0
- DSCR +6.0/10.0
- Schools +4.6/10.0
- 1% rule +3.7/10.0
- Livability +3.0/5.0
- Rent growth +2.5/5.0
- Condition / age +2.5/5.0
$425,000
🖨 Deal sheet 📄 Offer letter ✓ Due diligence
Listing remarks
Pilots, this is a great opportunity to build your dream home with access to Summerland Key's private airport, and enjoy access to the Blanche Bergin Marina Park, complete with boat ramp and available dockage for a fee. This property is a fixer-upper, located on Summerland Key, at the base of the airport runway. 2/1 on one side, and an additional 12 x32 en suite with a separate entrance on the other side. The home sits on a rare double lot totaling 11,000 SF. If you like privacy, this is it, with only one neighbor next to you. There is an expired permit, and one open permit the buyer will have to assume responsibility for. There are no open code cases on the property. The seller doesn't have
Key facts
- Only one neighbor
- Rare double lot
- 0.25 acre lot
Tags
Property features AI
Finance
- Other: Property listed as fixer upper; Pets allowed; Rentals allowed with restrictions (minimum rental 28 days); Located on approximately 0.25 acre; more than one lot; Zoned NA - Native Area District; Flood zone AE8
- Financial info: Cash terms
- HOA & community: No association fees; No first right of refusal; No HOA amenities included
Exterior
- Utilities: FKAA water/sewer; Other utilities (see remarks) — buyer to verify
- Home design: Ground level single-story residence; Faces median (side: Median)
- Construction: Built in 1958; Frame construction; Metal roof; Not above flood
- Exterior features: Panel shutters; No waterfront; No waterview
Interior
- Kitchen: Dishwasher; Range; Refrigerator
- Bathrooms: 1 full bathroom
- Heating & cooling: Ductless A/C; Window/wall units
- Interior features: Window/wall air conditioning units; Ductless A/C; Unfurnished
Neighborhood map
What this means for you Summary
Snapshot
- This is a 2-bed/1.0-bath single-family listed at $425k.
Deal economics
- At list price, monthly cash flow is $17 ($210/yr) — positive.
- The deal already cash-flows at list — no discount required.
- To meet the 1% rule (rent ≥ 1% of price), the offer needs to be $370k (13.0% below list).
- Recommended offer: $370k (13.0% below list) — sets the bar for 1% rule.
- Cap rate 7.5% vs local median 1.5% in Cudjoe Key — top-decile yield for the area; either an underpriced asset or a hidden risk that comps aren't pricing in. Stress-test before assuming the spread holds.
Location & tenants
- Location reads 59/100 on livability (#811 in FL) — a working-class tenant base; expect higher turnover. Strengths: crime A+, employment A+, housing B; Watch: schools D, health & safety D, amenities F.
- Monroe (town): math 50% / reading 55% proficiency, ranked #23 of 73 in FL (top 32%) — acceptable for families but not a draw, mixed tenant base, ~2y average lease.
- Market conditions: 239 active listings in the ZIP; solid renter incomes; 332 units permitted in Monroe County in 2024 (42 in 5+ unit buildings).
- This rent runs 43% of the median local income ($103k/yr) — at the standard rent-burdened threshold; future hikes will face affordability resistance.
Forward outlook
- In year one you build about $45k of equity ($3k loan paydown + $42k appreciation (10.0% local appreciation)).
- Monroe County population projected at +28% by 2050 — long-run rental-demand tailwind backs the buy-and-hold thesis.
- At projected returns (10.0% appreciation + 3.0% rent growth), your $119k cash investment doubles in ~3 years — after that, you're playing with house money.
- By year 2, paydown + projected appreciation supports a ~$73k cash-out refi (75% LTV) — recoverable capital for the next deal without selling this one.
Negotiation context
- It's been on market 25 days — a 2% lower offer ($419k) is reasonable based on typical stale-listing flexibility.
- Current owner paid $58k; list at $425k implies a 633% gain — meaningful room to come down on a strong offer.
Risks & watch-outs
- Watch-outs: flood insurance adds $427/mo; built in 1958 — expect roof / HVAC / electrical / plumbing capex.
- Climate carrying-cost: in FEMA flood zone AE (mandatory federal flood insurance); severe wind risk, 99% chance of damaging wind over 30y — expect insurance premiums to compound above CPI over the hold.
Questions for the listing agent
- Built in 1958 — when were the roof, HVAC, electrical panel, plumbing, and water heater last replaced?
- What's the actual annual flood-insurance premium (NFIP or private), and is the property in a SFHA with mandatory coverage?
- Is there a deadline driving the sale (1031 exchange, divorce, estate, relocation)? That informs how much negotiation room exists.
- Schools are D-rated, which usually means shorter tenancies and higher turnover. Who's the typical renter profile here, and what's been the actual vacancy rate?
- What's the average days-on-market for RENTAL listings here right now (not sales)? A rising rental-DOM trend means longer vacancies and softer asking-rent achievability than the comps imply.
- What's the recent tenant-quality profile in this submarket — average credit score on applications, eviction rate, late-payment / NSF rate, and stable-employment percentage? A property-management company in the area should have these aggregated.
- How much new for-sale + rental construction is in the pipeline within 1–3 miles? Heavy new supply typically softens prices + rents 12–24 months out; constrained supply supports both.
Investment metrics
- 1% rule
- 0.87% ✗
- Cap rate
- 7.55%
- Cash-on-cash
- 4.48%
- DSCR
- 1.20
- GRM
- 9.6
CMA / ARV
- ARV (on-the-fly)
- $1,094,016
- Comps found
- 12
Show comp detail 12 sales within ~0.75 mi
| Address | Dist | Beds/Ba | Sqft | Sold | Price | $/sf | Match |
|---|---|---|---|---|---|---|---|
| 876 Gulf Dr | 0.27mi | 2/2.0 | 1,172 (-1%) | 3mo | $1,750,000 | $1,493 | 79 |
| 857 E Caribbean Dr | 0.22mi | 3/2.0 (+1) | 1,204 (+2%) | 2mo | $1,100,000 | $914 | 76 |
| 24830 Park Dr | 0.30mi | 3/2.0 (+1) | 1,188 (+0%) | 5mo | $700,000 | $589 | 72 |
| 1011 E Caribbean Dr | 0.35mi | 3/2.0 (+1) | 1,144 (-3%) | 1mo | $1,100,000 | $962 | 68 |
| 24833 Park Dr | 0.30mi | 2/2.0 | 1,166 (-2%) | 14mo | $799,000 | $685 | 68 |
| 1050 Gulf Dr | 0.41mi | 2/2.0 | 1,171 (-1%) | 15mo | $1,300,000 | $1,110 | 62 |
| 24827 Park Dr | 0.31mi | 3/2.0 (+1) | 1,274 (+8%) | 9mo | $775,000 | $608 | 57 |
| 229 E Caribbean Dr | 0.51mi | 3/2.0 (+1) | 1,152 (-3%) | 10mo | $1,390,000 | $1,207 | 55 |
| 270 S Airport Dr | 0.36mi | 3/3.0 (+1) | 1,275 (+8%) | 4mo | $1,550,000 | $1,216 | 54 |
| 76 W Shore Dr | 0.19mi | 3/2.0 (+1) | 1,028 (-13%) | 8mo | $950,000 | $924 | 53 |
| 25022 Palm Ln | 0.54mi | 3/2.0 (+1) | 1,200 (+1%) | 13mo | $699,000 | $583 | 52 |
| 24950 Palm Ln | 0.54mi | 2/2.0 | 1,040 (-12%) | 19mo | $580,000 | $558 | 35 |
Match score weights: distance 35% · size 25% · config 20% · recency 20%. Top-matched comps best support the ARV.
Projected returns pro-forma
10.0% appreciation · 3.0% rent growth · sell at horizon
- IRR
- 24.4%
- Equity multiple
- 2.95×
- Total profit
- $232,615
- Equity at exit
- $382,874
- IRR
- 21.6%
- Equity multiple
- 6.75×
- Total profit
- $684,208
- Equity at exit
- $825,682
Cash invested: $119,000 (down + closing). Projections, not guarantees.
Landlord ↔ Tenant lean methodology
- Overall (STATE)
- 87 Strongly Landlord-Friendly
- State Florida
- 87 Strongly Landlord-Friendly · R+3
- County
- — inherits STATE
- City
- — inherits STATE
ZIP-level market 33042
- Home prices YoY
- 2.5%
- Active inventory
- 239
- Price-to-rent
- 9.6×
Monthly cashflow live
- Estimated rent
- $3,698 medium interval (Pro) →
- Mortgage (P&I)
- −$2,229
- Tax from tax record
- −$72 /mo · $862/yr
- Insurance
- −$177
- Flood insurance flood zone
- −$427 /mo · $5,118/yr
- HOA
- −$0
- Vacancy / Maint / Mgmt
- −$777
- Net cashflow
- $17
Break-even live
UW: 25.0% down · 7.5% · 30yr · 1.5% tax · 5.0% vac · 8.0% maint · 8.0% mgmt
Financing live
Cash to close
- Down payment
- $106,250
- Closing costs
- $12,750
- Reserves months
- —
- Total cash needed
- —
Loan-product check · same deal, 3 products live
Conventional
25% down · 7.5% · 30yr
- Down + closing
- —
- Monthly P&I
- —
- Monthly cashflow
- —
- DSCR
- —
- Eligible?
- —
Personal DTI + credit; lowest rate.
DSCR
20% down · 8.5% · 30yr
- Down + closing
- —
- Monthly P&I
- —
- Monthly cashflow
- —
- DSCR
- —
- Eligible?
- —
No personal income docs; deal must DSCR.
Hard money
10% down · 12.0% · 12mo
- Down + closing
- —
- Monthly P&I
- —
- Monthly cashflow
- —
- DSCR
- —
- Eligible?
- —
Short-term bridge; refi at stabilization.
Listing history 19 events
-
2026-06-19days on market $425,000 Active 25 DOM
-
2026-06-18days on market $425,000 Active 24 DOM
-
2026-06-17days on market $425,000 Active 23 DOM
-
2026-06-16days on market $425,000 Active 22 DOM
-
2026-06-15days on market $425,000 Active 21 DOM
-
2026-06-14days on market $425,000 Active 19 DOM
-
2026-06-13days on market $425,000 Active 18 DOM
-
2026-06-10days on market $425,000 Active 16 DOM
-
2026-06-09days on market $425,000 Active 15 DOM
-
2026-06-08days on market $425,000 Active 14 DOM
-
2026-06-07days on market $425,000 Active 13 DOM
-
2026-06-05days on market $425,000 Active 10 DOM
-
2026-06-03days on market $425,000 Active 9 DOM
-
2026-06-02days on market $425,000 Active 8 DOM
-
2026-06-01days on market $425,000 Active 7 DOM
-
2026-05-31days on market $425,000 Active 6 DOM
-
2026-05-30days on market $425,000 Active 5 DOM
-
2026-05-25$425,000 Active
-
1988-08-02soldstatus $58,000
ⓘ Source: listings_history table (triggers on properties + properties_extension) + one-shot
backfill from property_details.listing_events for pre-trigger history.
Tax reassessment forecast FL · Resets to sale price
- Current annual tax
- $862 · $72/mo
- Projected year-2 tax
- $3,528 · $294/mo
- Expected delta
- +$2,665/yr (+$222/mo · 309.0%)
ⓘ Screening estimate from a state-policy table — verify with the county assessor before closing.
Climate risk First Street
- Flood 10/10 Extreme FEMA zone AE · 99% chance over 30 yrs
- Wildfire 1/10 Low
- Wind 10/10 Extreme 99% chance of damaging wind over 30 yrs
- Air quality 1/10 Low 0 unhealthy d/yr today · 0 by 30 yrs out
Nearby sold comps map
Loading sold comps map…
Walkable amenities ~0.75 mi
Loading nearby amenities…
Taxation est. · year 1
- Rental income
- $44,381
- − Mortgage interest
- −$23,807
- − Property taxes
- −$862
- − Insurance
- −$7,244
- − Repairs & maintenance
- −$3,550
- − Management
- −$3,550
- − Depreciation
- −$12,364
- Taxable loss
- −$6,997
- Est. tax savings @ 24.0%
- +$1,679
- After-tax cash flow
- $1,889/yr
For passive investors: Depreciation is non-cash, so a rental often shows a tax loss while cash-flowing — sheltering income. Rental losses are passive: they offset passive income freely, and up to $25,000/yr can offset ordinary (W-2) income if you actively participate and your MAGI is under $100k (phasing out to $0 by $150k); unused losses carry forward. On sale, claimed depreciation is recaptured at up to 25%, and gains may owe capital-gains tax (a 1031 exchange can defer both). Figures are a year-1 estimate at your 24.0% rate — not tax advice; consult a CPA.
Schools (NCES district)
- District
- Monroe
- NCES district ID
- 1201320
- Math proficiency
- 50% ▼ -14.00%
- Reading proficiency
- 55% ▼ -6.00%
- Median HH income
- $56,955
- Composite
- 45.51/100
- National rank
- #2608
- State rank
- #23 of 73 in FL
Livability — Cudjoe Key
- Score
- 59/100
- State rank
- #811
- US rank
- #19681
Category grades
Schools grade is shown separately in the Schools card above.
Census & demographics
- County
- Monroe County · 66,185 people
- City population
- 6,781
- Metro
- Key West, FL
- Population (ZIP)
- 6,441
- Household income
- $103,041
- Rent vs Own
- Severe rent burden
- 146.0
Population outlook (Monroe County) Hauer SSP2
- Today (2025)
- 90,706 people
- By 2030
- 96,308 · +6.2%
- By 2040
- 106,565 · +17.5%
- By 2050
- 116,500 · +28.4%
- By 2075
- 141,423 · +55.9%
- By 2100
- 151,947 · +67.5%
Race, ethnicity, and origin ACS 2023
- Neighborhood character
- Predominantly White (81%)
- Race & ethnicity
- White 81% Two or more races 12% Hispanic / Latino 12% Black 3%
- Hispanic origin (detail)
- Mexican 3% Puerto Rican 2% Cuban 5%
- Common ancestry
- Romanian 3% Slovak 3% Iranian 3%
- Foreign-born
- 8% · Canada, Jamaica
- Languages at home
- 91% English-only · Spanish 5% Russian/Polish/Slavic 1% German/W. Germanic 1%
Political lean MEDSL · Monroe
- 2024 margin
- R (+18.3) · D 40.5% · R 58.8%
- 2008→2024 swing
- -23.2pp toward R · 2008: 4.9pp · 2024: -18.3pp
- All cycles
- 2024: R+18.3 2020: R+7.9 2016: R+6.9 2012: D+0.4 2008: D+4.9
Not yet ingested
- Civics
- —
Market trends
- HPI YoY
- ▲ 12.11%
- Current HPI
- 491.52
- Rent YoY
- —
- Metro
- Key West, FL
- State GDP YoY
- ▲ 3.28%
- F500 in state
- 36
Industry mix (Fortune 500 HQ in FL)
| Industry | F500 HQs | Revenue |
|---|---|---|
| Industrial Technology | 2 | $29B |
|
||
| Insurance | 2 | $17B |
|
||
| Retail | 1 | $60B |
|
||
| Technology Distribution | 1 | $58B |
|
||
| Homebuilding | 1 | $35B |
|
||
| Technology Manufacturing | 1 | $35B |
|
||
Price history
+632.8% since first listed2 events — show timeline
- 2026-05-25 Listed $425,000 FLKMLS
- 1988-08-02 Sold (Public Records) $58,000 Public Records
Property tax history
+1.9%/yrLatest (2025): $862 · +5.1% YoY. Source: county tax records.
Cash-flow waterfall
monthlySold comps — $/sqft
last 12 mo · ≤1 miLoading sold comps…