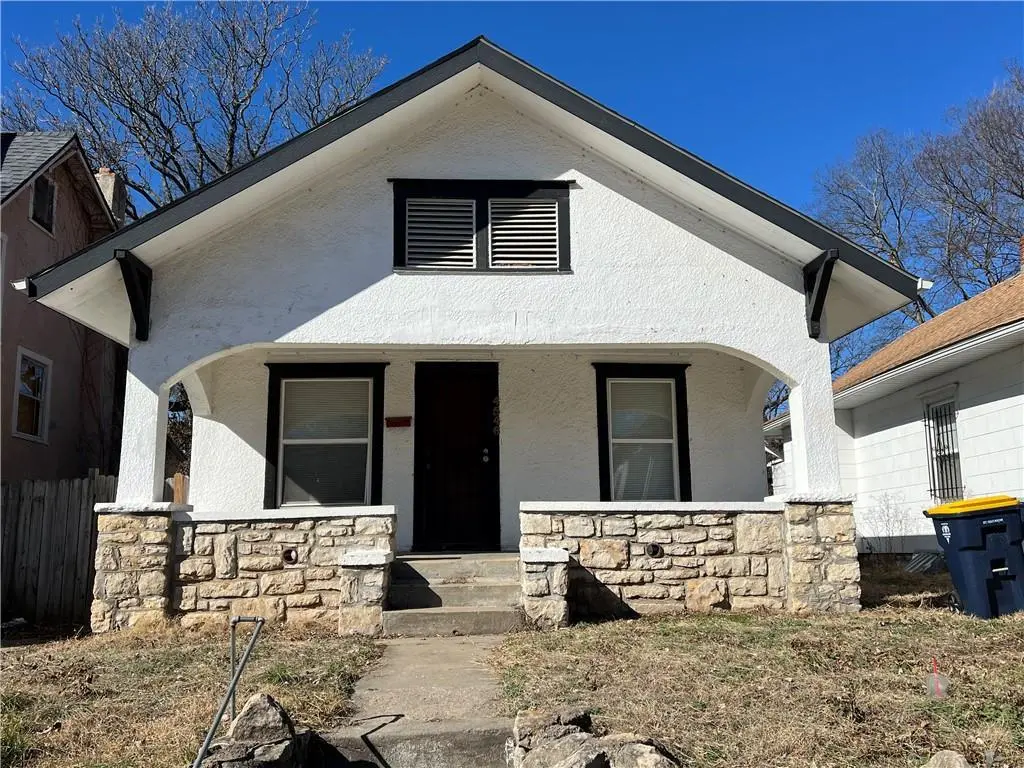
4546 S Benton Ave · Kansas City, MO
Flood risk 1/10 · Minimal
- FEMA flood zone
- X (unshaded)
- Chance of flooding over 30 yrs
- 0.0%
- Est. flood insurance / yr
- $473 – $860
Fire risk 1/10 · Minimal
- Est. fire insurance / yr
- $1,054 – $1,958
Heat risk 4/10 · Minor
- Hot days now (above 107°F)
- 7 days/yr
- Hot days in 30 yrs
- 17 days/yr
Wind risk 2/10 · Minimal
- Chance of severe wind over 30 yrs
- —
Air-quality risk 3/10 · Minor
- Unhealthy air days now
- 2 days/yr
- Unhealthy air days in 30 yrs
- 4 days/yr
Risk factors via First Street. Map © Google.
Why this score? — see what drove the C grade
The composite is a weighted blend of 9 inputs, each scored 0–100. Each bar is that input's sub-score; the figure is the points it added to the 100-point composite (weight × sub-score).
- Cash flow +29.2/30.0
- DSCR +10.0/10.0
- 1% rule +7.0/10.0
- Livability +3.9/5.0
- Rent growth +3.6/5.0
- Condition / age +2.5/5.0
- Schools +1.5/10.0
- ARV discount +0.0/15.0
- Appreciation +0.0/10.0
$99,000
🖨 Deal sheet (PDF) 📄 Offer letter ✓ Due diligence
Listing remarks MLS
Turnkey remodel with an HAKC tenant at $1071/mo. 2021 Upgrades include: new windows, new roof, new gutters and exterior paint. New bathroom, new shower and all new bathroom tile. New LVP throughout, new laminate counters, new appliances, new led fixtures and doors. New furnace in 2022 New Stove in 2023. Nothing to do here but enjoy the cashflow. Other properties available MLS#s: 2426106,2425669,2419652,2419608,2419565,2420918,2419932,2419618,2418241 Listing agent has a financial interest in the property
Key facts
- Open floor plan
- Extra storage
- Remodeled kitchen
Tags
Property features AI
Finance
- Other: Lot dimensions about 35 x 112 (3,910 sq ft); Not in a flood plain
- HOA & community: No association fees
Exterior
- Parking: Off-street parking
- Utilities: Public water; Public sewer
- Home design: Single-family residence; Residential property; Bungalow style
- Construction: Frame construction; Composition roof; Property age: approximately 76–100 years
- Exterior features: Partial wood fencing; City lot
Interior
- Kitchen: Kitchen on the main level
- Bedrooms: 2 bedrooms on the main level
- Flooring: Luxury vinyl flooring
- Bathrooms: 1 full bathroom on the main level
- Heating & cooling: Forced air heating; Window unit(s) for cooling
- Interior features: Bungalow floor plan; Full basement
- Laundry & utility: Laundry in basement
Neighborhood map
What this means for you Summary
Snapshot
- This is a 2-bed/1.0-bath single-family listed at $99k.
Deal economics
- At list price, monthly cash flow is $344 ($4k/yr) — positive.
- The deal already cash-flows at list — no discount required.
- Meets the 1% rule at list price ($1k rent vs $99k).
- Recommended offer: $98k (1.5% below list) — sets the bar for market timing.
- Cap rate 10.5% vs local median 3.9% in Kansas City — top-decile yield for the area; either an underpriced asset or a hidden risk that comps aren't pricing in. Stress-test before assuming the spread holds.
Location & tenants
- Location reads 78/100 on livability (#28 in MO, #2,671 nationally) — a middle-class / working-renter tenant base. Strengths: amenities A+, commute A+, cost of living A+; Watch: schools C-, crime F.
- Kansas City 33 (urban): math 12% / reading 24% proficiency, ranked #308 of 324 in MO (top 95%) — low school quality limits family demand, transient renter base, plan for 1-2y turnover; 75% free/reduced lunch — lower-income household profile, screen leases tightly.
- Market conditions: Rents rising fast (+4.4%/yr); 185 active listings in the ZIP; 40 comparable units currently listed for rent nearby; rentals at typical pace (median 21d on market — plan ~3-4 weeks tenant-placement turnaround); lower-income renter base — watch delinquency; 4,002 units permitted in Jackson County in 2024 (2,271 in 5+ unit buildings).
- This rent runs 34% of the median local income ($42k/yr) — at the standard rent-burdened threshold; future hikes will face affordability resistance.
Forward outlook
- Local home prices are declining (-3.0%/yr); year-one equity from $684 of loan paydown is wiped out by about $3k of value loss. Plan a longer hold.
- Jackson County population projected at +4% by 2050 — modest demand growth; plan on rents tracking national, not racing it.
- At projected returns (-3.0% appreciation + 4.4% rent growth), your $28k cash investment doubles in ~8 years — after that, you're playing with house money.
Negotiation context
- It's been on market 23 days — a 2% lower offer ($98k) is reasonable based on typical stale-listing flexibility.
- 7 sale attempts since 21y ago with the ask held roughly flat each time — persistent listings suggest the price (not the market) is what's stuck; bring a comps-based counter.
Risks & watch-outs
- Watch-outs: built in 1913 — expect roof / HVAC / electrical / plumbing capex.
Questions for the listing agent
- Built in 1913 — when were the roof, HVAC, electrical panel, plumbing, and water heater last replaced?
- Is there a deadline driving the sale (1031 exchange, divorce, estate, relocation)? That informs how much negotiation room exists.
- Crime grade is F in this area — have there been break-ins, vandalism, or insurance claims at this property in the last 3 years? What carrier currently insures it and at what premium?
- What's the average days-on-market for RENTAL listings here right now (not sales)? A rising rental-DOM trend means longer vacancies and softer asking-rent achievability than the comps imply.
- What's the recent tenant-quality profile in this submarket — average credit score on applications, eviction rate, late-payment / NSF rate, and stable-employment percentage? A property-management company in the area should have these aggregated.
- How much new for-sale + rental construction is in the pipeline within 1–3 miles? Heavy new supply typically softens prices + rents 12–24 months out; constrained supply supports both.
Investment metrics
- 1% rule
- 1.20% ✓
- Cap rate
- 10.47%
- Cash-on-cash
- 14.91%
- DSCR
- 1.66
- GRM
- 6.9
CMA / ARV
- ARV (on-the-fly)
- $79,054
- Comps found
- 12
Show comp detail 12 sales within ~0.75 mi
| Address | Dist | Beds/Ba | Sqft | Sold | Price | $/sf | Match |
|---|---|---|---|---|---|---|---|
| 4909 S Benton Ave | 0.42mi | 2/1.0 | 821 (-2%) | 5mo | $75,000 | $91 | 72 |
| 4824 Agnes Ave | 0.38mi | 2/1.0 | 792 (-6%) | 4mo | $79,000 | $100 | 69 |
| 4214 Monroe Ave | 0.67mi | 2/1.0 | 858 (+2%) | 7mo | $50,000 | $58 | 60 |
| 5030 Walrond Ave | 0.63mi | 2/1.0 | 770 (-8%) | 2mo | $64,900 | $84 | 55 |
| 4428 Garfield Ave | 0.52mi | 3/1.0 (+1) | 800 (-5%) | 10mo | $75,000 | $94 | 55 |
| 4338 Myrtle Ave | 0.74mi | 2/1.0 | 780 (-7%) | 3mo | $125,000 | $160 | 51 |
| 2303 E 41st St E | 0.69mi | 2/1.0 | 918 (+9%) | 4mo | $80,000 | $87 | 50 |
| 4218 Cleveland Ave | 0.71mi | 2/1.0 | 780 (-7%) | 6mo | $110,000 | $141 | 49 |
| 4410 Myrtle Ave | 0.72mi | 3/1.0 (+1) | 912 (+8%) | 4mo | $80,000 | $88 | 44 |
| 4327 Mersington Ave | 0.71mi | 2/1.0 | 940 (+12%) | 4mo | $50,000 | $53 | 44 |
| 4210 Monroe Ave | 0.67mi | 2/1.0 | 720 (-14%) | 6mo | $107,500 | $149 | 39 |
| 4442 Myrtle Ave | 0.70mi | 2/1.0 | 720 (-14%) | 6mo | $94,900 | $132 | 38 |
Match score weights: distance 35% · size 25% · config 20% · recency 20%. Top-matched comps best support the ARV.
Projected returns pro-forma
-3.0% appreciation · 4.42% rent growth · sell at horizon
- IRR
- 6.9%
- Equity multiple
- 1.27×
- Total profit
- $7,577
- Equity at exit
- $14,761
- IRR
- 17.3%
- Equity multiple
- 2.51×
- Total profit
- $41,972
- Equity at exit
- $8,560
Cash invested: $27,720 (down + closing). Projections, not guarantees.
Landlord ↔ Tenant lean methodology
- Overall (STATE)
- 81 Strongly Landlord-Friendly
- State Missouri
- 81 Strongly Landlord-Friendly · R+10
- County
- — inherits STATE
- City
- — inherits STATE
ZIP-level market 64130
- Home prices YoY
- -21.5%
- Rents YoY
- 4.4%
- Active inventory
- 185
- Price-to-rent
- 6.9×
Monthly cashflow live
- Estimated rent
- $1,190 high interval (Pro) →
- Mortgage (P&I)
- −$519
- Tax from tax record
- −$35 /mo · $422/yr
- Insurance
- −$41
- HOA
- −$0
- Vacancy / Maint / Mgmt
- −$250
- Net cashflow
- $344
Break-even live
Sensitivity live
| Price | -10% $400 | -5% $372 | +0% $344 | +5% $316 | +10% $288 |
|---|---|---|---|---|---|
| Rent | -10% $250 | -5% $297 | +0% $344 | +5% $391 | +10% $438 |
| Rate | -1.0pp $394 | -0.5pp $370 | base $344 | +0.5pp $319 | +1.0pp $293 |
UW: 25.0% down · 7.5% · 30yr · 1.5% tax · 5.0% vac · 8.0% maint · 8.0% mgmt
Financing live
Cash to close
- Down payment
- $24,750
- Closing costs
- $2,970
- Reserves months
- —
- Total cash needed
- —
Loan-product check · same deal, 3 products live
Conventional
25% down · 7.5% · 30yr
- Down + closing
- —
- Monthly P&I
- —
- Monthly cashflow
- —
- DSCR
- —
- Eligible?
- —
Personal DTI + credit; lowest rate.
DSCR
20% down · 8.5% · 30yr
- Down + closing
- —
- Monthly P&I
- —
- Monthly cashflow
- —
- DSCR
- —
- Eligible?
- —
No personal income docs; deal must DSCR.
Hard money
10% down · 12.0% · 12mo
- Down + closing
- —
- Monthly P&I
- —
- Monthly cashflow
- —
- DSCR
- —
- Eligible?
- —
Short-term bridge; refi at stabilization.
Rent comps 40 comps
| Address | Beds | Baths | Sqft | Rent | $/sqft | DOM | Units | Dist |
|---|---|---|---|---|---|---|---|---|
| 4534 S Benton Ave Kansas City, MO | 2.0 | 1.0 | 912 | $1,045 | $1.15 | 17d | 1 | 0.02mi |
| 4427 Agnes Ave Kansas City, MO | 3.0 | 1.0 | 1100 | $1,350 | $1.23 | 17d | 1 | 0.18mi |
| 4309 College Ave Kansas City, MO | 3.0 | 2.0 | 1040 | $1,550 | $1.49 | 17d | 1 | 0.43mi |
| 4911 S Benton Ave Kansas City, MO | 2.0 | 1.0 | 1000 | $1,100 | $1.10 | 18d | 1 | 0.43mi |
| 4917 S Benton Ave Kansas City, MO | 2.0 | 1.0 | 1000 | $1,100 | $1.10 | 24d | 1 | 0.45mi |
| 4144 College Ave Kansas City, MO | 3.0 | 1.0 | 1108 | $1,095 | $0.99 | 24d | 1 | 0.55mi |
| 5013 S Benton Ave Kansas City, MO | 3.0 | 1.0 | 978 | $1,225 | $1.25 | 24d | 1 | 0.56mi |
| 4930 Park Ave Kansas City, MO | 3.0 | 1.0 | 900 | $1,300 | $1.44 | 17d | 1 | 0.61mi |
| 3017 E 51st St Kansas City, MO | 2.0 | 1.0 | 621 | $1,303 | $2.10 | 8d | 1 | 0.67mi |
| 2305 E 41st St Kansas City, MO | 2.0 | 1.0 | 750 | $1,000 | $1.33 | 8d | 1 | 0.68mi |
| 4216 Cleveland Ave Kansas City, MO | 2.0 | 1.0 | 780 | $1,125 | $1.44 | 17d | 1 | 0.70mi |
| 4005 Bales Ave Kansas City, MO | 2.0 | 1.0 | 792 | $1,050 | $1.33 | 44d | 1 | 0.81mi |
| 5114 Brooklyn Ave Kansas City, MO | 3.0 | 1.5 | 1116 | $1,300 | $1.16 | 8d | 1 | 0.81mi |
| 4401 Wayne Ave Kansas City, MO | 2.0 | 1.5 | 955 | $1,300 | $1.36 | 24d | 1 | 0.82mi |
| 3315 E 52nd St Kansas City, MO | 2.0 | 1.0 | 662 | $1,125 | $1.70 | 24d | 1 | 0.84mi |
| 1500 E 46th St Kansas City, MO | 1.0–3.0 | 1.0 | 803 | $1,050 | $1.31 | 44d | 1 | 0.85mi |
| 3949 Doctor Martin Luther King Junior Blvd Kansas City, MO | 1.0–2.0 | 1.0–2.0 | 945 | $1,565 | $1.66 | 3d | 3 | 0.89mi |
| 3841 Olive St Kansas City, MO | 2.0 | 1.0 | 792 | $985 | $1.24 | 15d | 1 | 0.92mi |
| 4028 Myrtle Ave Kansas City, MO | 3.0 | 1.0 | 1100 | $1,490 | $1.35 | 44d | 1 | 0.94mi |
| 4209 Flora Ave Kansas City, MO | 2.0 | 1.0 | 778 | $1,200 | $1.54 | 17d | 1 | 0.97mi |
| 4818 Paseo Blvd Unit 1W Kansas City, MO | 1.0 | 1.0 | 526 | $945 | $1.80 | 24d | 1 | 1.00mi |
| 4818 Paseo Blvd Kansas City, MO | 1.0 | 1.0 | 526 | $945 | $1.80 | 4d | 8 | 1.02mi |
| 4818 Paseo Blvd Kansas City, MO | 1.0 | 1.0 | 526 | $945 | $1.80 | 12d | 10 | 1.02mi |
| 4818 The Paseo Unit 2N Kansas City, MO | 1.0 | 1.0 | 526 | $945 | $1.80 | 17d | 1 | 1.02mi |
| 4818 The Paseo Unit 3S Kansas City, MO | 1.0 | 1.0 | 526 | $895 | $1.70 | 24d | 1 | 1.02mi |
| 4818 The Paseo Unit 2N Kansas City, MO | 1.0 | 1.0 | 526 | $995 | $1.89 | 24d | 1 | 1.02mi |
| 1320 E 49th St Kansas City, MO | 1.0 | 1.0 | 550 | $1,000 | $1.82 | 4d | 2 | 1.06mi |
| 1214 Brush Creek Blvd Unit 03 Kansas City, MO | 2.0 | 1.0 | 950 | $1,050 | $1.11 | 18d | 1 | 1.07mi |
| 4232 Virginia Ave Unit 1 Kansas City, MO | 1.0 | 1.0 | 592 | $750 | $1.27 | 20d | 1 | 1.08mi |
| 3710 Wabash Ave Unit 2S Kansas City, MO | 2.0 | 1.0 | 875 | $850 | $0.97 | 24d | 1 | 1.13mi |
| 4925 Tracy Ave Unit 1 Kansas City, MO | 2.0 | 1.0 | 1000 | $1,400 | $1.40 | 44d | 1 | 1.14mi |
| 5410 Euclid Ave Kansas City, MO | 3.0 | 2.0 | 1119 | $1,395 | $1.25 | 44d | 1 | 1.19mi |
| 4119 Forest Ave Kansas City, MO | 2.0 | 1.0 | 950 | $1,400 | $1.47 | 13d | 1 | 1.22mi |
| 5332 Highland Ave Kansas City, MO | 3.0 | 1.0 | 1022 | $1,350 | $1.32 | 8d | 1 | 1.23mi |
| 5614 Indiana Ave Kansas City, MO | 3.0 | 1.0 | 900 | $1,175 | $1.31 | 44d | 1 | 1.34mi |
| 4154 Harrison St Kansas City, MO | 2.0 | 1.0 | 1100 | $1,395 | $1.27 | 44d | 1 | 1.34mi |
| 5529 Michigan Ave Kansas City, MO | 2.0 | 1.0 | 847 | $995 | $1.17 | 44d | 1 | 1.36mi |
| 820 E 43rd St Kansas City, MO | 2.0 | 1.0 | 900 | $985 | $1.09 | 18d | 1 | 1.36mi |
| 4023 Harrison St Unit 4021-2N Kansas City, MO | 2.0 | 1.0 | 850 | $1,295 | $1.52 | 24d | 1 | 1.40mi |
| 4023 Harrison St Unit 40232-S Kansas City, MO | 2.0 | 1.0 | 850 | $1,250 | $1.47 | 24d | 1 | 1.40mi |
Listing history 37 events
-
2026-06-21days on market $99,000 Active 23 DOM
-
2026-06-18days on market $99,000 Active 20 DOM
-
2026-06-17days on market $99,000 Active 19 DOM
-
2026-06-16days on market $99,000 Active 18 DOM
-
2026-06-15days on market $99,000 Active 17 DOM
-
2026-06-13days on market $99,000 Active 15 DOM
-
2026-06-09days on market $99,000 Active 11 DOM
-
2026-06-08days on market $99,000 Active 10 DOM
-
2026-06-07days on market $99,000 Active 9 DOM
-
2026-06-05days on market $99,000 Active 6 DOM
-
2026-06-03days on market $99,000 Active 5 DOM
-
2026-06-02days on market $99,000 Active 4 DOM
-
2026-06-01remarks 699-char remark
-
2026-06-01days on market $99,000 Active 3 DOM
-
2026-05-31days on market $99,000 Active 2 DOM
-
2026-05-29$99,000 Active
-
2026-04-05historical $1,045
-
2026-04-02price $1,045
-
2026-02-21$1,095
-
2026-02-15historical $1,195
-
2026-01-26$1,195
-
2026-01-08historical $1,195
-
2026-01-03$1,195
-
2023-05-12soldstatus
-
2023-05-09soldstatus Closed 509-char remark
Show marketing remark (509 chars)
Turnkey remodel with an HAKC tenant at $1071/mo. 2021 Upgrades include: new windows, new roof, new gutters and exterior paint. New bathroom, new shower and all new bathroom tile. New LVP throughout, new laminate counters, new appliances, new led fixtures and doors. New furnace in 2022 New Stove in 2023. Nothing to do here but enjoy the cashflow. Other properties available MLS#s: 2426106,2425669,2419652,2419608,2419565,2420918,2419932,2419618,2418241 Listing agent has a financial interest in the property
-
2023-02-28status Pending 509-char remark
Show marketing remark (509 chars)
Turnkey remodel with an HAKC tenant at $1071/mo. 2021 Upgrades include: new windows, new roof, new gutters and exterior paint. New bathroom, new shower and all new bathroom tile. New LVP throughout, new laminate counters, new appliances, new led fixtures and doors. New furnace in 2022 New Stove in 2023. Nothing to do here but enjoy the cashflow. Other properties available MLS#s: 2426106,2425669,2419652,2419608,2419565,2420918,2419932,2419618,2418241 Listing agent has a financial interest in the property
-
2023-02-08$95,000 Active 509-char remark
Show marketing remark (509 chars)
Turnkey remodel with an HAKC tenant at $1071/mo. 2021 Upgrades include: new windows, new roof, new gutters and exterior paint. New bathroom, new shower and all new bathroom tile. New LVP throughout, new laminate counters, new appliances, new led fixtures and doors. New furnace in 2022 New Stove in 2023. Nothing to do here but enjoy the cashflow. Other properties available MLS#s: 2426106,2425669,2419652,2419608,2419565,2420918,2419932,2419618,2418241 Listing agent has a financial interest in the property
-
2021-06-09soldstatus
-
2021-06-08soldstatus
-
2018-01-30soldstatus
-
2008-08-01soldstatus 229-char remark
Show marketing remark (229 chars)
proof of funds required, no sellers disclosure, as is , seller makes no repairs, cash buyers, 1000 cert emd, allow few days for reply, special addendums apply, will be sent with accepted contract some info per tax role you verify
-
2008-06-16$7,500 229-char remark
Show marketing remark (229 chars)
proof of funds required, no sellers disclosure, as is , seller makes no repairs, cash buyers, 1000 cert emd, allow few days for reply, special addendums apply, will be sent with accepted contract some info per tax role you verify
-
2005-05-26soldstatus
-
2005-05-10soldstatus
-
2005-04-05soldstatus
-
2005-01-17$21,900
-
2002-06-24soldstatus
ⓘ Source: listings_history table (triggers on properties + properties_extension) + one-shot
backfill from property_details.listing_events for pre-trigger history.
Tax reassessment forecast MO · Resets to sale price
- Current annual tax
- $422 · $35/mo
- Projected year-2 tax
- $960 · $80/mo
- Expected delta
- +$539/yr (+$45/mo · 127.8%)
ⓘ Screening estimate from a state-policy table — verify with the county assessor before closing.
Climate risk First Street
- Flood 1/10 Low FEMA zone X (unshaded) · 0% chance over 30 yrs
- Wildfire 1/10 Low
- Heat 4/10 Moderate 7 d/yr ≥107°F today · 17 d/yr by 30 yrs out
- Wind 2/10 Low
- Air quality 3/10 Moderate 2 unhealthy d/yr today · 4 by 30 yrs out
Nearby sold comps map
Loading sold comps map…
Walkable amenities ~0.75 mi
Loading nearby amenities…
Taxation est. · year 1
- Rental income
- $14,277
- − Mortgage interest
- −$5,546
- − Property taxes
- −$422
- − Insurance
- −$495
- − Repairs & maintenance
- −$1,142
- − Management
- −$1,142
- − Depreciation
- −$2,880
- Taxable income
- $2,651
- Est. tax owed @ 24.0%
- −$636
- After-tax cash flow
- $3,496/yr
For passive investors: Depreciation is non-cash, so a rental often shows a tax loss while cash-flowing — sheltering income. Rental losses are passive: they offset passive income freely, and up to $25,000/yr can offset ordinary (W-2) income if you actively participate and your MAGI is under $100k (phasing out to $0 by $150k); unused losses carry forward. On sale, claimed depreciation is recaptured at up to 25%, and gains may owe capital-gains tax (a 1031 exchange can defer both). Figures are a year-1 estimate at your 24.0% rate — not tax advice; consult a CPA.
Schools (NCES district)
- District
- Kansas City 33
- NCES district ID
- 2916400
- Math proficiency
- 12% ▼ -8.00%
- Reading proficiency
- 24% ▬ 0.00%
- Median HH income
- $35,227
- Composite
- 14.8/100
- National rank
- #9387
- State rank
- #308 of 324 in MO
Livability — Kansas City
- Score
- 78/100
- State rank
- #28
- US rank
- #2671
Category grades
Schools grade is shown separately in the Schools card above.
Census & demographics
- Census place
- Kansas City, MO
- County
- Jackson County · 687,798 people
- City population
- 439,467
- Metro
- Kansas City, MO-KS
- Population (ZIP)
- 19,644
- Household income
- $42,221
- Rent vs Own
- Severe rent burden
- 1132.0
Population outlook (Jackson County) Hauer SSP2
- Today (2025)
- 719,589 people
- By 2030
- 731,456 · +1.6%
- By 2040
- 746,689 · +3.8%
- By 2050
- 749,289 · +4.1%
- By 2075
- 736,227 · +2.3%
- By 2100
- 668,210 · -7.1%
Race, ethnicity, and origin ACS 2023
- Neighborhood character
- Predominantly Black (80%)
- Race & ethnicity
- Black 80% White 9% Hispanic / Latino 8% Two or more races 6%
- Hispanic origin (detail)
- Mexican 5%
- Common ancestry
- Lithuanian 1% Swedish 0%
- Foreign-born
- 6% · Canada
- Languages at home
- 92% English-only · Spanish 7%
Political lean MEDSL · Jackson
- 2024 margin
- D (+19.3) · D 58.9% · R 39.5% · Other 1.6%
- 2008→2024 swing
- -6.1pp toward R · 2008: 25.4pp · 2024: 19.3pp
- All cycles
- 2024: D+19.3 2020: D+22.0 2016: D+16.6 2012: D+19.0 2008: D+25.4
Not yet ingested
- Civics
- —
Market trends
- HPI YoY
- ▼ -73.32%
- Current HPI
- 267.491
- Rent YoY
- ▲ 4.42%
- Metro
- Kansas City, MO-KS
- State GDP YoY
- ▲ 1.84%
- F500 in state
- 20
Industry mix (Fortune 500 HQ in MO)
| Industry | F500 HQs | Revenue |
|---|---|---|
| Healthcare | 1 | $163B |
|
||
| Insurance | 1 | $21B |
|
||
| Industrial Technology | 1 | $17B |
|
||
| Retail | 1 | $16B |
|
||
| Industrial Distribution | 1 | $10B |
|
||
| Utilities | 1 | $9B |
|
||
Price history
+352.1% since first listed22 events — show timeline
- 2026-05-29 Listed $99,000 Heartland MLS as Distributed by MLS Grid
- 2026-04-05 Rental Removed $1,045 APPFOLIO
- 2026-04-02 Price Changed $1,045 APPFOLIO
- 2026-02-21 Listed for Rent $1,095 APPFOLIO
- 2026-02-15 Rental Removed $1,195 APPFOLIO
- 2026-01-26 Listed for Rent $1,195 APPFOLIO
- 2026-01-08 Rental Removed $1,195 APPFOLIO
- 2026-01-03 Listed for Rent $1,195 APPFOLIO
- 2023-05-12 Sold (Public Records) — Public Records
- 2023-05-09 Sold (MLS) — Heartland MLS as Distributed by MLS Grid
- 2023-02-28 Pending — Heartland MLS as Distributed by MLS Grid
- 2023-02-08 Listed $95,000 Heartland MLS as Distributed by MLS Grid
- 2021-06-09 Sold (Public Records) — Public Records
- 2021-06-08 Sold (Public Records) — Public Records
- 2018-01-30 Sold (Public Records) — Public Records
- 2008-08-01 Sold (MLS) — Heartland MLS as Distributed by MLS Grid
- 2008-06-16 Listed $7,500 Heartland MLS as Distributed by MLS Grid
- 2005-05-26 Sold (Public Records) — Public Records
- 2005-05-10 Sold (Public Records) — Public Records
- 2005-04-05 Sold (MLS) — Heartland MLS as Distributed by MLS Grid
- 2005-01-17 Listed $21,900 Heartland MLS as Distributed by MLS Grid
- 2002-06-24 Sold (Public Records) — Public Records
Property tax history
+2.9%/yrLatest (2025): $422 · -53.1% YoY. Source: county tax records.
Cash-flow waterfall
monthlySold comps — $/sqft
last 12 mo · ≤1 miLoading sold comps…