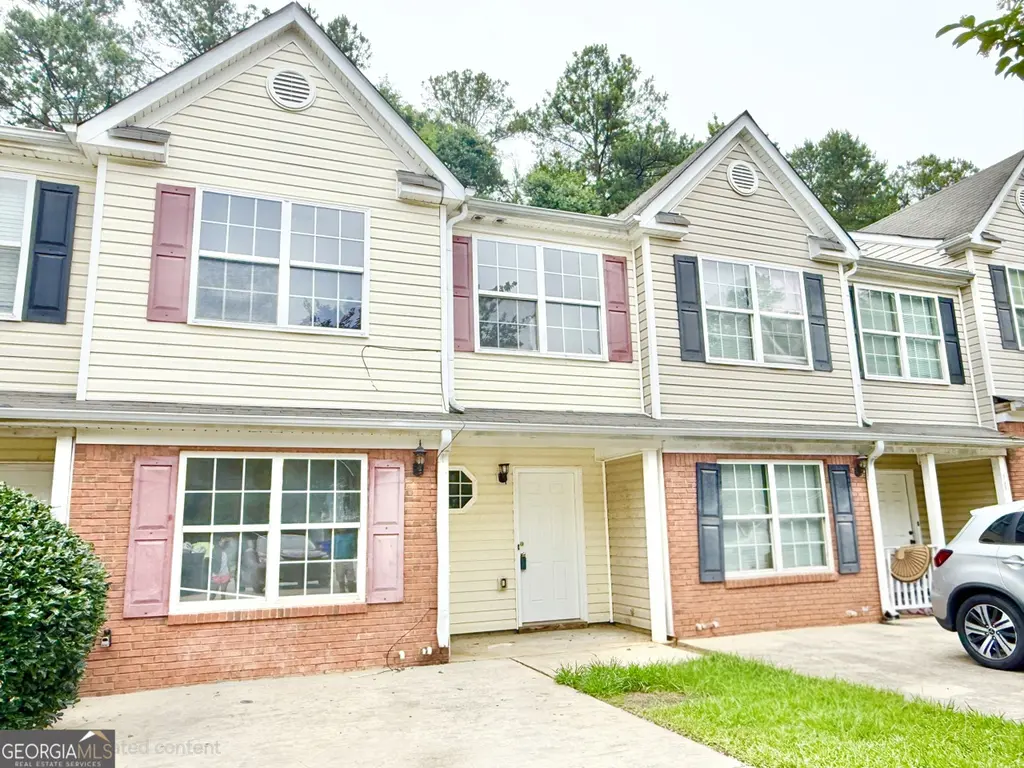
1425 Maple Valley Ct · Union City, GA
Flood risk 1/10 · Minimal
- FEMA flood zone
- X (unshaded)
- Chance of flooding over 30 yrs
- 0.0%
- Est. flood insurance / yr
- $507 – $1,088
Fire risk 3/10 · Minor
- Est. fire insurance / yr
- $963 – $1,789
Heat risk 6/10 · Moderate
- Hot days now (above 104°F)
- 7 days/yr
- Hot days in 30 yrs
- 19 days/yr
Wind risk 6/10 · Moderate
- Chance of severe wind over 30 yrs
- 27.0%
Air-quality risk 3/10 · Minor
- Unhealthy air days now
- 3 days/yr
- Unhealthy air days in 30 yrs
- 4 days/yr
Risk factors via First Street. Map © Google.
Why this score? — see what drove the C+ grade
The composite is a weighted blend of 9 inputs, each scored 0–100. Each bar is that input's sub-score; the figure is the points it added to the 100-point composite (weight × sub-score).
- Cash flow +16.6/30.0
- ARV discount +15.0/15.0
- Appreciation +10.0/10.0
- 1% rule +5.2/10.0
- DSCR +5.1/10.0
- Schools +4.5/10.0
- Rent growth +3.1/5.0
- Livability +2.9/5.0
- Condition / age +2.5/5.0
$189,900
🖨 Deal sheet 📄 Offer letter ✓ Due diligence
Listing remarks MLS
Mostly renovated two story fee simple townhome. All new flooring throughout and freshly painted. Spacious family room. Large master bedroom with 2 walk-in closets. Each guest bedroom have walk-in closets. This is a great deal at this low price! Priced thousands below any other home in this popular community. Only minutes to downtown & Historic Union City, the Atlanta Airport and, I-85.
Key facts
- Popular community
- New flooring
- Walk-in closets
Tags
Property features AI
Finance
- HOA & community: Homeowners association with a $70 monthly fee; Community features include sidewalks, street lights, nearby park, nearby schools, shopping, public transport
Exterior
- Parking: Driveway parking; Two total parking spaces; Open parking available
- Utilities: Public water; Public sewer; 220-volt electrical service; Cable available; Electricity available; Water available; Sewer available
- Home design: Two-level home; Updated/remodeled condition; Fee simple ownership
- Construction: Brick-front with vinyl siding; Composition roof
- Exterior features: Private yard; Garden; Patio
Interior
- Kitchen: Breakfast area; Pantry; Cabinets with other finishes; Other countertop surfaces; Open view to family room; Refrigerator; Electric range; Dishwasher; Garbage disposal
- Bedrooms: One main-level bedroom; Three upper-level bedrooms; Oversized master bedroom
- Flooring: Carpet; Luxury vinyl
- Bathrooms: Three full bathrooms; One full bathroom on main level; Two full bathrooms on upper level; Master bath with tub/shower combo
- Heating & cooling: Central heating; Central air; Ceiling fans
- Interior features: Entrance foyer; 9-ft ceilings on main and upper levels; Vaulted ceilings; High-speed internet; Walk-in closets; Double-pane windows; Window treatments; Shared walls with adjacent units (2+ common walls)
- Laundry & utility: Laundry located in hall on upper level
Neighborhood map
What this means for you Summary
Snapshot
- This is a 3-bed/3.0-bath townhouse listed at $190k.
Deal economics
- At list price, monthly cash flow is $114 ($1k/yr) — positive.
- The deal already cash-flows at list — no discount required.
- Meets the 1% rule at list price ($2k rent vs $190k).
- Recommended offer: $187k (1.5% below list) — sets the bar for market timing.
- Cap rate 7.0% vs local median 5.4% in Union City — top-decile yield for the area; either an underpriced asset or a hidden risk that comps aren't pricing in. Stress-test before assuming the spread holds.
Location & tenants
- Location reads 58/100 on livability (#443 in GA) — a working-class tenant base; expect higher turnover. Strengths: cost of living A+, housing A+; Watch: crime D+, amenities F, commute F.
- Fulton County (suburban): math 49% / reading 53% proficiency, ranked #12 of 174 in GA (top 7%) — acceptable for families but not a draw, mixed tenant base, ~2y average lease.
- Zoned schools: Campbell Elementary School (math 27% / reading 22%, grade F, #753 of 1,228 statewide, top 64%, 568 students, 100% FRL); Renaissance Middle School (math 22% / reading 27%, grade F, #301 of 470 statewide, top 66%, 1,166 students, 71% FRL); Creekside High School (math 30% / reading 24%, grade F, #160 of 424 statewide, top 38%, 1,768 students, 100% FRL) — zoned schools average 90% FRL vs 41% district-wide (49 pts higher); higher-poverty schools than district average — tighter screening recommended.
- Zoned-school proficiency averages 25% at this address vs 51% district-wide (-26 pts) — the specific schools serving this property underperform the Fulton County average; the district grade overstates school quality for this exact location.
- Market conditions: Rents rising (+2.2%/yr); 167 active listings in the ZIP; 18 comparable units currently listed for rent nearby; rentals at typical pace (median 24d on market — plan ~3-4 weeks tenant-placement turnaround); 11,565 units permitted in Fulton County in 2024 (8,159 in 5+ unit buildings).
Forward outlook
- In year one you build about $20k of equity ($1k loan paydown + $19k appreciation (10.0% local appreciation)).
- Fulton County population projected at +38% by 2050 — long-run rental-demand tailwind backs the buy-and-hold thesis.
- At projected returns (10.0% appreciation + 2.2% rent growth), your $53k cash investment doubles in ~3 years — after that, you're playing with house money.
- By year 2, paydown + projected appreciation supports a ~$33k cash-out refi (75% LTV) — recoverable capital for the next deal without selling this one.
Negotiation context
- It's been on market 17 days — a 2% lower offer ($187k) is reasonable based on typical stale-listing flexibility.
- 2 sale attempts with the ask held roughly flat each time — persistent listings suggest the price (not the market) is what's stuck; bring a comps-based counter.
Risks & watch-outs
- Climate carrying-cost: major wind risk, 27% chance of damaging wind over 30y; extreme-heat days projected 7→19/yr by 2055 (HVAC capex compounding) — expect insurance premiums to compound above CPI over the hold.
Questions for the listing agent
- What does the HOA fee cover, when was the last increase, and are there any pending special assessments or reserve-fund shortfalls?
- Is there a deadline driving the sale (1031 exchange, divorce, estate, relocation)? That informs how much negotiation room exists.
- Schools are F-rated, which usually means shorter tenancies and higher turnover. Who's the typical renter profile here, and what's been the actual vacancy rate?
- Crime grade is D in this area — have there been break-ins, vandalism, or insurance claims at this property in the last 3 years? What carrier currently insures it and at what premium?
- What's the average days-on-market for RENTAL listings here right now (not sales)? A rising rental-DOM trend means longer vacancies and softer asking-rent achievability than the comps imply.
- What's the recent tenant-quality profile in this submarket — average credit score on applications, eviction rate, late-payment / NSF rate, and stable-employment percentage? A property-management company in the area should have these aggregated.
- How much new for-sale + rental construction is in the pipeline within 1–3 miles? Heavy new supply typically softens prices + rents 12–24 months out; constrained supply supports both.
Investment metrics
- 1% rule
- 1.02% ✓
- Cap rate
- 7.01%
- Cash-on-cash
- 2.56%
- DSCR
- 1.11
- GRM
- 8.2
CMA / ARV
- ARV (on-the-fly)
- $292,050
- Comps found
- 12
Show comp detail 12 sales within ~0.75 mi
| Address | Dist | Beds/Ba | Sqft | Sold | Price | $/sf | Match |
|---|---|---|---|---|---|---|---|
| 300 Switcher Ct | 0.25mi | 4/2.5 (+1) | 1,817 (+3%) | 2mo | $299,900 | $165 | 75 |
| 298 Switcher Ct | 0.25mi | 4/2.5 (+1) | 1,817 (+3%) | 3mo | $299,000 | $165 | 75 |
| 296 Switcher Ct | 0.25mi | 4/2.5 (+1) | 1,817 (+3%) | 3mo | $299,900 | $165 | 74 |
| 302 Switcher Ct | 0.24mi | 4/2.5 (+1) | 1,817 (+3%) | 4mo | $299,900 | $165 | 74 |
| 175 Stanchion Dr | 0.27mi | 3/2.5 | 1,817 (+3%) | 9mo | $299,900 | $165 | 74 |
| 294 Switcher Ct | 0.26mi | 4/2.5 (+1) | 1,817 (+3%) | 3mo | $311,900 | $172 | 74 |
| 169 Stanchion Dr | 0.28mi | 3/2.5 | 1,817 (+3%) | 9mo | $299,900 | $165 | 73 |
| 280 Switcher Ct | 0.29mi | 4/2.5 (+1) | 1,817 (+3%) | 5mo | $311,900 | $172 | 70 |
| 189 Stanchion Dr | 0.25mi | 4/2.5 (+1) | 1,817 (+3%) | 9mo | $299,900 | $165 | 70 |
| 930 Parkway Rd | 0.23mi | 4/3.0 (+1) | 1,668 (-6%) | 7mo | $210,000 | $126 | 68 |
| 420 Camrose Ave | 0.33mi | 4/2.5 (+1) | 1,817 (+3%) | 9mo | $311,900 | $172 | 66 |
| 428 Camrose Ave | 0.34mi | 4/2.5 (+1) | 1,817 (+3%) | 9mo | $299,900 | $165 | 65 |
Match score weights: distance 35% · size 25% · config 20% · recency 20%. Top-matched comps best support the ARV.
Projected returns pro-forma
10.0% appreciation · 2.2% rent growth · sell at horizon
- IRR
- 25.8%
- Equity multiple
- 3.05×
- Total profit
- $109,208
- Equity at exit
- $171,077
- IRR
- 22.5%
- Equity multiple
- 6.89×
- Total profit
- $313,057
- Equity at exit
- $368,934
Cash invested: $53,172 (down + closing). Projections, not guarantees.
Landlord ↔ Tenant lean methodology
- Overall (STATE)
- 90 Strongly Landlord-Friendly
- State Georgia
- 90 Strongly Landlord-Friendly · R+3
- County
- — inherits STATE
- City
- — inherits STATE
ZIP-level market 30291
- Home prices YoY
- 11.1%
- Rents YoY
- 2.2%
- Active inventory
- 167
- Price-to-rent
- 8.2×
Monthly cashflow live
- Estimated rent
- $1,937 high interval (Pro) →
- Mortgage (P&I)
- −$996
- Tax from tax record
- −$272 /mo · $3,259/yr
- Insurance
- −$79
- HOA
- −$70
- Vacancy / Maint / Mgmt
- −$407
- Net cashflow
- $114
Break-even live
UW: 25.0% down · 7.5% · 30yr · 1.5% tax · 5.0% vac · 8.0% maint · 8.0% mgmt
Financing live
Cash to close
- Down payment
- $47,475
- Closing costs
- $5,697
- Reserves months
- —
- Total cash needed
- —
Loan-product check · same deal, 3 products live
Conventional
25% down · 7.5% · 30yr
- Down + closing
- —
- Monthly P&I
- —
- Monthly cashflow
- —
- DSCR
- —
- Eligible?
- —
Personal DTI + credit; lowest rate.
DSCR
20% down · 8.5% · 30yr
- Down + closing
- —
- Monthly P&I
- —
- Monthly cashflow
- —
- DSCR
- —
- Eligible?
- —
No personal income docs; deal must DSCR.
Hard money
10% down · 12.0% · 12mo
- Down + closing
- —
- Monthly P&I
- —
- Monthly cashflow
- —
- DSCR
- —
- Eligible?
- —
Short-term bridge; refi at stabilization.
Rent comps 18 comps
| Address | Beds | Baths | Sqft | Rent | $/sqft | DOM | Units | Dist |
|---|---|---|---|---|---|---|---|---|
| 1065 Maple Valley Ct Union City, GA | 3.0 | 2.5 | 1456 | $1,600 | $1.10 | 43d | 1 | 0.21mi |
| 460 Parkway Rd Unit 460 Union City, GA | 3.0 | 2.5 | 1678 | $1,750 | $1.04 | 24d | 1 | 0.26mi |
| 700 Parkway Rd Union City, GA | 3.0 | 2.5 | 1770 | $1,795 | $1.01 | 19d | 1 | 0.27mi |
| 340 Parkway Rd #340 Union City, GA | 3.0 | 2.5 | 1456 | $1,750 | $1.20 | 3d | 1 | 0.30mi |
| 100 Spring Ct Fairburn, GA | 2.0 | 1.0 | 1900 | $1,075 | $0.57 | 24d | 1 | 0.67mi |
| 6045 Capitol Knl Fairburn, GA | 3.0 | 2.5 | 1366 | $1,600 | $1.17 | 43d | 1 | 1.01mi |
| 5205 Alexander St Union City, GA | 3.0 | 2.0 | 1326 | $1,681 | $1.27 | 43d | 1 | 1.05mi |
| 6540 Capitol Knl Fairburn, GA | 3.0 | 3.5 | 1458 | $1,920 | $1.32 | 5d | 1 | 1.07mi |
| 5201 Summer Brooke Ct Union City, GA | 3.0 | 2.5 | 1484 | $2,000 | $1.35 | 1d | 1 | 1.09mi |
| 6325 Raymond Ter Union City, GA | 2.0 | 1.0 | 1624 | $1,150 | $0.71 | 43d | 1 | 1.17mi |
| 6340 Westbrook Ave Union City, GA | 3.0 | 2.0 | 1800 | $2,100 | $1.17 | 43d | 1 | 1.29mi |
| 5207 Dixie Lake Rd Union City, GA | 3.0 | 2.0 | 1516 | $1,950 | $1.29 | 43d | 1 | 1.36mi |
| 330 Avalon Sq Fairburn, GA | 3.0 | 2.5 | 2047 | $2,950 | $1.44 | 24d | 1 | 1.39mi |
| 200 Dodd St Fairburn, GA | 3.0 | 2.0 | 1300 | $1,685 | $1.30 | 43d | 1 | 1.44mi |
| 7599 Avalon Blvd Fairburn, GA | 3.0 | 2.5 | 1648 | $2,039 | $1.24 | 2d | 1 | 1.44mi |
| 5472 Festival Ave Fairburn, GA | 3.0 | 2.5 | 1640 | $2,100 | $1.28 | 5d | 1 | 1.47mi |
| 5472 Festival Ave Fairburn, GA | 3.0 | 2.5 | 1640 | $2,100 | $1.28 | 12d | 1 | 1.47mi |
| 152 Rivertown Rd Fairburn, GA | 3.0 | 2.0 | 1550 | $3,500 | $2.26 | 22d | 1 | 1.48mi |
HOA detail
- Monthly dues
- $70 · $840/yr
Listing history 13 events
-
2026-06-18days on market $189,900 Active 17 DOM
-
2026-06-17days on market $189,900 Active 16 DOM
-
2026-06-16days on market $189,900 Active 15 DOM
-
2026-06-15price $189,900 Active 14 DOM
-
2026-06-15days on market $192,500 Active 14 DOM
-
2026-06-13days on market $192,500 Active 12 DOM
-
2026-06-09days on market $192,500 Active 8 DOM
-
2026-06-08days on market $192,500 Active 7 DOM
-
2026-06-07days on market $192,500 Active 6 DOM
-
2026-06-04days on market $192,500 Active 3 DOM
-
2026-06-03days on market $192,500 Active 2 DOM
-
2026-06-02remarks 390-char remark
-
2026-06-02$192,500 Active 1 DOM
ⓘ Source: listings_history table (triggers on properties + properties_extension) + one-shot
backfill from property_details.listing_events for pre-trigger history.
Tax reassessment forecast GA · Resets to sale price
- Current annual tax
- $3,259 · $272/mo
- Projected year-2 tax
- $3,259 · $272/mo
- Expected delta
- $0/yr ($0/mo · 0.0%)
ⓘ Screening estimate from a state-policy table — verify with the county assessor before closing.
Climate risk First Street
- Flood 1/10 Low FEMA zone X (unshaded) · 0% chance over 30 yrs
- Wildfire 3/10 Moderate
- Heat 6/10 Major 7 d/yr ≥104°F today · 19 d/yr by 30 yrs out
- Wind 6/10 Major 27% chance of damaging wind over 30 yrs
- Air quality 3/10 Moderate 3 unhealthy d/yr today · 4 by 30 yrs out
Nearby sold comps map
Loading sold comps map…
Walkable amenities ~0.75 mi
Loading nearby amenities…
Taxation est. · year 1
- Rental income
- $23,243
- − Mortgage interest
- −$10,637
- − Property taxes
- −$3,259
- − Insurance
- −$950
- − Repairs & maintenance
- −$1,859
- − Management
- −$1,859
- − HOA
- −$840
- − Depreciation
- −$5,524
- Taxable loss
- −$1,686
- Est. tax savings @ 24.0%
- +$405
- After-tax cash flow
- $1,768/yr
For passive investors: Depreciation is non-cash, so a rental often shows a tax loss while cash-flowing — sheltering income. Rental losses are passive: they offset passive income freely, and up to $25,000/yr can offset ordinary (W-2) income if you actively participate and your MAGI is under $100k (phasing out to $0 by $150k); unused losses carry forward. On sale, claimed depreciation is recaptured at up to 25%, and gains may owe capital-gains tax (a 1031 exchange can defer both). Figures are a year-1 estimate at your 24.0% rate — not tax advice; consult a CPA.
Schools (NCES district)
- District
- Fulton County
- NCES district ID
- 1302280
- Math proficiency
- 49% ▼ -2.00%
- Reading proficiency
- 53% ▬ 0.00%
- Median HH income
- $68,035
- Composite
- 45.33/100
- National rank
- #2640
- State rank
- #12 of 174 in GA
Livability — Union City
- Score
- 58/100
- State rank
- #443
- US rank
- #21281
Category grades
Schools grade is shown separately in the Schools card above.
Census & demographics
- Census place
- Union City, GA
- County
- Fulton County · 1,094,430 people
- City population
- 25,130
- Metro
- Atlanta-Sandy Springs-Alpharetta, GA
- Population (ZIP)
- 25,130
- Household income
- $48,184
- Rent vs Own
- Severe rent burden
- 1778.0
Population outlook (Fulton County) Hauer SSP2
- Today (2025)
- 1,203,707 people
- By 2030
- 1,299,706 · +8.0%
- By 2040
- 1,488,256 · +23.6%
- By 2050
- 1,664,580 · +38.3%
- By 2075
- 2,036,072 · +69.2%
- By 2100
- 2,222,402 · +84.6%
Race, ethnicity, and origin ACS 2023
- Neighborhood character
- Predominantly Black (86%)
- Race & ethnicity
- Black 86% Hispanic / Latino 7% Two or more races 6% White 3%
- Hispanic origin (detail)
- Mexican 4%
- Common ancestry
- Italian 1%
- Foreign-born
- 5% · Canada
- Languages at home
- 92% English-only · Spanish 6%
Political lean MEDSL · Fulton
- 2024 margin
- Solid D (+44.9) · D 71.9% · R 27.0% · Other 1.1%
- 2008→2024 swing
- +9.8pp toward D · 2008: 35.0pp · 2024: 44.9pp
- All cycles
- 2024: D+44.9 2020: D+46.4 2016: D+42.1 2012: D+29.6 2008: D+35.0
Not yet ingested
- Civics
- —
Market trends
- HPI YoY
- ▲ 23.98%
- Current HPI
- 239.3471
- Rent YoY
- ▲ 2.20%
- Metro
- Atlanta-Sandy Springs-Alpharetta, GA
- State GDP YoY
- ▲ 2.66%
- F500 in state
- 28
Industry mix (Fortune 500 HQ in GA)
| Industry | F500 HQs | Revenue |
|---|---|---|
| Paper / Packaging | 2 | $29B |
|
||
| Retail | 1 | $160B |
|
||
| Transportation / Logistics | 1 | $91B |
|
||
| Airlines | 1 | $62B |
|
||
| Consumer Goods | 1 | $47B |
|
||
| Utilities | 1 | $25B |
|
||
Price history
+0.0% since first listed2 events — show timeline
- 2026-06-01 Listed $192,500 GAMLS
- 2026-06-01 Listed $192,500 FMLS
Property tax history
+5.2%/yrLatest (2025): $3,259 · +110.9% YoY. Source: county tax records.
Cash-flow waterfall
monthlySold comps — $/sqft
last 12 mo · ≤1 miLoading sold comps…