 7-Plex
1017 SW 154th St · Burien, WA
Flood risk 6/10 · Moderate
- FEMA flood zone
- X (unshaded)
- Chance of flooding over 30 yrs
- 0.73%
- Est. flood insurance / yr
- $507 – $1,088
Fire risk 1/10 · Minimal
- Est. fire insurance / yr
- $604 – $1,122
Heat risk 3/10 · Minor
- Hot days now (above 86°F)
- 7 days/yr
- Hot days in 30 yrs
- 15 days/yr
Wind risk 1/10 · Minimal
- Chance of severe wind over 30 yrs
- —
Air-quality risk 7/10 · Major
- Unhealthy air days now
- 9 days/yr
- Unhealthy air days in 30 yrs
- 12 days/yr
Risk factors via First Street. Map © Google.
Why this score? — see what drove the D grade
The composite is a weighted blend of 9 inputs, each scored 0–100. Each bar is that input's sub-score; the figure is the points it added to the 100-point composite (weight × sub-score).
- Cash flow +12.8/30.0
- ARV discount +7.1/15.0
- Livability +4.0/5.0
- Schools +3.9/10.0
- DSCR +3.8/10.0
- Rent growth +3.5/5.0
- 1% rule +3.3/10.0
- Condition / age +2.5/5.0
- Appreciation +0.0/10.0
$1,925,000
🖨 Deal sheet 📄 Offer letter ✓ Due diligence
Multi-family units
County records classify this as Multi-Family (5+ Unit). Listing-text estimate: 7 units. confirmed
5+ unit building — per-unit beds/baths from public records are typically unavailable; the breakdown below (if shown) is an estimate from the listing text.
Listing remarks
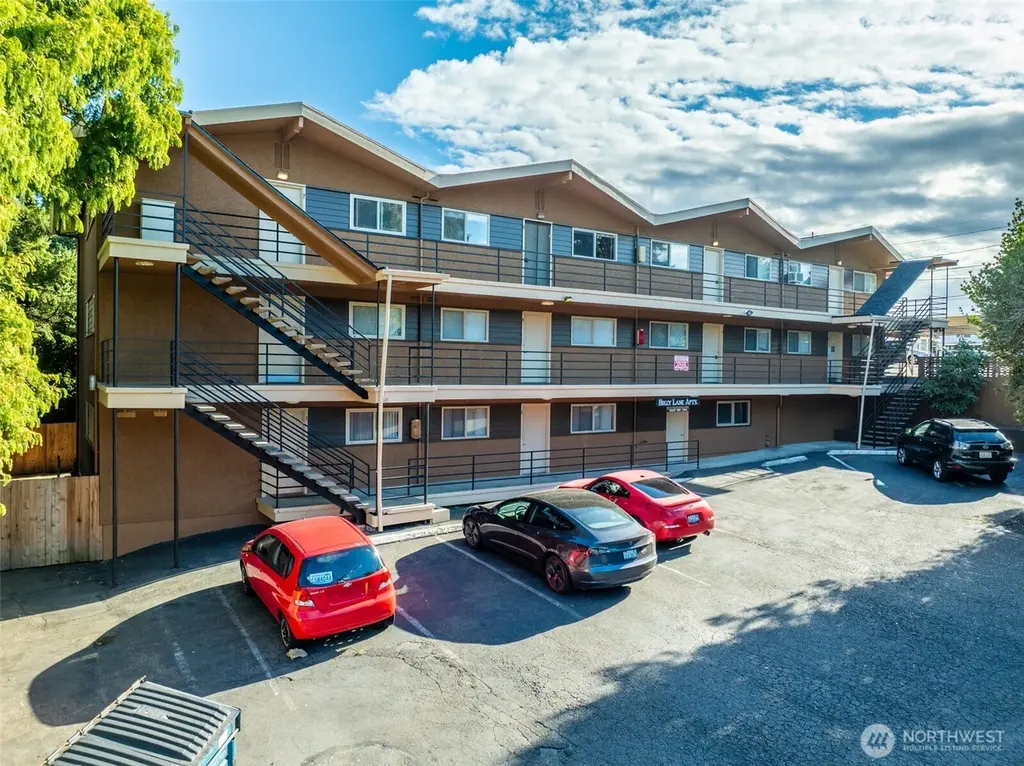
Built in 1967, the Holly Lane Apartments sit on a 12,846 sqft lot in a peaceful lakeside neighborhood in the heart of downtown Burien. The building is comprised of 10 spacious two-bedroom/one-bathroom floor plans that average 925 sqft. The apartments have functional layouts, abundant storage, complete kitchen appliance packages, and private balconies/patios. The units have been well maintained with a mix of “classic” interior finishes and light updates such as LVP flooring and appliances. Building features and amenity spaces include a very large common laundry area on the lower level, secure resident and manager/owner storage lockers and a large office space suitable for a prope
Key facts
- Common laundry area
- Large office space
- 0.29 acre lot
Tags
Neighborhood map
What this means for you Summary
Snapshot
- This is a 7 × 3-bed/?-bath units multifamily listed at $1.93M.
Deal economics
- At list price, monthly cash flow is $-165 ($-2k/yr) — negative. Per door: $-24/mo.
- To cash-flow at today's rent, offer at most $1.90M (1.5% below list).
- To meet the 1% rule (rent ≥ 1% of price), the offer needs to be $1.59M (17.4% below list).
- Recommended offer: $1.59M (17.4% below list) — sets the bar for 1% rule.
- Cap rate 6.2% vs local median 2.1% in Burien — top-decile yield for the area; either an underpriced asset or a hidden risk that comps aren't pricing in. Stress-test before assuming the spread holds.
Location & tenants
- Location reads 79/100 on livability (#115 in WA, #2,330 nationally) — a middle-class / working-renter tenant base. Strengths: amenities A+, commute A+, health & safety A+; Watch: schools D+, crime F, cost of living F.
- Highline School District (suburban): math 36% / reading 49% proficiency, ranked #200 of 291 in WA (top 69%) — families likely to look elsewhere, expect single-tenant / working-renter base with shorter leases.
- Market conditions: Rents rising (+4.0%/yr); 106 active listings in the ZIP; high-income renter base; 10,555 units permitted in King County in 2024 (7,119 in 5+ unit buildings).
- At $15,907/mo this rent would consume 166% of the median local household income ($115k/yr) (locally 577% of renters already pay >50% of income on rent) — very limited rent-growth headroom before tenants either downsize or default.
Forward outlook
- Local home prices are declining (-3.0%/yr); year-one equity from $13k of loan paydown is wiped out by about $58k of value loss. Plan a longer hold.
- King County population projected at +44% by 2050 — long-run rental-demand tailwind backs the buy-and-hold thesis.
Negotiation context
- It's been on market 139 days — a 12% lower offer ($1.69M) is reasonable based on typical stale-listing flexibility.
- Current owner paid $910k; list at $1.93M implies a 112% gain — meaningful room to come down on a strong offer.
Risks & watch-outs
- Climate carrying-cost: major flood risk — expect insurance premiums to compound above CPI over the hold.
Questions for the listing agent
- What do current leases actually rent for vs. the listed asking? Can we see a recent rent roll and the last 12 months of T-12 income?
- It's been on market 139 days. Have you received any prior offers? Is the seller open to a 17% concession, seller financing, or rate buy-down credit?
- Can we see the unit-by-unit rent roll, current vacancy, and any below-market leases? What's the average tenancy length?
- What capital expenditures (roof, boiler, parking lot, exteriors) have been made in the last 5 years, and what's planned in the next 2?
- Built in 1967 — when were the roof, HVAC, electrical panel, plumbing, and water heater last replaced?
- Why hasn't it sold? Are there any deal-killer items the seller is aware of (foundation, flood, title, zoning, code violations)?
- Is there a deadline driving the sale (1031 exchange, divorce, estate, relocation)? That informs how much negotiation room exists.
- Schools are D-rated, which usually means shorter tenancies and higher turnover. Who's the typical renter profile here, and what's been the actual vacancy rate?
- Crime grade is F in this area — have there been break-ins, vandalism, or insurance claims at this property in the last 3 years? What carrier currently insures it and at what premium?
- The area grade is low — what's the realistic commute time and amenity access for the typical tenant pool here? Any planned neighborhood developments (good or bad) we should know about?
- What's the average days-on-market for RENTAL listings here right now (not sales)? A rising rental-DOM trend means longer vacancies and softer asking-rent achievability than the comps imply.
- What's the recent tenant-quality profile in this submarket — average credit score on applications, eviction rate, late-payment / NSF rate, and stable-employment percentage? A property-management company in the area should have these aggregated.
- How much new apartment / multifamily construction is in the pipeline within 1–3 miles? Heavy new supply (>2% of stock underway) typically softens rents 12–24 months out; light construction supports rent growth.
Investment metrics
- 1% rule
- 0.83% ✗
- Cap rate
- 6.19%
- Cash-on-cash
- -0.37%
- DSCR
- 0.98
- GRM
- 10.1
CMA / ARV
- ARV (median comp)
- $1,906,250
- List price
- $1,925,000
- Delta
- 0.98%
- Verdict
- FAIR
- Comps
- 4 within 1.0 mi
Projected returns pro-forma
-3.0% appreciation · 3.96% rent growth · sell at horizon
- IRR
- -15.9%
- Equity multiple
- 0.43×
- Total profit
- $-307,047
- Equity at exit
- $287,024
- IRR
- -6.0%
- Equity multiple
- 0.60×
- Total profit
- $-216,456
- Equity at exit
- $166,439
Cash invested: $539,000 (down + closing). Projections, not guarantees.
Landlord ↔ Tenant lean methodology
- Overall (STATE)
- 28 Tenant-Leaning
- State Washington
- 28 Tenant-Leaning · D+8
- County
- — inherits STATE
- City
- — inherits STATE
ZIP-level market 98166
- Rents YoY
- 4.0%
- Active inventory
- 106
- Price-to-rent
- 70.6×
Monthly cashflow live
- Estimated rent
- $15,907 high interval (Pro) →
- Mortgage (P&I)
- −$10,095
- Tax from tax record
- −$1,835 /mo · $22,015/yr
- Insurance
- −$802
- HOA
- −$0
- Vacancy / Maint / Mgmt
- −$3,340
- Net cashflow
- $-165
Break-even live
7-unit breakdown (identical units grouped — click to expand)
| Units | Beds | Baths | Est. rent |
|---|---|---|---|
| 7× units | 3 | — | $15,904 |
| #1 | 3 | — | $2,272 |
| #2 | 3 | — | $2,272 |
| #3 | 3 | — | $2,272 |
| #4 | 3 | — | $2,272 |
| #5 | 3 | — | $2,272 |
| #6 | 3 | — | $2,272 |
| #7 | 3 | — | $2,272 |
| Total (7 units) | $15,907 | ||
UW: 25.0% down · 7.5% · 30yr · 1.5% tax · 5.0% vac · 8.0% maint · 8.0% mgmt
Financing live
Cash to close
- Down payment
- $481,250
- Closing costs
- $57,750
- Reserves months
- —
- Total cash needed
- —
Loan-product check · same deal, 3 products live
Conventional
25% down · 7.5% · 30yr
- Down + closing
- —
- Monthly P&I
- —
- Monthly cashflow
- —
- DSCR
- —
- Eligible?
- —
Personal DTI + credit; lowest rate.
DSCR
20% down · 8.5% · 30yr
- Down + closing
- —
- Monthly P&I
- —
- Monthly cashflow
- —
- DSCR
- —
- Eligible?
- —
No personal income docs; deal must DSCR.
Hard money
10% down · 12.0% · 12mo
- Down + closing
- —
- Monthly P&I
- —
- Monthly cashflow
- —
- DSCR
- —
- Eligible?
- —
Short-term bridge; refi at stabilization.
Listing history 11 events
-
2026-06-18days on market $1,925,000 Active 139 DOM
-
2026-06-17days on market $1,925,000 Active 138 DOM
-
2026-06-16days on market $1,925,000 Active 137 DOM
-
2026-06-15days on market $1,925,000 Active 136 DOM
-
2026-06-13days on market $1,925,000 Active 134 DOM
-
2026-06-09days on market $1,925,000 Active 130 DOM
-
2026-06-08days on market $1,925,000 Active 129 DOM
-
2026-06-07statusdays on market $1,925,000 Active 128 DOM
-
2026-05-07status Pending
-
2026-01-02$1,925,000 Active
-
2014-12-15soldstatus $909,500
ⓘ Source: listings_history table (triggers on properties + properties_extension) + one-shot
backfill from property_details.listing_events for pre-trigger history.
Tax reassessment forecast WA · Resets to sale price
- Current annual tax
- $22,015 · $1,835/mo
- Projected year-2 tax
- $22,015 · $1,835/mo
- Expected delta
- $0/yr ($0/mo · 0.0%)
ⓘ Screening estimate from a state-policy table — verify with the county assessor before closing.
Climate risk First Street
- Flood 6/10 Major FEMA zone X (unshaded) · 73% chance over 30 yrs
- Wildfire 1/10 Low
- Heat 3/10 Moderate 7 d/yr ≥86°F today · 15 d/yr by 30 yrs out
- Wind 1/10 Low
- Air quality 7/10 Severe 9 unhealthy d/yr today · 12 by 30 yrs out
Nearby sold comps map
Loading sold comps map…
Walkable amenities ~0.75 mi
Loading nearby amenities…
Taxation est. · year 1
- Rental income
- $190,884
- − Mortgage interest
- −$107,830
- − Property taxes
- −$22,015
- − Insurance
- −$9,625
- − Repairs & maintenance
- −$15,271
- − Management
- −$15,271
- − Depreciation
- −$56,000
- Taxable loss
- −$35,128
- Est. tax savings @ 24.0%
- +$8,431
- After-tax cash flow
- $6,450/yr
For passive investors: Depreciation is non-cash, so a rental often shows a tax loss while cash-flowing — sheltering income. Rental losses are passive: they offset passive income freely, and up to $25,000/yr can offset ordinary (W-2) income if you actively participate and your MAGI is under $100k (phasing out to $0 by $150k); unused losses carry forward. On sale, claimed depreciation is recaptured at up to 25%, and gains may owe capital-gains tax (a 1031 exchange can defer both). Figures are a year-1 estimate at your 24.0% rate — not tax advice; consult a CPA.
Schools (NCES district)
- District
- Highline School District
- NCES district ID
- 5303540
- Math proficiency
- 36% ▼ -4.00%
- Reading proficiency
- 49% ▼ -1.00%
- Median HH income
- $52,697
- Composite
- 39.12/100
- National rank
- #8245
- State rank
- #200 of 291 in WA
Livability — Burien
- Score
- 79/100
- State rank
- #115
- US rank
- #2330
Category grades
Schools grade is shown separately in the Schools card above.
Census & demographics
- Census place
- Burien, WA
- County
- King County · 2,251,916 people
- City population
- 60,370
- Metro
- Seattle-Tacoma-Bellevue, WA
- Population (ZIP)
- 22,082
- Household income
- $114,969
- Rent vs Own
- Severe rent burden
- 577.0
Population outlook (King County) Hauer SSP2
- Today (2025)
- 2,576,485 people
- By 2030
- 2,803,316 · +8.8%
- By 2040
- 3,255,921 · +26.4%
- By 2050
- 3,706,444 · +43.9%
- By 2075
- 4,746,063 · +84.2%
- By 2100
- 5,407,730 · +109.9%
Race, ethnicity, and origin ACS 2023
- Neighborhood character
- Predominantly White (69%)
- Race & ethnicity
- White 69% Hispanic / Latino 12% Two or more races 11% Asian 8% Black 2%
- Hispanic origin (detail)
- Mexican 5%
- Common ancestry
- Portuguese 5% Slovak 3% Lithuanian 3%
- Foreign-born
- 13% · Canada, Vietnam, South Korea
- Languages at home
- 85% English-only · Spanish 7% Other Indo-European 1% Vietnamese 1%
Political lean MEDSL · King
- 2024 margin
- Solid D (+51.7) · D 74.2% · R 22.5% · Other 3.4%
- 2008→2024 swing
- +9.6pp toward D · 2008: 42.1pp · 2024: 51.7pp
- All cycles
- 2024: D+51.7 2020: D+52.7 2016: D+50.4 2012: D+39.9 2008: D+42.1
Not yet ingested
- Civics
- —
Market trends
- HPI YoY
- ▼ -854.15%
- Current HPI
- 332.6728
- Rent YoY
- ▲ 3.96%
- Metro
- Seattle-Tacoma-Bellevue, WA
- State GDP YoY
- ▲ 4.65%
- F500 in state
- 22
Industry mix (Fortune 500 HQ in WA)
| Industry | F500 HQs | Revenue |
|---|---|---|
| Retail | 2 | $269B |
|
||
| Technology / Retail | 1 | $638B |
|
||
| Technology | 1 | $245B |
|
||
| Telecommunications | 1 | $38B |
|
||
| Food / Beverage | 1 | $36B |
|
||
| Automotive / Trucks | 1 | $34B |
|
||
Price history
+111.7% since first listed3 events — show timeline
- 2026-05-07 Pending — NWMLS as Distributed by MLS Grid
- 2026-01-02 Listed $1,925,000 NWMLS as Distributed by MLS Grid
- 2014-12-15 Sold (Public Records) $909,500 Public Records
Property tax history
+5.8%/yrLatest (2025): $22,015 · -7.3% YoY. Source: county tax records.
Cash-flow waterfall
monthlySold comps — $/sqft
last 12 mo · ≤1 miLoading sold comps…