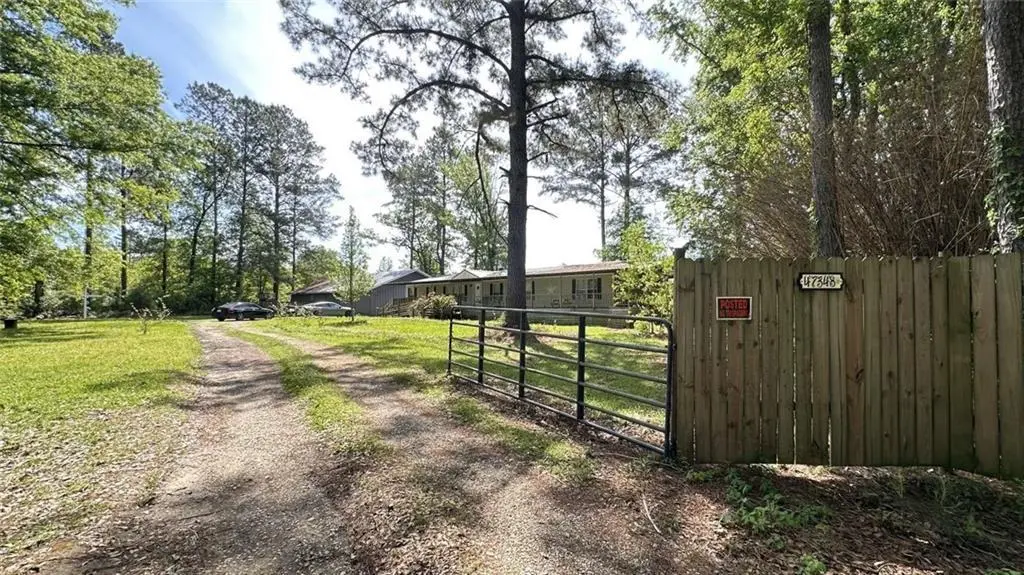
47348 Durbin Rd · Albany, LA
Flood risk 1/10 · Minimal
- FEMA flood zone
- X (unshaded)
- Chance of flooding over 30 yrs
- 0.0%
- Est. flood insurance / yr
- $507 – $1,088
Fire risk 7/10 · Major
- Est. fire insurance / yr
- $1,269 – $2,357
Heat risk 8/10 · Major
- Hot days now (above 109°F)
- 7 days/yr
- Hot days in 30 yrs
- 20 days/yr
Wind risk 9/10 · Severe
- Chance of severe wind over 30 yrs
- 99.0%
Air-quality risk 2/10 · Minimal
- Unhealthy air days now
- 0 days/yr
- Unhealthy air days in 30 yrs
- 1 days/yr
Risk factors via First Street. Map © Google.
Why this score? — see what drove the B grade
The composite is a weighted blend of 9 inputs, each scored 0–100. Each bar is that input's sub-score; the figure is the points it added to the 100-point composite (weight × sub-score).
- Cash flow +26.6/30.0
- ARV discount +15.0/15.0
- DSCR +9.1/10.0
- Appreciation +6.8/10.0
- 1% rule +6.2/10.0
- Livability +3.9/5.0
- Rent growth +2.5/5.0
- Condition / age +2.5/5.0
- Schools +2.0/10.0
$159,900
🖨 Deal sheet 📄 Offer letter ✓ Due diligence
Listing remarks MLS
Beautiful Mobile Home property located in Tickfaw! A 4 Bedroom 2 Bath with 2,079 Living Sq Ft situated on a 2.7 Acre lot in a quiet neighborhood in the Woodhaven area. In great condition and ready to move in! Access is flexible!
Key facts
- 2.7 acre lot
- Built 2002
- Listed 40 days
Neighborhood map
What this means for you Summary
Snapshot
- This is a 4-bed/2.0-bath single-family listed at $160k.
Deal economics
- At list price, monthly cash flow is $429 ($5k/yr) — positive.
- The deal already cash-flows at list — no discount required.
- Meets the 1% rule at list price ($2k rent vs $160k).
- Recommended offer: $155k (3.0% below list) — sets the bar for market timing.
- Cap rate 9.5% vs local median 4.5% in Albany — top-decile yield for the area; either an underpriced asset or a hidden risk that comps aren't pricing in. Stress-test before assuming the spread holds.
Location & tenants
- Location reads 77/100 on livability (#12 in LA, #3,099 nationally) — a middle-class / working-renter tenant base. Strengths: schools A+, cost of living A+, housing A+; Watch: amenities F, commute F.
- Tangipahoa Parish (rural): math 18% / reading 29% proficiency, ranked #63 of 98 in LA (top 64%) — low school quality limits family demand, transient renter base, plan for 1-2y turnover; 73% free/reduced lunch — lower-income household profile, screen leases tightly.
- Market conditions: 69 active listings in the ZIP; 1,085 units permitted in Tangipahoa Parish in 2024 (378 in 5+ unit buildings).
Forward outlook
- In year one you build about $7k of equity ($1k loan paydown + $6k appreciation (3.6% local appreciation)).
- Tangipahoa County population projected at +22% by 2050 — long-run rental-demand tailwind backs the buy-and-hold thesis.
- At projected returns (3.6% appreciation + 3.0% rent growth), your $45k cash investment doubles in ~4 years — after that, you're playing with house money.
- By year 6, paydown + projected appreciation supports a ~$37k cash-out refi (75% LTV) — recoverable capital for the next deal without selling this one.
Negotiation context
- It's been on market 40 days — a 3% lower offer ($155k) is reasonable based on typical stale-listing flexibility.
- 4 sale attempts since 7y ago with the ask held roughly flat each time — persistent listings suggest the price (not the market) is what's stuck; bring a comps-based counter.
Risks & watch-outs
- Climate carrying-cost: severe wind risk, 99% chance of damaging wind over 30y; major wildfire risk; extreme-heat days projected 7→20/yr by 2055 (HVAC capex compounding) — expect insurance premiums to compound above CPI over the hold.
Questions for the listing agent
- It's been on market 40 days. Have you received any prior offers? Is the seller open to a 3% concession, seller financing, or rate buy-down credit?
- Is there a deadline driving the sale (1031 exchange, divorce, estate, relocation)? That informs how much negotiation room exists.
- Schools are A-rated — typically a magnet for longer-tenancy family renters. What's the average tenant stay here, and is there a school-zone premium baked into asking?
- What's the average days-on-market for RENTAL listings here right now (not sales)? A rising rental-DOM trend means longer vacancies and softer asking-rent achievability than the comps imply.
- What's the recent tenant-quality profile in this submarket — average credit score on applications, eviction rate, late-payment / NSF rate, and stable-employment percentage? A property-management company in the area should have these aggregated.
- How much new for-sale + rental construction is in the pipeline within 1–3 miles? Heavy new supply typically softens prices + rents 12–24 months out; constrained supply supports both.
Investment metrics
- 1% rule
- 1.12% ✓
- Cap rate
- 9.51%
- Cash-on-cash
- 11.51%
- DSCR
- 1.51
- GRM
- 7.4
CMA / ARV
- ARV (median comp)
- $257,032
- List price
- $159,900
- Delta
- -37.79%
- Verdict
- UNDERPRICED
- Comps
- 20 within 1.0 mi
Show comp detail 12 sales within ~0.75 mi
| Address | Dist | Beds/Ba | Sqft | Sold | Price | $/sf | Match |
|---|---|---|---|---|---|---|---|
| 47382 Shady Acres Rd | 0.15mi | 3/2.0 (-1) | 2,040 (-4%) | 13mo | $328,000 | $161 | 70 |
| 48076 Woodhaven Rd | 0.32mi | 3/2.0 (-1) | 2,108 (-1%) | 20mo | $298,400 | $142 | 62 |
| 10199 Crystal Ln | 0.47mi | 4/2.0 | 1,825 (-14%) | 9mo | $280,900 | $154 | 47 |
| 10187 Pearl Ln | 0.60mi | 4/2.0 | 1,825 (-14%) | 3mo | $259,000 | $142 | 46 |
| 10205 Pearl Ln | 0.60mi | 4/2.0 | 1,825 (-14%) | 3mo | $234,900 | $129 | 46 |
| 10188 Crystal Ln | 0.60mi | 4/2.0 | 1,825 (-14%) | 3mo | $259,900 | $142 | 46 |
| 10212 Crystal Ln | 0.60mi | 4/2.0 | 1,825 (-14%) | 8mo | $267,990 | $147 | 42 |
| 10179 Pearl Ln | 0.67mi | 4/2.0 | 1,819 (-14%) | 6mo | $273,900 | $151 | 40 |
| 10130 Crystal Ln | 0.60mi | 4/2.0 | 1,819 (-14%) | 12mo | $274,535 | $151 | 38 |
| 10170 Crystal Ln | 0.60mi | 4/2.0 | 1,819 (-14%) | 12mo | $280,900 | $154 | 38 |
| 10139 Crystal Ln | 0.60mi | 4/2.0 | 1,819 (-14%) | 12mo | $271,900 | $149 | 38 |
| 10165 Crystal Ln | 0.60mi | 4/2.0 | 1,819 (-14%) | 14mo | $278,580 | $153 | 36 |
Match score weights: distance 35% · size 25% · config 20% · recency 20%. Top-matched comps best support the ARV.
Projected returns pro-forma
3.64% appreciation · 3.0% rent growth · sell at horizon
- IRR
- 19.7%
- Equity multiple
- 2.16×
- Total profit
- $52,035
- Equity at exit
- $77,722
- IRR
- 20.5%
- Equity multiple
- 4.13×
- Total profit
- $140,292
- Equity at exit
- $124,518
Cash invested: $44,772 (down + closing). Projections, not guarantees.
Landlord ↔ Tenant lean methodology
- Overall (STATE)
- 90 Strongly Landlord-Friendly
- State Louisiana
- 90 Strongly Landlord-Friendly · R+12
- County
- — inherits STATE
- City
- — inherits STATE
ZIP-level market 70466
- Home prices YoY
- 3.0%
- Active inventory
- 69
- Price-to-rent
- 7.4×
Monthly cashflow live
- Estimated rent
- $1,798 medium interval (Pro) →
- Mortgage (P&I)
- −$839
- Tax from tax record
- −$86 /mo · $1,036/yr
- Insurance
- −$67
- HOA
- −$0
- Vacancy / Maint / Mgmt
- −$378
- Net cashflow
- $429
Break-even live
UW: 25.0% down · 7.5% · 30yr · 1.5% tax · 5.0% vac · 8.0% maint · 8.0% mgmt
Financing live
Cash to close
- Down payment
- $39,975
- Closing costs
- $4,797
- Reserves months
- —
- Total cash needed
- —
Loan-product check · same deal, 3 products live
Conventional
25% down · 7.5% · 30yr
- Down + closing
- —
- Monthly P&I
- —
- Monthly cashflow
- —
- DSCR
- —
- Eligible?
- —
Personal DTI + credit; lowest rate.
DSCR
20% down · 8.5% · 30yr
- Down + closing
- —
- Monthly P&I
- —
- Monthly cashflow
- —
- DSCR
- —
- Eligible?
- —
No personal income docs; deal must DSCR.
Hard money
10% down · 12.0% · 12mo
- Down + closing
- —
- Monthly P&I
- —
- Monthly cashflow
- —
- DSCR
- —
- Eligible?
- —
Short-term bridge; refi at stabilization.
Listing history 11 events
-
2026-04-10$159,900 Active 228-char remark
Show marketing remark (228 chars)
Beautiful Mobile Home property located in Tickfaw! A 4 Bedroom 2 Bath with 2,079 Living Sq Ft situated on a 2.7 Acre lot in a quiet neighborhood in the Woodhaven area. In great condition and ready to move in! Access is flexible!
-
2019-04-05soldstatus $139,900 Closed
-
2019-03-04status Pending
-
2019-02-21price $139,900
-
2019-02-13price $149,900
-
2019-02-01price $155,000
-
2019-01-18price $159,000
-
2019-01-08$165,000 Active
-
2019-01-08$139,900
-
2002-10-09soldstatus
ⓘ Source: listings_history table (triggers on properties + properties_extension) + one-shot
backfill from property_details.listing_events for pre-trigger history.
Tax reassessment forecast LA · Resets to sale price
- Current annual tax
- $1,036 · $86/mo
- Projected year-2 tax
- $1,036 · $86/mo
- Expected delta
- $0/yr ($0/mo · 0.0%)
ⓘ Screening estimate from a state-policy table — verify with the county assessor before closing.
Climate risk First Street
- Flood 1/10 Low FEMA zone X (unshaded) · 0% chance over 30 yrs
- Wildfire 7/10 Severe
- Heat 8/10 Severe 7 d/yr ≥109°F today · 20 d/yr by 30 yrs out
- Wind 9/10 Extreme 99% chance of damaging wind over 30 yrs
- Air quality 2/10 Low 0 unhealthy d/yr today · 1 by 30 yrs out
Nearby sold comps map
Loading sold comps map…
Walkable amenities ~0.75 mi
Loading nearby amenities…
Taxation est. · year 1
- Rental income
- $21,582
- − Mortgage interest
- −$8,957
- − Property taxes
- −$1,036
- − Insurance
- −$800
- − Repairs & maintenance
- −$1,727
- − Management
- −$1,727
- − Depreciation
- −$4,652
- Taxable income
- $2,684
- Est. tax owed @ 24.0%
- −$644
- After-tax cash flow
- $4,507/yr
For passive investors: Depreciation is non-cash, so a rental often shows a tax loss while cash-flowing — sheltering income. Rental losses are passive: they offset passive income freely, and up to $25,000/yr can offset ordinary (W-2) income if you actively participate and your MAGI is under $100k (phasing out to $0 by $150k); unused losses carry forward. On sale, claimed depreciation is recaptured at up to 25%, and gains may owe capital-gains tax (a 1031 exchange can defer both). Figures are a year-1 estimate at your 24.0% rate — not tax advice; consult a CPA.
Schools (NCES district)
- District
- Tangipahoa Parish
- NCES district ID
- 2201680
- Math proficiency
- 18% ▼ -32.00%
- Reading proficiency
- 29% ▼ -31.00%
- Median HH income
- $41,283
- Composite
- 19.94/100
- National rank
- #8676
- State rank
- #63 of 98 in LA
Livability — Albany
- Score
- 77/100
- State rank
- #12
- US rank
- #3099
Category grades
Schools grade is shown separately in the Schools card above.
Census & demographics
- Population (ZIP)
- 9,815
Population outlook (Tangipahoa County) Hauer SSP2
- Today (2025)
- 144,204 people
- By 2030
- 151,413 · +5.0%
- By 2040
- 164,374 · +14.0%
- By 2050
- 175,427 · +21.7%
- By 2075
- 195,165 · +35.3%
- By 2100
- 201,641 · +39.8%
Race, ethnicity, and origin ACS 2023
- Neighborhood character
- Predominantly White (67%)
- Race & ethnicity
- White 67% Black 22% Hispanic / Latino 8% Two or more races 7%
- Hispanic origin (detail)
- Mexican 6%
- Common ancestry
- Lithuanian 11% Serbian 2% Scandinavian 1%
- Foreign-born
- 3% · Canada
- Languages at home
- 93% English-only · Spanish 7%
Political lean MEDSL · Tangipahoa
- 2024 margin
- Solid R (+37.4) · D 30.6% · R 68.0% · Other 1.3%
- 2008→2024 swing
- -6.5pp toward R · 2008: -30.9pp · 2024: -37.4pp
- All cycles
- 2024: R+37.4 2020: R+32.8 2016: R+32.6 2012: R+27.7 2008: R+30.9
Not yet ingested
- Civics
- —
Market trends
- HPI YoY
- ▲ 3.64%
- Current HPI
- 126.0016
- Rent YoY
- —
- Metro
- —
- State GDP YoY
- ▲ 3.29%
- F500 in state
- 10
Industry mix (Fortune 500 HQ in LA)
| Industry | F500 HQs | Revenue |
|---|---|---|
| Telecommunications | 2 | $23B |
|
||
| Utilities | 1 | $12B |
|
||
| Wholesale / Distribution | 1 | $5B |
|
||
| Advertising | 1 | $2B |
|
||
Price history
-3.1% since first listed11 events — show timeline
- 2026-04-10 Listed $159,900 GSREIN
- 2026-04-10 Listed $159,900 AcadianaMLS
- 2019-04-05 Sold (MLS) $139,900 GSREIN
- 2019-03-04 Pending — GSREIN
- 2019-02-21 Price Changed $139,900 GSREIN
- 2019-02-13 Price Changed $149,900 GSREIN
- 2019-02-01 Price Changed $155,000 GSREIN
- 2019-01-18 Price Changed $159,000 GSREIN
- 2019-01-08 Listed $139,900 AcadianaMLS
- 2019-01-08 Listed $165,000 GSREIN
- 2002-10-09 Sold (Public Records) — Public Records
Property tax history
+3.2%/yrLatest (2025): $1,036 · +0.5% YoY. Source: county tax records.
Cash-flow waterfall
monthlySold comps — $/sqft
last 12 mo · ≤1 miLoading sold comps…