3609 Juneau Unit A14 · St. Andrews, SC
Flood risk 6/10 · Moderate
- FEMA flood zone
- AE
- Chance of flooding over 30 yrs
- 0.71%
- Est. flood insurance / yr
- $1,737 – $8,500
Fire risk 3/10 · Minor
- Est. fire insurance / yr
- $783 – $1,453
Heat risk 7/10 · Major
- Hot days now (above 108°F)
- 7 days/yr
- Hot days in 30 yrs
- 16 days/yr
Wind risk 6/10 · Moderate
- Chance of severe wind over 30 yrs
- 68.0%
Air-quality risk 3/10 · Minor
- Unhealthy air days now
- 2 days/yr
- Unhealthy air days in 30 yrs
- 2 days/yr
Risk factors via First Street. Map © Google.
Why this score? — see what drove the B- grade
The composite is a weighted blend of 9 inputs, each scored 0–100. Each bar is that input's sub-score; the figure is the points it added to the 100-point composite (weight × sub-score).
- Cash flow +30.0/30.0
- 1% rule +10.0/10.0
- DSCR +10.0/10.0
- ARV discount +7.5/15.0
- Rent growth +3.8/5.0
- Schools +2.6/10.0
- Livability +2.5/5.0
- Condition / age +2.2/5.0
- Appreciation +0.0/10.0
$42,900
🖨 Deal sheet (PDF) 📄 Offer letter ✓ Due diligence
Listing remarks
Great investment opportunity in St. Andrews area! This condo features 2BR/2 full baths, all appliances included plus washer/dryer. HOA includes water & trash. Condo needs some TLC. Great location! Cash offers only. This home is being sold AS-IS. Cash only, no financing. Seller acquired the property in the delinquent tax sale and is conveying their tax deed via a quitclaim deed. Seller makes no warranties as to the condition of title. Disclaimer: CMLS has not reviewed and, therefore, does not endorse vendors who may appear in listings.
Key facts
- $220 HOA
- 2 parking spots
- Built 1972
Property features AI
Finance
- Other: Directions: Take Fernandina Road to Evelyn Drive then turn right on Juneau Road
- HOA & community: Has an association
Exterior
- Parking: 2 parking spaces
- Utilities: Public water; Public sewer
- Home design: Condominium (unit); Facing direction not specified
- Construction: Slab foundation
- Exterior features: Wood Fiber-Masonite exterior finish; Paved road frontage
Interior
- Bedrooms: Master bedroom on the main level
- Bathrooms: Two full bathrooms
- Heating & cooling: Central heating; Central cooling
- Interior features: One fireplace
Neighborhood map
What this means for you Summary
Snapshot
- This is a 2-bed/2.0-bath condo listed at $43k. Condition is rated fair.
Deal economics
- At list price, monthly cash flow is $44 ($533/yr) — positive.
- The deal already cash-flows at list — no discount required.
- Meets the 1% rule at list price ($1k rent vs $43k).
- Recommended offer: $42k (3.0% below list) — sets the bar for market timing.
Location & tenants
- Location reads: area grade B — affects rentability + tenant quality, not the cash-flow math above.
- Richland 01 (urban): math 26% / reading 36% proficiency, ranked #54 of 80 in SC (top 68%) — families likely to look elsewhere, expect single-tenant / working-renter base with shorter leases; 64% free/reduced lunch — lower-income household profile, screen leases tightly.
- Zoned schools: Pine Grove Elementary (math 24% / reading 15%, grade F, #496 of 597 statewide, top 83%, 541 students, 100% FRL); St. Andrews Middle (math 9% / reading 18%, grade F, #207 of 229 statewide, top 91%, 706 students, 100% FRL); Columbia High (math 17% / reading 67%, grade F, #174 of 196 statewide, top 90%, 665 students, 100% FRL) — zoned schools average 100% FRL vs 64% district-wide (36 pts higher); higher-poverty schools than district average — tighter screening recommended.
- Market conditions: Rents rising fast (+5.0%/yr); 146 active listings in the ZIP; 37 comparable units currently listed for rent nearby; rentals at typical pace (median 21d on market — plan ~3-4 weeks tenant-placement turnaround); 3,472 units permitted in Richland County in 2024 (1,096 in 5+ unit buildings).
Forward outlook
- Local home prices are declining (-3.0%/yr); year-one equity from $297 of loan paydown is wiped out by about $1k of value loss. Plan a longer hold.
- Richland County population projected at +30% by 2050 — long-run rental-demand tailwind backs the buy-and-hold thesis.
- At projected returns (-3.0% appreciation + 5.0% rent growth), your $12k cash investment doubles in ~9 years — after that, you're playing with house money.
Negotiation context
- It's been on market 49 days — a 3% lower offer ($42k) is reasonable based on typical stale-listing flexibility.
- 2 sale attempts; this cycle's ask has dropped $6k (12%) from the opening price — seller is motivated, your offer sets the floor, not the list.
Risks & watch-outs
- Watch-outs: flood insurance adds $427/mo.
- Climate carrying-cost: in FEMA flood zone AE (mandatory federal flood insurance); major wind risk, 68% chance of damaging wind over 30y; extreme-heat days projected 7→16/yr by 2055 (HVAC capex compounding) — expect insurance premiums to compound above CPI over the hold.
Questions for the listing agent
- It's been on market 49 days. Have you received any prior offers? Is the seller open to a 3% concession, seller financing, or rate buy-down credit?
- Have any recent inspections been done? Can we get a copy of the seller's disclosures and any deferred-maintenance estimates?
- Built in 1972 — when were the roof, HVAC, electrical panel, plumbing, and water heater last replaced?
- What's the actual annual flood-insurance premium (NFIP or private), and is the property in a SFHA with mandatory coverage?
- What does the HOA fee cover, when was the last increase, and are there any pending special assessments or reserve-fund shortfalls?
- Any open or pending special assessments — roof, HVAC, plumbing, elevator, façade? What's the per-unit balance and payoff schedule, and is the seller paying it off at close or rolling it to the buyer?
- Is there a deadline driving the sale (1031 exchange, divorce, estate, relocation)? That informs how much negotiation room exists.
- What's the average days-on-market for RENTAL listings here right now (not sales)? A rising rental-DOM trend means longer vacancies and softer asking-rent achievability than the comps imply.
- What's the recent tenant-quality profile in this submarket — average credit score on applications, eviction rate, late-payment / NSF rate, and stable-employment percentage? A property-management company in the area should have these aggregated.
- How much new apartment / multifamily construction is in the pipeline within 1–3 miles? Heavy new supply (>2% of stock underway) typically softens rents 12–24 months out; light construction supports rent growth.
Investment metrics
- 1% rule
- 2.91% ✓
- Cap rate
- 19.47%
- Cash-on-cash
- 47.05%
- DSCR
- 3.09
- GRM
- 2.9
CMA / ARV
No comps found within radius.
Projected returns pro-forma
-3.0% appreciation · 5.0% rent growth · sell at horizon
- IRR
- -2.4%
- Equity multiple
- 0.91×
- Total profit
- $-1,141
- Equity at exit
- $6,397
- IRR
- 12.7%
- Equity multiple
- 2.27×
- Total profit
- $15,307
- Equity at exit
- $3,709
Cash invested: $12,012 (down + closing). Projections, not guarantees.
Landlord ↔ Tenant lean methodology
- Overall (STATE)
- 90 Strongly Landlord-Friendly
- State South Carolina
- 90 Strongly Landlord-Friendly · R+6
- County
- — inherits STATE
- City
- — inherits STATE
ZIP-level market 29210
- Home prices YoY
- -32.2%
- Rents YoY
- 5.0%
- Active inventory
- 146
- Price-to-rent
- 2.9×
Monthly cashflow live
- Estimated rent
- $1,250 high interval (Pro) →
- Mortgage (P&I)
- −$225
- Tax est. 1.5%
- −$54 /mo · $644/yr
- Insurance
- −$18
- Flood insurance flood zone
- −$427 /mo · $5,118/yr
- HOA
- −$220
- Vacancy / Maint / Mgmt
- −$262
- Net cashflow
- $44
Break-even live
Sensitivity live
| Price | -10% $74 | -5% $59 | +0% $44 | +5% $30 | +10% $15 |
|---|---|---|---|---|---|
| Rent | -10% $-54 | -5% $-5 | +0% $44 | +5% $94 | +10% $143 |
| Rate | -1.0pp $66 | -0.5pp $55 | base $44 | +0.5pp $33 | +1.0pp $22 |
UW: 25.0% down · 7.5% · 30yr · 1.5% tax · 5.0% vac · 8.0% maint · 8.0% mgmt
Financing live
Cash to close
- Down payment
- $10,725
- Closing costs
- $1,287
- Reserves months
- —
- Total cash needed
- —
Loan-product check · same deal, 3 products live
Conventional
25% down · 7.5% · 30yr
- Down + closing
- —
- Monthly P&I
- —
- Monthly cashflow
- —
- DSCR
- —
- Eligible?
- —
Personal DTI + credit; lowest rate.
DSCR
20% down · 8.5% · 30yr
- Down + closing
- —
- Monthly P&I
- —
- Monthly cashflow
- —
- DSCR
- —
- Eligible?
- —
No personal income docs; deal must DSCR.
Hard money
10% down · 12.0% · 12mo
- Down + closing
- —
- Monthly P&I
- —
- Monthly cashflow
- —
- DSCR
- —
- Eligible?
- —
Short-term bridge; refi at stabilization.
Rent comps 37 comps
| Address | Beds | Baths | Sqft | Rent | $/sqft | DOM | Units | Dist |
|---|---|---|---|---|---|---|---|---|
| 3609 Juneau Rd Unit A4 Columbia, SC | 2.0 | 2.0 | 1000 | $1,195 | $1.20 | 20d | 1 | 0.10mi |
| 3609 Juneau Rd Unit B28 Columbia, SC | 2.0 | 2.0 | 1000 | $995 | $0.99 | 25d | 1 | 0.11mi |
| 3609 Juneau Rd Unit F73 Columbia, SC | 2.0 | 2.0 | 1000 | $1,255 | $1.25 | 23d | 1 | 0.14mi |
| 3609 Juneau Rd Unit F 74 Columbia, SC | 2.0 | 2.0 | 1000 | $1,145 | $1.15 | 4d | 1 | 0.15mi |
| 3609 Juneau Rd Unit 3609 F-73 Columbia, SC | 2.0 | 2.0 | 1000 | $1,195 | $1.20 | 25d | 1 | 0.15mi |
| 3406 Fernandina Rd Columbia, SC | 2.0 | 2.0 | 1008 | $1,245 | $1.24 | 25d | 1 | 0.17mi |
| 6007 Village Creek Dr Unit 6007 Columbia, SC | 2.0 | 2.0 | 1300 | $1,195 | $0.92 | 25d | 1 | 0.17mi |
| 1002 Creekside Way Columbia, SC | 2.0 | 2.0 | 1200 | $1,350 | $1.12 | 15d | 1 | 0.19mi |
| 3300 Kay St Columbia, SC | 2.0 | 2.5 | 1200 | $1,350 | $1.12 | 15d | 19 | 0.19mi |
| 1008 Creekside Way Unit 1 Columbia, SC | 2.0 | 2.0 | 1150 | $1,295 | $1.13 | 12d | 1 | 0.20mi |
| 3500 Fernandina Rd Columbia, SC | 1.0–2.0 | 1.0–1.5 | 1011 | $1,350 | $1.34 | 25d | 5 | 0.24mi |
| 1212 Metze Rd Columbia, SC | 1.0–3.0 | 1.0–2.0 | 1026 | $1,125 | $1.10 | 25d | 13 | 0.30mi |
| 405 Hickory Hill Dr Unit 405 Columbia, SC | 3.0 | 1.5 | 1400 | $1,400 | $1.00 | 25d | 1 | 0.33mi |
| 265 Timber Ct Columbia, SC | 3.0 | 1.5 | 1000 | $1,495 | $1.50 | 23d | 1 | 0.35mi |
| 800 Beatty Rd Columbia, SC | 1.0–3.0 | 1.0–1.5 | 930 | $1,074 | $1.15 | 25d | 1 | 0.36mi |
| 601 St Andrews Rd Columbia, SC | 1.0–3.0 | 1.0–2.0 | 1085 | $1,238 | $1.14 | 5d | 19 | 0.41mi |
| 240 Jamil Rd Columbia, SC | 2.0 | 1.5 | 1013 | $1,172 | $1.16 | 5d | 2 | 0.49mi |
| 240 Jamil Rd #3 Columbia, SC | 2.0 | 1.5 | 1027 | $1,250 | $1.22 | 25d | 1 | 0.49mi |
| 1200 Saint Andrews Rd Columbia, SC | 1.0–2.0 | 1.0–2.0 | 867 | $1,360 | $1.57 | 12d | 32 | 0.54mi |
| 961 Zimalcrest Dr Columbia, SC | 1.0–3.0 | 1.0–2.0 | 915 | $1,062 | $1.16 | 12d | 9 | 0.71mi |
| 4248 Donavan Dr Columbia, SC | 3.0 | 2.0 | 1231 | $1,586 | $1.29 | 20d | 1 | 0.81mi |
| 1510 Saint Andrews Rd Columbia, SC | 3.0 | 2.0 | 1196 | $1,215 | $1.02 | 15d | 36 | 1.10mi |
| 921 Old Manor Rd Unit BG0921 Columbia, SC | 2.0 | 1.0 | 912 | $1,100 | $1.21 | 25d | 1 | 1.18mi |
| 2400 Ashland Rd Columbia, SC | 1.0–2.0 | 1.0–2.0 | 809 | $1,456 | $1.80 | 4d | 17 | 1.19mi |
| 1473 Haviland Cir Columbia, SC | 3.0 | 2.0 | 1425 | $1,499 | $1.05 | 12d | 1 | 1.19mi |
| 114 Menlo Dr Unit BG0114 Columbia, SC | 3.0 | 2.0 | 1300 | $1,675 | $1.29 | 20d | 1 | 1.24mi |
| 2218 Apple Valley Rd Apt B Columbia, SC | 2.0 | 1.0 | 900 | $995 | $1.11 | 25d | 1 | 1.25mi |
| 2218 Apple Valley Rd Columbia, SC | 3.0 | 1.0 | 972 | $1,295 | $1.33 | 25d | 1 | 1.25mi |
| 324 Menlo Dr Unit BG0324 Columbia, SC | 2.0 | 1.0 | 912 | $1,175 | $1.29 | 15d | 1 | 1.29mi |
| 825 Menlo Dr Columbia, SC | 1.0–4.0 | 1.0–2.0 | 1083 | $1,300 | $1.20 | 20d | 3 | 1.32mi |
| 1335 Cactus Ave Columbia, SC | 3.0 | 2.0 | 1155 | $1,450 | $1.26 | 15d | 1 | 1.32mi |
| 82 Fox Run Ln Columbia, SC | 2.0–3.0 | 2.0–2.5 | 1152 | $1,050 | $0.91 | 5d | 17 | 1.39mi |
| 1725 Kathleen Dr Unit B Columbia, SC | 2.0 | 2.0 | 1100 | $1,275 | $1.16 | 25d | 1 | 1.42mi |
| 846 Piney Grove Rd Columbia, SC | 3.0 | 2.5 | 1400 | $1,495 | $1.07 | 25d | 1 | 1.44mi |
| 135 Hunters Grove Dr Columbia, SC | 3.0 | 2.5 | 1428 | $1,595 | $1.12 | 23d | 1 | 1.45mi |
| 217 Wynn Way Unit B Columbia, SC | 2.0 | 1.5 | 1160 | $1,095 | $0.94 | 20d | 1 | 1.45mi |
| 19 Grayson Grove Ct Columbia, SC | 2.0 | 2.5 | 1600 | $1,695 | $1.06 | 25d | 1 | 1.49mi |
HOA detail condo
- Monthly dues
- $220 · $2,640/yr
- Likely covers
- watertrash
- Assessments
- None detected in remarks — confirm with the listing agent.
Listing history 12 events
-
2026-06-21days on market $42,900 Active 49 DOM
-
2026-06-18days on market $42,900 Active 46 DOM
-
2026-06-17days on market $42,900 Active 45 DOM
-
2026-06-16remarks 545-char remark
-
2026-06-16days on market $42,900 Active 44 DOM
-
2026-06-15days on market $42,900 Active 43 DOM
-
2026-06-14statusdays on market $42,900 Active 41 DOM
-
2026-05-12status Pending
-
2026-05-08price $42,900
-
2026-05-01price $44,900
-
2026-04-10status Active
-
2026-04-03$49,000 Active
ⓘ Source: listings_history table (triggers on properties + properties_extension) + one-shot
backfill from property_details.listing_events for pre-trigger history.
Climate risk First Street
- Flood 6/10 Major FEMA zone AE · 71% chance over 30 yrs
- Wildfire 3/10 Moderate
- Heat 7/10 Severe 7 d/yr ≥108°F today · 16 d/yr by 30 yrs out
- Wind 6/10 Major 68% chance of damaging wind over 30 yrs
- Air quality 3/10 Moderate 2 unhealthy d/yr today · 2 by 30 yrs out
Nearby sold comps map
Loading sold comps map…
Walkable amenities ~0.75 mi
Loading nearby amenities…
Taxation est. · year 1
- Rental income
- $14,999
- − Mortgage interest
- −$2,403
- − Property taxes
- −$644
- − Insurance
- −$5,333
- − Repairs & maintenance
- −$1,200
- − Management
- −$1,200
- − HOA
- −$2,640
- − Depreciation
- −$1,248
- Taxable income
- $332
- Est. tax owed @ 24.0%
- −$80
- After-tax cash flow
- $453/yr
For passive investors: Depreciation is non-cash, so a rental often shows a tax loss while cash-flowing — sheltering income. Rental losses are passive: they offset passive income freely, and up to $25,000/yr can offset ordinary (W-2) income if you actively participate and your MAGI is under $100k (phasing out to $0 by $150k); unused losses carry forward. On sale, claimed depreciation is recaptured at up to 25%, and gains may owe capital-gains tax (a 1031 exchange can defer both). Figures are a year-1 estimate at your 24.0% rate — not tax advice; consult a CPA.
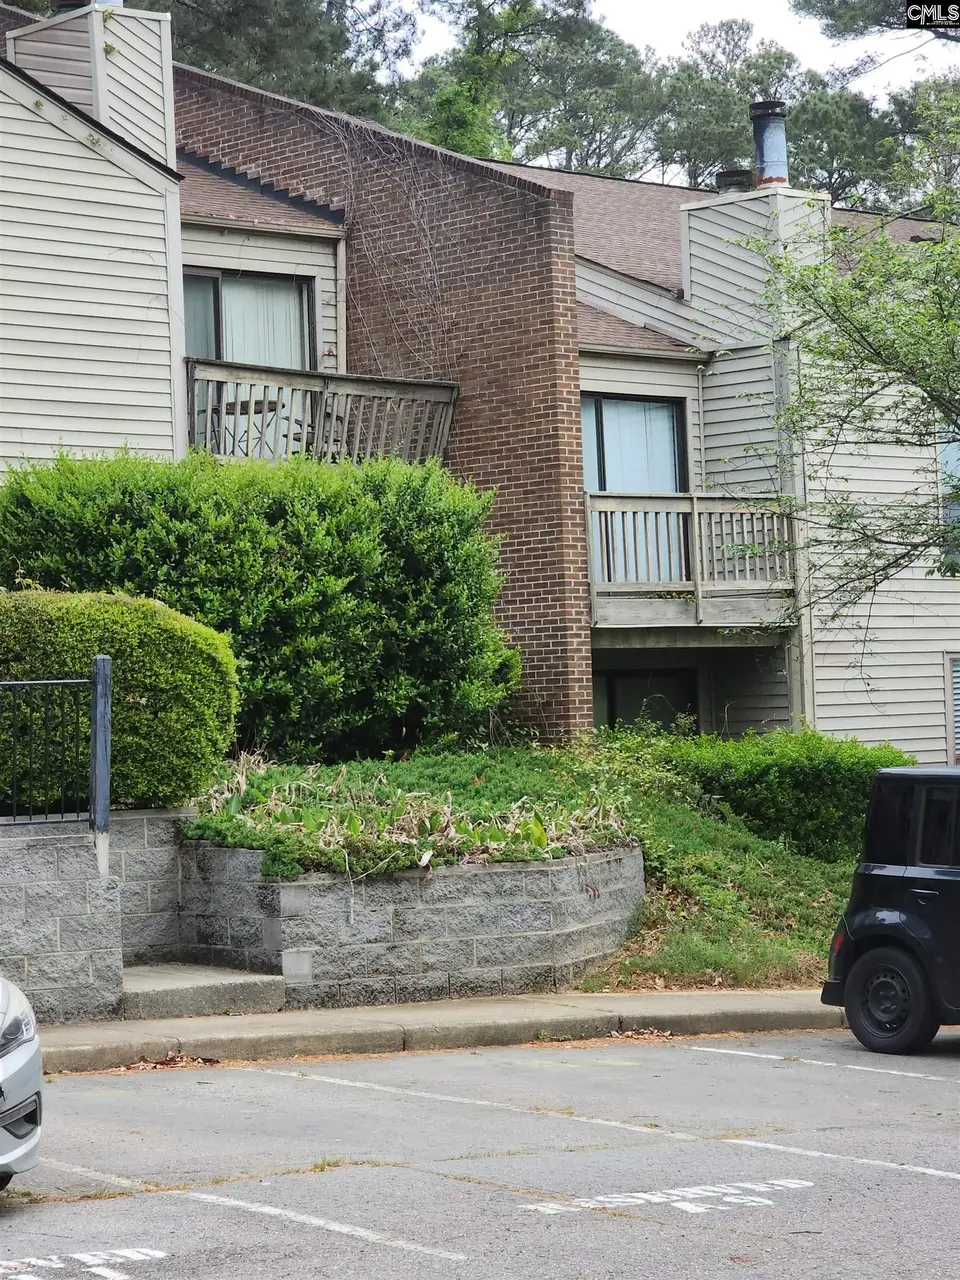
Condition & rehab AI · 2 photos
This condo requires significant repairs and updates to bring it up to current standards, but the location and included amenities make it a solid investment opportunity.
Repairs flagged
- Major exterior siding — Significant wear and tear
- Major roof — No visible damage, but age is implied
- Major flooring — No visible flooring, but age is implied
- Major interior walls/paint — No visible interior, but age is implied
- Major bathrooms — No visible bathrooms, but age is implied
- Major kitchen — No visible kitchen, but age is implied
- Major systems — No visible systems, but age is implied
Value-add opportunities
- Resale exterior paint — Fresh paint can significantly improve curb appeal
- Resale roof repair — A new roof can add value and prevent future issues
- Resale flooring replacement — Modern flooring can enhance the home's aesthetic
- Resale interior paint — Fresh paint can make the interior look more inviting
- Both bathroom renovation — Modern bathrooms are highly sought after and can increase both resale and rental value
- Both kitchen renovation — A new kitchen can significantly boost both resale and rental value
- Both system upgrades — Upgrading systems can improve energy efficiency and add value
Renovation cost estimate screening
| Repair item | Severity | Est. cost |
|---|---|---|
| exterior siding · Significant wear and tear | Major | $15,000–50,000 |
| roof · No visible damage, but age is implied | Major | $15,000–50,000 |
| flooring · No visible flooring, but age is implied | Major | $15,000–50,000 |
| interior walls/paint · No visible interior, but age is implied | Major | $15,000–50,000 |
| bathrooms · No visible bathrooms, but age is implied | Major | $15,000–50,000 |
| kitchen · No visible kitchen, but age is implied | Major | $15,000–50,000 |
| systems · No visible systems, but age is implied | Major | $15,000–50,000 |
| Total estimated repair cost · 7 items | $105,000–350,000 |
Value-add ROI direction
- Resale exterior paint — Fresh paint can significantly improve curb appeal ↑
- Resale roof repair — A new roof can add value and prevent future issues ↑
- Resale flooring replacement — Modern flooring can enhance the home's aesthetic ↑
- Resale interior paint — Fresh paint can make the interior look more inviting ↑
- Both bathroom renovation — Modern bathrooms are highly sought after and can increase both resale and rental value ↑
- Both kitchen renovation — A new kitchen can significantly boost both resale and rental value ↑
- Both system upgrades — Upgrading systems can improve energy efficiency and add value ↑
ⓘ Cost ranges are severity-bucket heuristics (US national rule-of-thumb). Get contractor quotes + a written scope before underwriting a rehab budget.
Schools (NCES district)
- District
- Richland 01
- NCES district ID
- 4503360
- Math proficiency
- 26% ▼ -7.00%
- Reading proficiency
- 36% ▼ -5.00%
- Median HH income
- $38,931
- Composite
- 25.94/100
- National rank
- #7335
- State rank
- #54 of 80 in SC
Livability — St. Andrews
No livability data for this city. (Only ~50 U.S. cities are tracked.)
Census & demographics
- Census place
- St. Andrews, SC
- County
- Richland County · 389,530 people
- City population
- 40,504
- Metro
- Columbia, SC
- Population (ZIP)
- 39,962
- Household income
- $50,871
- Rent vs Own
- Severe rent burden
- 2859.0
Population outlook (Richland County) Hauer SSP2
- Today (2025)
- 459,667 people
- By 2030
- 487,524 · +6.1%
- By 2040
- 542,035 · +17.9%
- By 2050
- 595,371 · +29.5%
- By 2075
- 732,998 · +59.5%
- By 2100
- 820,415 · +78.5%
Race, ethnicity, and origin ACS 2023
- Neighborhood character
- Diverse neighborhood (Simpson 0.58)
- Race & ethnicity
- Black 55% White 34% Two or more races 6% Hispanic / Latino 4% Asian 2%
- Common ancestry
- Arab 2% Lithuanian 2% Slovak 1%
- Foreign-born
- 7% · Canada
- Languages at home
- 91% English-only · Spanish 3%
Political lean MEDSL · Richland
- 2024 margin
- Solid D (+34.6) · D 66.4% · R 31.8% · Other 1.8%
- 2008→2024 swing
- +5.7pp toward D · 2008: 28.9pp · 2024: 34.6pp
- All cycles
- 2024: D+34.6 2020: D+38.3 2016: D+32.9 2012: D+33.3 2008: D+28.9
Not yet ingested
- Civics
- —
Market trends
- HPI YoY
- ▼ -107.61%
- Current HPI
- 226.2564
- Rent YoY
- ▲ 5.00%
- Metro
- Columbia, SC
- State GDP YoY
- ▲ 4.51%
- F500 in state
- 2
Industry mix (Fortune 500 HQ in SC)
| Industry | F500 HQs | Revenue |
|---|---|---|
| Packaging | 1 | $7B |
|
||
Price history
-12.4% since first listed5 events — show timeline
- 2026-05-12 Pending — Consolidated MLS
- 2026-05-08 Price Changed $42,900 Consolidated MLS
- 2026-05-01 Price Changed $44,900 Consolidated MLS
- 2026-04-10 Relisted — Consolidated MLS
- 2026-04-03 Listed $49,000 Consolidated MLS
Cash-flow waterfall
monthlySold comps — $/sqft
last 12 mo · ≤1 miLoading sold comps…