 🏷️ Likely Rental
2020 Banks Ave · Superior, WI
Flood risk 1/10 · Minimal
- FEMA flood zone
- X (unshaded)
- Chance of flooding over 30 yrs
- 0.0%
- Est. flood insurance / yr
- $473 – $860
Fire risk 3/10 · Minor
- Est. fire insurance / yr
- $636 – $1,182
Heat risk 2/10 · Minimal
- Hot days now (above 92°F)
- 7 days/yr
- Hot days in 30 yrs
- 13 days/yr
Wind risk 1/10 · Minimal
- Chance of severe wind over 30 yrs
- —
Air-quality risk 2/10 · Minimal
- Unhealthy air days now
- 1 days/yr
- Unhealthy air days in 30 yrs
- 1 days/yr
Risk factors via First Street. Map © Google.
Why this score? — see what drove the D grade
The composite is a weighted blend of 9 inputs, each scored 0–100. Each bar is that input's sub-score; the figure is the points it added to the 100-point composite (weight × sub-score).
- Cash flow +15.0/30.0
- ARV discount +7.5/15.0
- 1% rule +5.0/10.0
- DSCR +5.0/10.0
- Livability +4.3/5.0
- Rent growth +3.2/5.0
- Condition / age +2.5/5.0
- Schools +2.4/10.0
- Appreciation +0.0/10.0
$1,400
🖨 Deal sheet 📄 Offer letter ✓ Due diligence
Listing remarks MLS
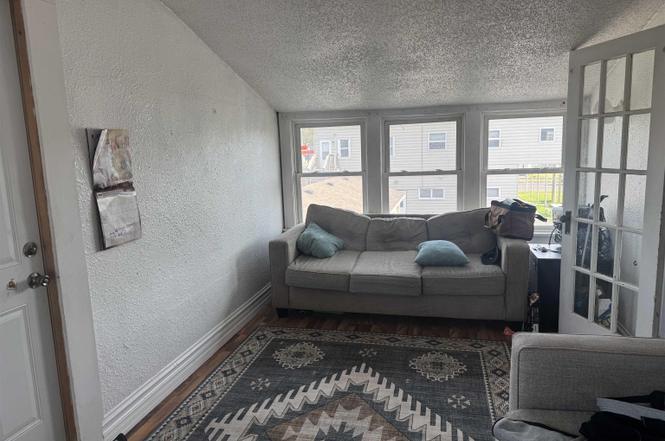
2-level duplex with active leases on both units and additional upselling opportunities. Upper level until is leased until 7/31/19; lower level unit is on a month-to-month lease. The main floor is 1140 square feet with 2 bedrooms, ?? bathroom, eat-in kitchen, stove, fridge, and foyer entry. The upper level is 960 square feet and also a 2 bedroom, ?? bathroom with hardwood floors in the kitchen, stove, fridge, back entry, and a balcony!
Key facts
- Private deck
- Balcony
- Utilities included
Tags
Property features AI
Finance
- Other: Located at 2020 Banks Ave, Superior, WI; Directions: Head south on Tower Avenue, turn right on 20th after Jack's Place, go one block and turn left onto Banks
- Financial info: One unit currently rents for $1,400/month; Annual tax amount listed
Exterior
- Parking: Detached parking
- Utilities: Public water; Public sewer
- Home design: Duplex residential income property; Single-story
- Exterior features: Patio; Lot approximately 25 x 140 (0.08 acre)
Interior
- Bedrooms: 3 bedrooms
- Bathrooms: 1 bathroom
- Interior features: Full basement
Neighborhood map
What this means for you Summary
Snapshot
- This is a 6-bed/2.0-bath other listed at $1k.
Deal economics
- At list price, monthly cash flow is $2k ($18k/yr) — positive.
- The deal already cash-flows at list — no discount required.
- Meets the 1% rule at list price ($2k rent vs $1k).
- Cap rate 1299.9% vs local median 4.6% in Superior — top-decile yield for the area; either an underpriced asset or a hidden risk that comps aren't pricing in. Stress-test before assuming the spread holds.
Location & tenants
- Location reads 86/100 on livability (#21 in WI, #337 nationally) — a professional / high-income tenant draw. Strengths: amenities A+, commute A+, cost of living A+; Watch: schools C-.
- Superior School District (suburban): math 23% / reading 34% proficiency, ranked #290 of 342 in WI (top 85%) — low school quality limits family demand, transient renter base, plan for 1-2y turnover.
- Market conditions: Rents rising (+2.8%/yr); 168 active listings in the ZIP; 110 units permitted in Douglas County in 2024 (0 in 5+ unit buildings).
- This rent runs 34% of the median local income ($68k/yr) — at the standard rent-burdened threshold; future hikes will face affordability resistance.
Forward outlook
- Local home prices are declining (-3.0%/yr); year-one equity from $10 of loan paydown is wiped out by about $42 of value loss. Plan a longer hold.
- Douglas County population projected at -20% by 2050 — secular population decline; favor cash flow + early exit over multi-decade hold.
- At projected returns (-3.0% appreciation + 2.8% rent growth), your $392 cash investment doubles in ~1 year — after that, you're playing with house money.
Negotiation context
- Only 3 days on market — expect competitive offers; lowballing is unlikely to land.
- 4 sale attempts since 16y ago with the ask held roughly flat each time — persistent listings suggest the price (not the market) is what's stuck; bring a comps-based counter.
Risks & watch-outs
- Watch-outs: built in 1910 — expect roof / HVAC / electrical / plumbing capex.
Questions for the listing agent
- Built in 1910 — when were the roof, HVAC, electrical panel, plumbing, and water heater last replaced?
- Is there a deadline driving the sale (1031 exchange, divorce, estate, relocation)? That informs how much negotiation room exists.
- The area grade is low — what's the realistic commute time and amenity access for the typical tenant pool here? Any planned neighborhood developments (good or bad) we should know about?
- What's the average days-on-market for RENTAL listings here right now (not sales)? A rising rental-DOM trend means longer vacancies and softer asking-rent achievability than the comps imply.
- What's the recent tenant-quality profile in this submarket — average credit score on applications, eviction rate, late-payment / NSF rate, and stable-employment percentage? A property-management company in the area should have these aggregated.
- How much new for-sale + rental construction is in the pipeline within 1–3 miles? Heavy new supply typically softens prices + rents 12–24 months out; constrained supply supports both.
Investment metrics
- 1% rule
- 137.33% ✓
- Cap rate
- 1299.86%
- Cash-on-cash
- 4619.89%
- DSCR
- 206.56
- GRM
- 0.1
CMA / ARV
No comps found within radius.
Projected returns pro-forma
-3.0% appreciation · 2.76% rent growth · sell at horizon
- IRR
- —
- Equity multiple
- 244.52×
- Total profit
- $95,458
- Equity at exit
- $209
- IRR
- —
- Equity multiple
- 524.26×
- Total profit
- $205,119
- Equity at exit
- $121
Cash invested: $392 (down + closing). Projections, not guarantees.
Landlord ↔ Tenant lean methodology
- Overall (STATE)
- 73 Landlord-Friendly
- State Wisconsin
- 73 Landlord-Friendly · R+2
- County
- — inherits STATE
- City
- — inherits STATE
ZIP-level market 54880
- Rents YoY
- 2.8%
- Active inventory
- 168
- Price-to-rent
- 0.1×
Monthly cashflow live
- Estimated rent
- $1,923 medium interval (Pro) →
- Mortgage (P&I)
- −$7
- Tax est. 1.5%
- −$2 /mo · $21/yr
- Insurance
- −$1
- HOA
- −$0
- Vacancy / Maint / Mgmt
- −$404
- Net cashflow
- $1,509
Break-even live
UW: 25.0% down · 7.5% · 30yr · 1.5% tax · 5.0% vac · 8.0% maint · 8.0% mgmt
Financing live
Cash to close
- Down payment
- $350
- Closing costs
- $42
- Reserves months
- —
- Total cash needed
- —
Loan-product check · same deal, 3 products live
Conventional
25% down · 7.5% · 30yr
- Down + closing
- —
- Monthly P&I
- —
- Monthly cashflow
- —
- DSCR
- —
- Eligible?
- —
Personal DTI + credit; lowest rate.
DSCR
20% down · 8.5% · 30yr
- Down + closing
- —
- Monthly P&I
- —
- Monthly cashflow
- —
- DSCR
- —
- Eligible?
- —
No personal income docs; deal must DSCR.
Hard money
10% down · 12.0% · 12mo
- Down + closing
- —
- Monthly P&I
- —
- Monthly cashflow
- —
- DSCR
- —
- Eligible?
- —
Short-term bridge; refi at stabilization.
Listing history 4 events
-
2026-06-18days on market $1,400 Active 3 DOM
-
2026-06-17days on market $1,400 Active 2 DOM
-
2026-06-15remarks 621-char remark
-
2026-06-15$1,400 Active 1 DOM
ⓘ Source: listings_history table (triggers on properties + properties_extension) + one-shot
backfill from property_details.listing_events for pre-trigger history.
Climate risk First Street
- Flood 1/10 Low FEMA zone X (unshaded) · 0% chance over 30 yrs
- Wildfire 3/10 Moderate
- Heat 2/10 Low 7 d/yr ≥92°F today · 13 d/yr by 30 yrs out
- Wind 1/10 Low
- Air quality 2/10 Low 1 unhealthy d/yr today · 1 by 30 yrs out
Nearby sold comps map
Loading sold comps map…
Walkable amenities ~0.75 mi
Loading nearby amenities…
Taxation est. · year 1
- Rental income
- $23,071
- − Mortgage interest
- −$78
- − Property taxes
- −$21
- − Insurance
- −$7
- − Repairs & maintenance
- −$1,846
- − Management
- −$1,846
- − Depreciation
- −$41
- Taxable income
- $19,232
- Est. tax owed @ 24.0%
- −$4,616
- After-tax cash flow
- $13,494/yr
For passive investors: Depreciation is non-cash, so a rental often shows a tax loss while cash-flowing — sheltering income. Rental losses are passive: they offset passive income freely, and up to $25,000/yr can offset ordinary (W-2) income if you actively participate and your MAGI is under $100k (phasing out to $0 by $150k); unused losses carry forward. On sale, claimed depreciation is recaptured at up to 25%, and gains may owe capital-gains tax (a 1031 exchange can defer both). Figures are a year-1 estimate at your 24.0% rate — not tax advice; consult a CPA.
Schools (NCES district)
- District
- Superior School District
- NCES district ID
- 5514670
- Math proficiency
- 23% ▼ -12.00%
- Reading proficiency
- 34% ▼ -4.00%
- Median HH income
- $43,659
- Composite
- 24.31/100
- National rank
- #7711
- State rank
- #290 of 342 in WI
Livability — Superior
- Score
- 86/100
- State rank
- #21
- US rank
- #337
Category grades
Schools grade is shown separately in the Schools card above.
Census & demographics
- Census place
- Superior, WI
- County
- Douglas County · 30,312 people
- City population
- 30,312
- Metro
- Duluth, MN-WI
- Population (ZIP)
- 30,312
- Household income
- $68,275
- Rent vs Own
- Severe rent burden
- 1018.0
Population outlook (Douglas County) Hauer SSP2
- Today (2025)
- 42,505 people
- By 2030
- 41,269 · -2.9%
- By 2040
- 37,829 · -11.0%
- By 2050
- 34,043 · -19.9%
- By 2075
- 25,892 · -39.1%
- By 2100
- 19,487 · -54.2%
Race, ethnicity, and origin ACS 2023
- Neighborhood character
- Predominantly White (90%)
- Race & ethnicity
- White 90% Two or more races 5% Hispanic / Latino 2% Black 1% Asian 1% Native American 1%
- Common ancestry
- Portuguese 10% Romanian 9% Lithuanian 4%
- Foreign-born
- 2% · China, Vietnam
- Languages at home
- 97% English-only · Spanish 1%
Political lean MEDSL · Douglas
- 2024 margin
- Lean D (+5.3) · D 52.0% · R 46.6% · Other 1.4%
- 2008→2024 swing
- -27.9pp toward R · 2008: 33.2pp · 2024: 5.3pp
- All cycles
- 2024: D+5.3 2020: D+9.3 2016: D+7.6 2012: D+31.3 2008: D+33.2
Not yet ingested
- Civics
- —
Market trends
- HPI YoY
- ▼ -167.80%
- Current HPI
- 226.557
- Rent YoY
- ▲ 2.76%
- Metro
- Duluth, MN-WI
- State GDP YoY
- ▲ 2.10%
- F500 in state
- 20
Industry mix (Fortune 500 HQ in WI)
| Industry | F500 HQs | Revenue |
|---|---|---|
| Industrial Machinery | 4 | $23B |
|
||
| Industrial Technology | 2 | $36B |
|
||
| Insurance | 1 | $36B |
|
||
| Professional Services | 1 | $19B |
|
||
| Utilities | 1 | $9B |
|
||
| Consumer Goods | 1 | $3B |
|
||
Price history
-97.8% since first listed10 events — show timeline
- 2026-06-15 Listed $1,400 LSAR
- 2018-08-20 Sold (Public Records) $71,000 Public Records
- 2018-08-14 Sold (MLS) $71,000 LSAR
- 2018-08-14 Sold (MLS) $71,000 NORTHSTARMLS as Distributed by MLS Grid
- 2018-07-16 Pending — NORTHSTARMLS as Distributed by MLS Grid
- 2018-07-16 Listed $85,000 NORTHSTARMLS as Distributed by MLS Grid
- 2018-06-15 Listed $85,000 LSAR
- 2013-10-03 Sold (Public Records) $60,800 Public Records
- 2010-07-28 Listed $65,900 NORTHSTARMLS as Distributed by MLS Grid
- 2003-03-04 Sold (Public Records) $64,500 Public Records
Property tax history
+4.1%/yrLatest (2025): $2,722 · -17.3% YoY. Source: county tax records.
Cash-flow waterfall
monthlySold comps — $/sqft
last 12 mo · ≤1 miLoading sold comps…