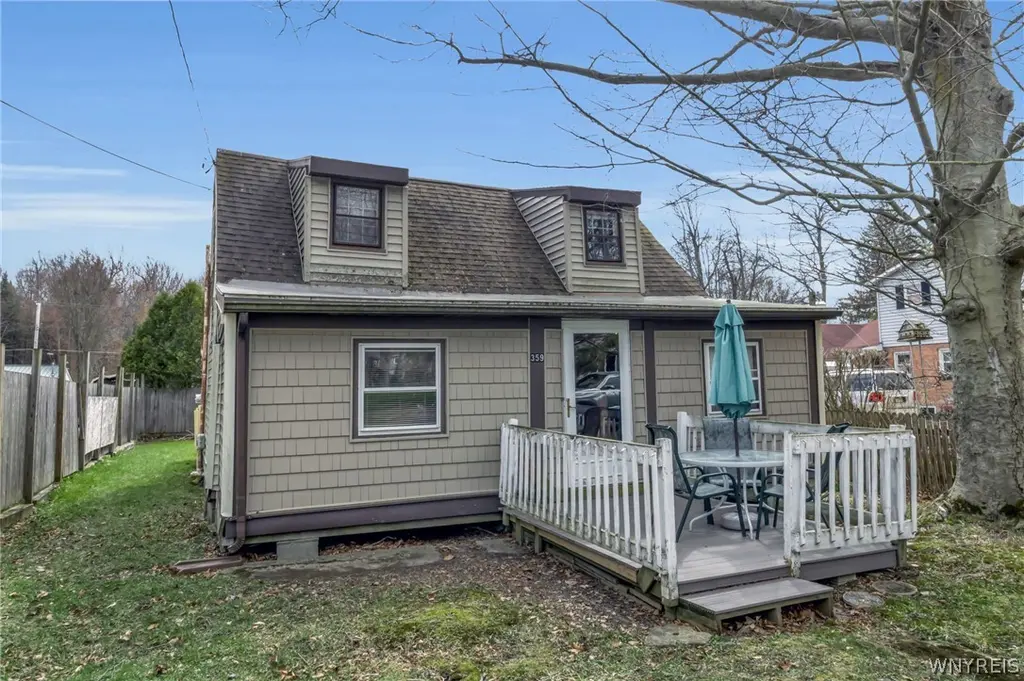
359 E Sterling Ave · Lake Erie Beach, NY
Flood risk 1/10 · Minimal
- FEMA flood zone
- X (unshaded)
- Chance of flooding over 30 yrs
- 0.0%
- Est. flood insurance / yr
- $473 – $860
Fire risk 2/10 · Minimal
- Est. fire insurance / yr
- $691 – $1,283
Heat risk 2/10 · Minimal
- Hot days now (above 92°F)
- 7 days/yr
- Hot days in 30 yrs
- 16 days/yr
Wind risk 1/10 · Minimal
- Chance of severe wind over 30 yrs
- —
Air-quality risk 2/10 · Minimal
- Unhealthy air days now
- 2 days/yr
- Unhealthy air days in 30 yrs
- 2 days/yr
Risk factors via First Street. Map © Google.
Why this score? — see what drove the B+ grade
The composite is a weighted blend of 9 inputs, each scored 0–100. Each bar is that input's sub-score; the figure is the points it added to the 100-point composite (weight × sub-score).
- Cash flow +30.0/30.0
- ARV discount +15.0/15.0
- 1% rule +10.0/10.0
- DSCR +10.0/10.0
- Schools +4.1/10.0
- Livability +3.1/5.0
- Rent growth +2.5/5.0
- Condition / age +2.5/5.0
- Appreciation +0.0/10.0
$74,900
🖨 Deal sheet (PDF) 📄 Offer letter ✓ Due diligence
Listing remarks
Welcome to 359 E. Sterling Ave. in the heart of Angola, less than a mile away from Point Breeze Beach and your favorite beachfront restaurants! This turnkey summer home has 3 bedrooms, 1 bathroom, a built in bar, beautiful pine walls upstairs, and oak cabinets in the kitchen. Composite decking in the front and back yards, and includes all appliances, a lawnmower, 2 window AC units, and most furniture and all the patio furniture! This is your perfect opportunity to own your own summer retreat or income property! Owned by the same family since it was built, and it's time for a new family to make memories together 'down at the cottage'!
Key facts
- Built in bar
- Oak cabinets
- Pine walls
Tags
Neighborhood map
What this means for you Summary
Snapshot
- This is a 3-bed/1.0-bath single-family listed at $75k.
Deal economics
- At list price, monthly cash flow is $472 ($6k/yr) — positive.
- The deal already cash-flows at list — no discount required.
- Meets the 1% rule at list price ($1k rent vs $75k).
- Cap rate 13.9% vs local median 2.8% in Lake Erie Beach — top-decile yield for the area; either an underpriced asset or a hidden risk that comps aren't pricing in. Stress-test before assuming the spread holds.
Location & tenants
- Location reads 62/100 on livability (#836 in NY) — a middle-class / working-renter tenant base. Strengths: cost of living A+, housing A+, crime B; Watch: amenities F, commute F, health & safety F.
- Evans-Brant Central School District (Lake Shore) (suburban): math 43% / reading 51% proficiency, ranked #424 of 590 in NY (top 72%) — families likely to look elsewhere, expect single-tenant / working-renter base with shorter leases.
- Zoned schools: A J Schmidt Elementary School (math 42% / reading 47%, grade F, #1,277 of 2,108 statewide, top 64%, 246 students, 54% FRL); William G Houston Middle School (math 15% / reading 43%, grade F, #566 of 729 statewide, top 78%, 503 students, 0% FRL); Lake Shore Senior High School (math 92% / reading 95%, grade A+, #131 of 1,100 statewide, top 13%, 671 students, 47% FRL) — zoned schools at 34% FRL track the district average.
- Market conditions: 102 active listings in the ZIP; 1,244 units permitted in Erie County in 2024 (563 in 5+ unit buildings).
Forward outlook
- Local home prices are declining (-3.0%/yr); year-one equity from $518 of loan paydown is wiped out by about $2k of value loss. Plan a longer hold.
- At projected returns (-3.0% appreciation + 3.0% rent growth), your $21k cash investment doubles in ~5 years — after that, you're playing with house money.
Negotiation context
- Only 7 days on market — expect competitive offers; lowballing is unlikely to land.
Risks & watch-outs
- Watch-outs: property tax is 3.7% of price; built in 1950 — expect roof / HVAC / electrical / plumbing capex.
Questions for the listing agent
- Built in 1950 — when were the roof, HVAC, electrical panel, plumbing, and water heater last replaced?
- Property tax is high relative to price — has the assessment been appealed recently, and will the sale trigger a re-assessment?
- Is there a deadline driving the sale (1031 exchange, divorce, estate, relocation)? That informs how much negotiation room exists.
- Schools are D-rated, which usually means shorter tenancies and higher turnover. Who's the typical renter profile here, and what's been the actual vacancy rate?
- What's the average days-on-market for RENTAL listings here right now (not sales)? A rising rental-DOM trend means longer vacancies and softer asking-rent achievability than the comps imply.
- What's the recent tenant-quality profile in this submarket — average credit score on applications, eviction rate, late-payment / NSF rate, and stable-employment percentage? A property-management company in the area should have these aggregated.
- How much new for-sale + rental construction is in the pipeline within 1–3 miles? Heavy new supply typically softens prices + rents 12–24 months out; constrained supply supports both.
Investment metrics
- 1% rule
- 1.91% ✓
- Cap rate
- 13.86%
- Cash-on-cash
- 27.03%
- DSCR
- 2.20
- GRM
- 4.4
CMA / ARV
- ARV (on-the-fly)
- $142,800
- Comps found
- 10
Show comp detail 10 sales within ~0.75 mi
| Address | Dist | Beds/Ba | Sqft | Sold | Price | $/sf | Match |
|---|---|---|---|---|---|---|---|
| 215 W Sterling Ave | 0.53mi | 2/1.0 (-1) | 848 (-0%) | 5mo | $87,500 | $103 | 66 |
| 359 E Pleasant Ave | 0.06mi | 2/2.0 (-1) | 770 (-9%) | 10mo | $212,100 | $275 | 64 |
| 245 Kennedy Ave | 0.51mi | 2/1.0 (-1) | 812 (-4%) | 10mo | $165,000 | $203 | 55 |
| 229 Garfield Ave | 0.59mi | 2/1.0 (-1) | 880 (+4%) | 10mo | $220,000 | $250 | 54 |
| 173 W Sterling Ave | 0.68mi | 2/1.0 (-1) | 800 (-6%) | 1mo | $45,000 | $56 | 52 |
| 427 Herr Rd | 0.75mi | 2/1.0 (-1) | 863 (+2%) | 17mo | $145,000 | $168 | 44 |
| 9624 Point Breeze Dr | 0.63mi | 2/1.0 (-1) | 820 (-4%) | 22mo | $169,900 | $207 | 41 |
| 449 Madison Ave | 0.50mi | 2/1.0 (-1) | 734 (-14%) | 10mo | $65,000 | $89 | 40 |
| 230 Kennedy Ave | 0.58mi | 2/1.0 (-1) | 896 (+5%) | 24mo | $95,000 | $106 | 39 |
| 171 Humboldt Ave | 0.69mi | 2/1.0 (-1) | 960 (+13%) | 22mo | $45,000 | $47 | 23 |
Match score weights: distance 35% · size 25% · config 20% · recency 20%. Top-matched comps best support the ARV.
Projected returns pro-forma
-3.0% appreciation · 3.0% rent growth · sell at horizon
- IRR
- 21.1%
- Equity multiple
- 1.86×
- Total profit
- $18,057
- Equity at exit
- $11,168
- IRR
- 29.3%
- Equity multiple
- 3.62×
- Total profit
- $54,902
- Equity at exit
- $6,476
Cash invested: $20,972 (down + closing). Projections, not guarantees.
Landlord ↔ Tenant lean methodology
- Overall (STATE)
- 15 Strongly Tenant-Friendly
- State New York
- 15 Strongly Tenant-Friendly · D+10
- County
- — inherits STATE
- City
- — inherits STATE
ZIP-level market 14006
- Home prices YoY
- -16.8%
- Active inventory
- 102
- Price-to-rent
- 4.4×
Monthly cashflow live
- Estimated rent
- $1,431 medium interval (Pro) →
- Mortgage (P&I)
- −$393
- Tax from tax record
- −$234 /mo · $2,808/yr
- Insurance
- −$31
- HOA
- −$0
- Vacancy / Maint / Mgmt
- −$300
- Net cashflow
- $472
Break-even live
Sensitivity live
| Price | -10% $515 | -5% $494 | +0% $472 | +5% $451 | +10% $430 |
|---|---|---|---|---|---|
| Rent | -10% $359 | -5% $416 | +0% $472 | +5% $529 | +10% $585 |
| Rate | -1.0pp $510 | -0.5pp $491 | base $472 | +0.5pp $453 | +1.0pp $433 |
UW: 25.0% down · 7.5% · 30yr · 1.5% tax · 5.0% vac · 8.0% maint · 8.0% mgmt
Financing live
Cash to close
- Down payment
- $18,725
- Closing costs
- $2,247
- Reserves months
- —
- Total cash needed
- —
Loan-product check · same deal, 3 products live
Conventional
25% down · 7.5% · 30yr
- Down + closing
- —
- Monthly P&I
- —
- Monthly cashflow
- —
- DSCR
- —
- Eligible?
- —
Personal DTI + credit; lowest rate.
DSCR
20% down · 8.5% · 30yr
- Down + closing
- —
- Monthly P&I
- —
- Monthly cashflow
- —
- DSCR
- —
- Eligible?
- —
No personal income docs; deal must DSCR.
Hard money
10% down · 12.0% · 12mo
- Down + closing
- —
- Monthly P&I
- —
- Monthly cashflow
- —
- DSCR
- —
- Eligible?
- —
Short-term bridge; refi at stabilization.
Listing history 2 events
-
2026-04-20status Pending
-
2026-04-13$74,900 Active
ⓘ Source: listings_history table (triggers on properties + properties_extension) + one-shot
backfill from property_details.listing_events for pre-trigger history.
Tax reassessment forecast NY · Partial reset (capped growth)
- Current annual tax
- $2,808 · $234/mo
- Projected year-2 tax
- $2,808 · $234/mo
- Expected delta
- $0/yr ($0/mo · 0.0%)
ⓘ Screening estimate from a state-policy table — verify with the county assessor before closing.
Climate risk First Street
- Flood 1/10 Low FEMA zone X (unshaded) · 0% chance over 30 yrs
- Wildfire 2/10 Low
- Heat 2/10 Low 7 d/yr ≥92°F today · 16 d/yr by 30 yrs out
- Wind 1/10 Low
- Air quality 2/10 Low 2 unhealthy d/yr today · 2 by 30 yrs out
Nearby sold comps map
Loading sold comps map…
Walkable amenities ~0.75 mi
Loading nearby amenities…
Taxation est. · year 1
- Rental income
- $17,170
- − Mortgage interest
- −$4,196
- − Property taxes
- −$2,808
- − Insurance
- −$374
- − Repairs & maintenance
- −$1,374
- − Management
- −$1,374
- − Depreciation
- −$2,179
- Taxable income
- $4,866
- Est. tax owed @ 24.0%
- −$1,168
- After-tax cash flow
- $4,501/yr
For passive investors: Depreciation is non-cash, so a rental often shows a tax loss while cash-flowing — sheltering income. Rental losses are passive: they offset passive income freely, and up to $25,000/yr can offset ordinary (W-2) income if you actively participate and your MAGI is under $100k (phasing out to $0 by $150k); unused losses carry forward. On sale, claimed depreciation is recaptured at up to 25%, and gains may owe capital-gains tax (a 1031 exchange can defer both). Figures are a year-1 estimate at your 24.0% rate — not tax advice; consult a CPA.
Schools (NCES district)
- District
- Evans-Brant Central School District (Lake Shore)
- NCES district ID
- 3616560
- Math proficiency
- 43% ▼ -9.00%
- Reading proficiency
- 51% ▲ 6.00%
- Median HH income
- $56,433
- Composite
- 40.89/100
- National rank
- #3619
- State rank
- #424 of 590 in NY
Livability — Lake Erie Beach
- Score
- 62/100
- State rank
- #836
- US rank
- #16262
Category grades
Schools grade is shown separately in the Schools card above.
Census & demographics
- Census place
- Lake Erie Beach, NY
- Population (ZIP)
- 9,354
Population outlook (Erie County) Hauer SSP2
- Today (2025)
- 933,037 people
- By 2030
- 935,181 · +0.2%
- By 2040
- 928,531 · -0.5%
- By 2050
- 905,725 · -2.9%
- By 2075
- 834,037 · -10.6%
- By 2100
- 708,033 · -24.1%
Race, ethnicity, and origin ACS 2023
- Neighborhood character
- Predominantly White (92%)
- Race & ethnicity
- White 92% Two or more races 3% Black 2% Asian 1% Hispanic / Latino 1%
- Common ancestry
- Romanian 16% Italian 4% Lithuanian 2%
- Foreign-born
- 3% · Canada, China
- Languages at home
- 96% English-only · French/Haitian/Cajun 1% Spanish 1% Other Asian/Pacific 1%
Political lean MEDSL · Erie
- 2024 margin
- Lean D (+9.7) · D 54.8% · R 45.2%
- 2008→2024 swing
- -7.9pp toward R · 2008: 17.5pp · 2024: 9.7pp
- All cycles
- 2024: D+9.7 2020: D+14.7 2016: D+4.8 2012: D+15.6 2008: D+17.5
Not yet ingested
- Civics
- —
Market trends
- HPI YoY
- ▼ -80.95%
- Current HPI
- 401.7461
- Rent YoY
- —
- Metro
- —
- State GDP YoY
- ▲ 2.60%
- F500 in state
- 92
Industry mix (Fortune 500 HQ in NY)
| Industry | F500 HQs | Revenue |
|---|---|---|
| Financial Services | 10 | $950B |
|
||
| Consumer Goods | 9 | $162B |
|
||
| Insurance | 4 | $225B |
|
||
| Telecommunications | 2 | $144B |
|
||
| Pharmaceuticals | 2 | $112B |
|
||
| Media / Entertainment | 2 | $69B |
|
||
Price history
2 events — show timeline
- 2026-04-20 Pending — WNYREIS
- 2026-04-13 Listed $74,900 WNYREIS
Property tax history
+2.0%/yrLatest (2025): $2,808 · +1.0% YoY. Source: county tax records.
Cash-flow waterfall
monthlySold comps — $/sqft
last 12 mo · ≤1 miLoading sold comps…