6485 Ponderosa · Magalia, CA
Flood risk 1/10 · Minimal
- FEMA flood zone
- X (unshaded)
- Chance of flooding over 30 yrs
- 0.0%
- Est. flood insurance / yr
- $507 – $1,088
Fire risk 6/10 · Moderate
- Est. fire insurance / yr
- $659 – $1,223
Heat risk 4/10 · Minor
- Hot days now (above 96°F)
- 7 days/yr
- Hot days in 30 yrs
- 17 days/yr
Wind risk 1/10 · Minimal
- Chance of severe wind over 30 yrs
- —
Air-quality risk 10/10 · Severe
- Unhealthy air days now
- 37 days/yr
- Unhealthy air days in 30 yrs
- 42 days/yr
Risk factors via First Street. Map © Google.
Why this score? — see what drove the C grade
The composite is a weighted blend of 9 inputs, each scored 0–100. Each bar is that input's sub-score; the figure is the points it added to the 100-point composite (weight × sub-score).
- Cash flow +19.4/30.0
- ARV discount +14.9/15.0
- DSCR +6.1/10.0
- Schools +5.0/10.0
- 1% rule +4.3/10.0
- Livability +2.6/5.0
- Rent growth +2.5/5.0
- Condition / age +2.5/5.0
- Appreciation +0.0/10.0
$159,500
🖨 Deal sheet (PDF) 📄 Offer letter ✓ Due diligence
Listing remarks MLS
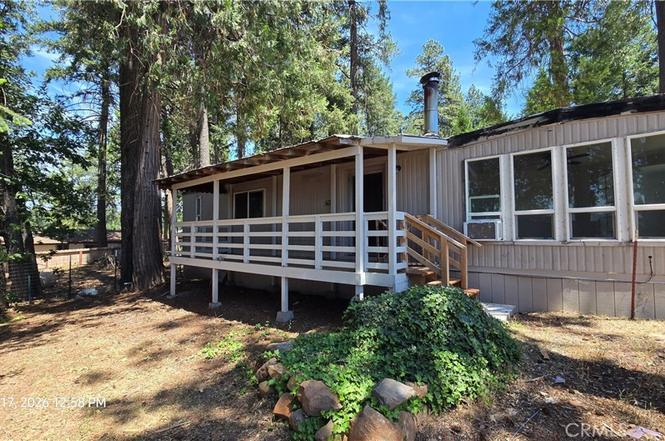
Manufactured home in the POA and lower Magalia location. Home is physically a 3 bedroom as the dining room off kitchen was enclosed to make 3rd bedroom. Large front living room with Woodstove which open to kitchen area and additional dining area. Bedrooms are spacious and bathrooms nice in size as well. Covered front porch and rear porch, detached 2 car garage, yard is fenced on 3 sides and ample parking in front and side of home. Clean waiting for personal touches.
Key facts
- Three bedroom layout
- Community amenities
- Swimming pool
Tags
Property features AI
Finance
- Other: Community features include golf, watersports, lake, marina, fishing, horse trails, parks and dog park; rural and foothill setting with nearby public lands
- HOA & community: Part of PPPOA association; Annual association fee ($350/year); Association amenities: pool, spa, club house, meeting/banquet facilities, racquetball, pickleball, bocce ball, sport court, playgound, hiking and biking trails, multipurpose/recreational room
Exterior
- Parking: 2-car garage (front entry); Driveway; Gravel driveway; RV access/parking; Total of 6 parking spaces (including 4 uncovered)
- Security: Smoke and carbon monoxide detectors
- Utilities: Propane; Electricity connected; Water connected (district/public); Septic tank; Telephone in street; Cable available
- Home design: Manufactured house; Single-story; Entry level: 1; Has view; Updated / remodeled
- Construction: Membrane roof; Pier jacks foundation; Fencing includes chain link, wire, cross fenced and wood
- Exterior features: Covered front and rear porches; Patio; In-ground, fenced community pool; Treed lot with front and back yard; Level/flat lot and level with street
Interior
- Kitchen: Refrigerator; Propane range and oven; Dishwasher; Propane water heater; Formal dining room
- Bedrooms: 2 main-level bedrooms
- Flooring: Laminated flooring
- Bathrooms: 2 full bathrooms; Shower
- Heating & cooling: Forced air heating; Wood stove / free‑standing wood fireplace
- Interior features: French doors; Front door entry; One-level layout; Updated / remodeled condition; Carbon monoxide and smoke detectors; Association spa access
- Laundry & utility: Inside laundry; Washer hookup
Neighborhood map
What this means for you Summary
Snapshot
- This is a 2-bed/2.0-bath manufactured listed at $160k.
Deal economics
- At list price, monthly cash flow is $178 ($2k/yr) — positive.
- The deal already cash-flows at list — no discount required.
- To meet the 1% rule (rent ≥ 1% of price), the offer needs to be $148k (7.1% below list).
- Recommended offer: $148k (7.1% below list) — sets the bar for 1% rule.
- Cap rate 7.6% vs local median 4.1% in Magalia — top-decile yield for the area; either an underpriced asset or a hidden risk that comps aren't pricing in. Stress-test before assuming the spread holds.
Location & tenants
- Location reads 51/100 on livability (#1,094 in CA) — a working-class tenant base; expect higher turnover. Strengths: housing A+; Watch: employment C-, crime F, amenities F.
- Zoned schools: Pine Ridge (191 students, 76% FRL); Paradise Junior High (164 students, 70% FRL); Paradise Senior High (math 27% / reading 52%, grade F, #532 of 1,170 statewide, top 48%, 476 students, 50% FRL).
- Market conditions: 217 active listings in the ZIP; 4 comparable units currently listed for rent nearby; rentals at typical pace (median 15d on market — plan ~3-4 weeks tenant-placement turnaround); 946 units permitted in Butte County in 2024 (254 in 5+ unit buildings).
Forward outlook
- Local home prices are declining (-3.0%/yr); year-one equity from $1k of loan paydown is wiped out by about $5k of value loss. Plan a longer hold.
- Butte County population projected at +10% by 2050 — modest demand growth; plan on rents tracking national, not racing it.
Negotiation context
- Only 1 days on market — expect competitive offers; lowballing is unlikely to land.
- 3 sale attempts since 4y ago with the ask held roughly flat each time — persistent listings suggest the price (not the market) is what's stuck; bring a comps-based counter.
- Current owner paid $70k; list at $160k implies a 128% gain — meaningful room to come down on a strong offer.
Risks & watch-outs
- Climate carrying-cost: major wildfire risk — expect insurance premiums to compound above CPI over the hold.
Questions for the listing agent
- Built in 1972 — when were the roof, HVAC, electrical panel, plumbing, and water heater last replaced?
- What does the HOA fee cover, when was the last increase, and are there any pending special assessments or reserve-fund shortfalls?
- Is there a deadline driving the sale (1031 exchange, divorce, estate, relocation)? That informs how much negotiation room exists.
- Schools are F-rated, which usually means shorter tenancies and higher turnover. Who's the typical renter profile here, and what's been the actual vacancy rate?
- Crime grade is F in this area — have there been break-ins, vandalism, or insurance claims at this property in the last 3 years? What carrier currently insures it and at what premium?
- What's the average days-on-market for RENTAL listings here right now (not sales)? A rising rental-DOM trend means longer vacancies and softer asking-rent achievability than the comps imply.
- What's the recent tenant-quality profile in this submarket — average credit score on applications, eviction rate, late-payment / NSF rate, and stable-employment percentage? A property-management company in the area should have these aggregated.
- How much new for-sale + rental construction is in the pipeline within 1–3 miles? Heavy new supply typically softens prices + rents 12–24 months out; constrained supply supports both.
Investment metrics
- 1% rule
- 0.93% ✗
- Cap rate
- 7.63%
- Cash-on-cash
- 4.79%
- DSCR
- 1.21
- GRM
- 9.0
CMA / ARV
- ARV (on-the-fly)
- $190,800
- Comps found
- 12
Show comp detail 12 sales within ~0.75 mi
| Address | Dist | Beds/Ba | Sqft | Sold | Price | $/sf | Match |
|---|---|---|---|---|---|---|---|
| 13980 Cascade Dr | 0.07mi | 3/2.0 (+1) | 1,296 (+2%) | 3mo | $239,900 | $185 | 86 |
| 13908 Carver Dr | 0.28mi | 2/2.0 | 1,280 (+1%) | 2mo | $192,000 | $150 | 84 |
| 13895 S Park | 0.36mi | 3/2.0 (+1) | 1,288 (+1%) | 1mo | $220,000 | $171 | 75 |
| 6493 Ponderosa | 0.04mi | 2/2.0 | 1,452 (+14%) | 1mo | $229,000 | $158 | 74 |
| 6295 Victoria Ct | 0.43mi | 2/2.5 | 1,215 (-4%) | 1mo | $216,000 | $178 | 70 |
| 13995 Potomac | 0.10mi | 3/2.0 (+1) | 1,379 (+8%) | 17mo | $270,000 | $196 | 62 |
| 6255 Seabury Ct | 0.54mi | 3/2.0 (+1) | 1,286 (+1%) | 16mo | $189,650 | $147 | 55 |
| 6303 Victoria Ct | 0.41mi | 3/2.0 (+1) | 1,200 (-6%) | 16mo | $12,500 | $10 | 53 |
| 14174 Norwich Cir | 0.31mi | 3/2.0 (+1) | 1,440 (+13%) | 10mo | $186,000 | $129 | 50 |
| 14246 Manatee Cir | 0.75mi | 2/2.0 | 1,200 (-6%) | 12mo | $154,900 | $129 | 46 |
| 6249 Odessa Ct | 0.53mi | 2/2.0 | 1,440 (+13%) | 13mo | $145,000 | $101 | 42 |
| 14148 Wingate Cir | 0.64mi | 2/2.0 | 1,440 (+13%) | 9mo | $210,000 | $146 | 41 |
Match score weights: distance 35% · size 25% · config 20% · recency 20%. Top-matched comps best support the ARV.
Projected returns pro-forma
-3.0% appreciation · 3.0% rent growth · sell at horizon
- IRR
- -8.9%
- Equity multiple
- 0.67×
- Total profit
- $-14,548
- Equity at exit
- $23,782
- IRR
- 0.6%
- Equity multiple
- 1.04×
- Total profit
- $1,754
- Equity at exit
- $13,791
Cash invested: $44,660 (down + closing). Projections, not guarantees.
Landlord ↔ Tenant lean methodology
- Overall (STATE)
- 18 Strongly Tenant-Friendly
- State California
- 18 Strongly Tenant-Friendly · D+13
- County
- — inherits STATE
- City
- — inherits STATE
ZIP-level market 95954
- Home prices YoY
- -30.0%
- Active inventory
- 217
- Price-to-rent
- 9.0×
Monthly cashflow live
- Estimated rent
- $1,482 medium interval (Pro) →
- Mortgage (P&I)
- −$836
- Tax from tax record
- −$61 /mo · $730/yr
- Insurance
- −$66
- HOA
- −$29
- Vacancy / Maint / Mgmt
- −$311
- Net cashflow
- $178
Break-even live
Sensitivity live
| Price | -10% $268 | -5% $223 | +0% $178 | +5% $133 | +10% $88 |
|---|---|---|---|---|---|
| Rent | -10% $61 | -5% $120 | +0% $178 | +5% $237 | +10% $295 |
| Rate | -1.0pp $258 | -0.5pp $219 | base $178 | +0.5pp $137 | +1.0pp $95 |
UW: 25.0% down · 7.5% · 30yr · 1.5% tax · 5.0% vac · 8.0% maint · 8.0% mgmt
Financing live
Cash to close
- Down payment
- $39,875
- Closing costs
- $4,785
- Reserves months
- —
- Total cash needed
- —
Loan-product check · same deal, 3 products live
Conventional
25% down · 7.5% · 30yr
- Down + closing
- —
- Monthly P&I
- —
- Monthly cashflow
- —
- DSCR
- —
- Eligible?
- —
Personal DTI + credit; lowest rate.
DSCR
20% down · 8.5% · 30yr
- Down + closing
- —
- Monthly P&I
- —
- Monthly cashflow
- —
- DSCR
- —
- Eligible?
- —
No personal income docs; deal must DSCR.
Hard money
10% down · 12.0% · 12mo
- Down + closing
- —
- Monthly P&I
- —
- Monthly cashflow
- —
- DSCR
- —
- Eligible?
- —
Short-term bridge; refi at stabilization.
Rent comps 4 comps
| Address | Beds | Baths | Sqft | Rent | $/sqft | DOM | Units | Dist |
|---|---|---|---|---|---|---|---|---|
| 6494 Providence Ct Magalia, CA | 2.0 | 1.0 | 950 | $1,350 | $1.42 | 23d | 1 | 0.08mi |
| 6245 Brevard Cir Magalia, CA | 3.0 | 2.0 | 1440 | $2,100 | $1.46 | 15d | 1 | 0.78mi |
| 13742 Blair Ln Magalia, CA | 3.0 | 2.0 | 1440 | $1,950 | $1.35 | 15d | 1 | 0.93mi |
| 14435 Skyway Magalia, CA | 2.0 | 2.0 | 1200 | $1,325 | $1.10 | 15d | 1 | 0.96mi |
HOA detail
- Monthly dues
- $29 · $348/yr
Listing history 2 events
-
2026-06-21remarks 699-char remark
-
2026-06-21$159,500 Active 1 DOM
ⓘ Source: listings_history table (triggers on properties + properties_extension) + one-shot
backfill from property_details.listing_events for pre-trigger history.
Tax reassessment forecast CA · Resets to sale price
- Current annual tax
- $730 · $61/mo
- Projected year-2 tax
- $1,212 · $101/mo
- Expected delta
- +$482/yr (+$40/mo · 66.0%)
ⓘ Screening estimate from a state-policy table — verify with the county assessor before closing.
Climate risk First Street
- Flood 1/10 Low FEMA zone X (unshaded) · 0% chance over 30 yrs
- Wildfire 6/10 Major
- Heat 4/10 Moderate 7 d/yr ≥96°F today · 17 d/yr by 30 yrs out
- Wind 1/10 Low
- Air quality 10/10 Extreme 37 unhealthy d/yr today · 42 by 30 yrs out
Nearby sold comps map
Loading sold comps map…
Walkable amenities ~0.75 mi
Loading nearby amenities…
Taxation est. · year 1
- Rental income
- $17,785
- − Mortgage interest
- −$8,934
- − Property taxes
- −$730
- − Insurance
- −$798
- − Repairs & maintenance
- −$1,423
- − Management
- −$1,423
- − HOA
- −$348
- − Depreciation
- −$4,640
- Taxable loss
- −$511
- Est. tax savings @ 24.0%
- +$123
- After-tax cash flow
- $2,260/yr
For passive investors: Depreciation is non-cash, so a rental often shows a tax loss while cash-flowing — sheltering income. Rental losses are passive: they offset passive income freely, and up to $25,000/yr can offset ordinary (W-2) income if you actively participate and your MAGI is under $100k (phasing out to $0 by $150k); unused losses carry forward. On sale, claimed depreciation is recaptured at up to 25%, and gains may owe capital-gains tax (a 1031 exchange can defer both). Figures are a year-1 estimate at your 24.0% rate — not tax advice; consult a CPA.
Schools (NCES district)
No district data.
Livability — Magalia
- Score
- 51/100
- State rank
- #1094
- US rank
- #25434
Category grades
Schools grade is shown separately in the Schools card above.
Census & demographics
- Census place
- Magalia, CA
- Population (ZIP)
- 8,488
Population outlook (Butte County) Hauer SSP2
- Today (2025)
- 237,527 people
- By 2030
- 243,804 · +2.6%
- By 2040
- 253,899 · +6.9%
- By 2050
- 262,561 · +10.5%
- By 2075
- 283,709 · +19.4%
- By 2100
- 282,689 · +19.0%
Race, ethnicity, and origin ACS 2023
- Neighborhood character
- Predominantly White (78%)
- Race & ethnicity
- White 78% Two or more races 12% Hispanic / Latino 10% Asian 2%
- Hispanic origin (detail)
- Mexican 7%
- Common ancestry
- Portuguese 4% Russian 3% Lithuanian 2%
- Foreign-born
- 4% · Canada, Vietnam, South Korea
- Languages at home
- 94% English-only · Spanish 3% Other Indo-European 1% Vietnamese 1%
Political lean MEDSL · Butte
- 2024 margin
- Toss-up / Even · D 46.8% · R 49.9% · Other 3.3%
- 2008→2024 swing
- -5.5pp toward R · 2008: 2.4pp · 2024: -3.1pp
- All cycles
- 2024: R+3.1 2020: D+1.7 2016: R+4.0 2012: R+3.9 2008: D+2.4
Not yet ingested
- Civics
- —
Market trends
- HPI YoY
- ▼ -83.49%
- Current HPI
- 194.8809
- Rent YoY
- —
- Metro
- —
- State GDP YoY
- ▲ 3.21%
- F500 in state
- 116
Industry mix (Fortune 500 HQ in CA)
| Industry | F500 HQs | Revenue |
|---|---|---|
| Technology | 27 | $1,492B |
|
||
| Financial Services | 3 | $174B |
|
||
| Retail | 3 | $44B |
|
||
| Insurance | 3 | $26B |
|
||
| Media / Entertainment | 2 | $115B |
|
||
| Pharmaceuticals / Biotech | 2 | $62B |
|
||
Price history
+431.7% since first listed10 events — show timeline
- 2026-06-20 Listed $159,500 CRMLS
- 2023-03-16 Sold (MLS) $70,000 CRMLS
- 2023-02-04 Pending — CRMLS
- 2023-01-27 Price Changed $94,500 CRMLS
- 2022-12-12 Price Changed $109,000 CRMLS
- 2022-12-01 Relisted — CRMLS
- 2022-11-22 Pending — CRMLS
- 2022-11-21 Listed $119,000 CRMLS
- 2004-11-03 Sold (Public Records) $55,000 Public Records
- 1994-02-07 Sold (Public Records) $30,000 Public Records
Property tax history
+3.5%/yrLatest (2025): $730 · +1.6% YoY. Source: county tax records.
Cash-flow waterfall
monthlySold comps — $/sqft
last 12 mo · ≤1 miLoading sold comps…