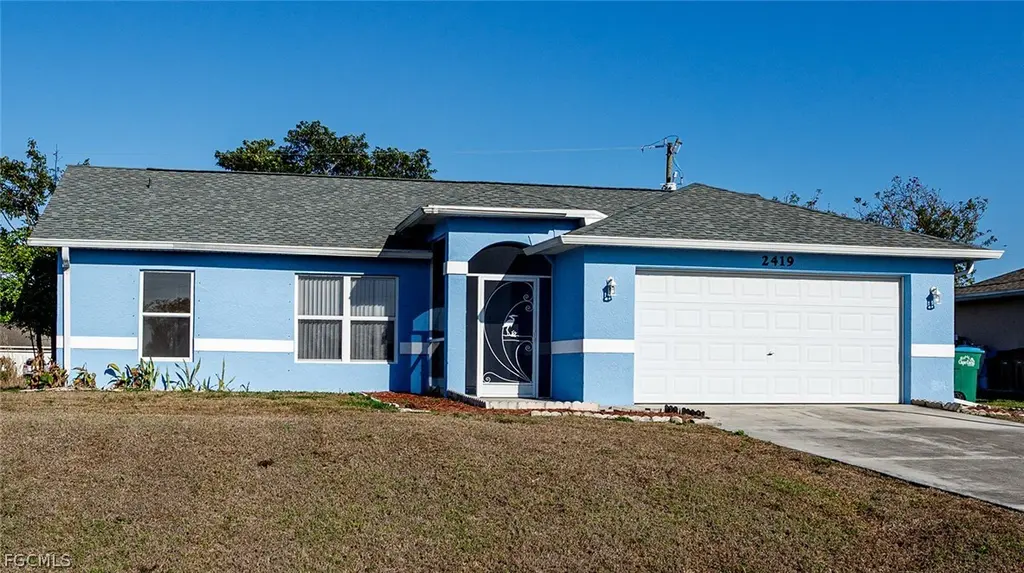
2419 NE 23rd Ave · Cape Coral, FL
Flood risk 1/10 · Minimal
- FEMA flood zone
- X (unshaded)
- Chance of flooding over 30 yrs
- 0.0%
- Est. flood insurance / yr
- $507 – $1,088
Fire risk 5/10 · Moderate
- Est. fire insurance / yr
- $947 – $1,759
Heat risk 10/10 · Severe
- Hot days now (above 107°F)
- 7 days/yr
- Hot days in 30 yrs
- 31 days/yr
Wind risk 10/10 · Severe
- Chance of severe wind over 30 yrs
- 99.0%
Air-quality risk 2/10 · Minimal
- Unhealthy air days now
- 1 days/yr
- Unhealthy air days in 30 yrs
- 1 days/yr
Risk factors via First Street. Map © Google.
Why this score? — see what drove the D grade
The composite is a weighted blend of 9 inputs, each scored 0–100. Each bar is that input's sub-score; the figure is the points it added to the 100-point composite (weight × sub-score).
- Cash flow +13.7/30.0
- ARV discount +11.2/15.0
- DSCR +4.2/10.0
- Schools +4.1/10.0
- Livability +3.9/5.0
- 1% rule +2.9/10.0
- Condition / age +2.5/5.0
- Rent growth +1.1/5.0
- Appreciation +0.0/10.0
$260,000
🖨 Deal sheet 📄 Offer letter ✓ Due diligence
Listing remarks
NEW ROOF, SPACIOUS BACKYARD & OPPORTUNITY TO PERSONALIZE! Welcome to this Northeast Cape Coral home offering 3 bedrooms, 2 baths, and approximately 1,206 square feet of living space. Inside, a functional split-bedroom floor plan, vaulted ceilings, and tile flooring throughout create a comfortable and practical layout. The kitchen opens to the dining and living areas, providing a seamless flow for everyday living and entertaining. The primary suite features a walk-in closet, while the screened front entry and rear lanai offer inviting spaces to relax and enjoy the Florida lifestyle. Recent improvements include a new roof (2023), new garage door, exterior paint, and a water well tank
Key facts
- Split-bedroom layout
- Walk-in closet
- Lanai
Tags
Property features AI
Finance
- Other: Lot is rectangular and paved, public maintained road access; Lot dimensions approximately 85 x 125 x 85 x 125; Lot exposure: East; Zoning: R1
- Financial info: Pets allowed
- HOA & community: No association fee
Exterior
- Parking: Attached 2-car garage with garage door opener; 2 covered parking spaces
- Security: Smoke detector(s)
- Utilities: Cable available; Septic tank; Well water
- Home design: Single-story home; Resale property; Faces west; Entry level: 1
- Construction: Block, concrete, and stucco construction; Shingle roof; Built on foundation consistent with block/concrete construction
- Exterior features: Lanai; Porch; Screened porch; Room for pool; Manual shutters; Smoke detectors
Interior
- Kitchen: Range; Dishwasher; Refrigerator
- Bedrooms: Split bedrooms (separate from main living area)
- Flooring: Tile flooring
- Bathrooms: 2 full bathrooms
- Heating & cooling: Central electric heating; Central electric cooling (central air)
- Interior features: Living/dining room layout; Vaulted ceilings; Split bedroom floor plan; Walk-in closets; Separate shower; Shower-only bath configuration; Single-hung and sliding windows; Unfurnished
- Laundry & utility: Washer and dryer included; Washer/dryer hookups in garage
Neighborhood map
What this means for you Summary
Snapshot
- This is a 3-bed/2.0-bath single-family listed at $260k.
Deal economics
- At list price, monthly cash flow is $21 ($256/yr) — positive.
- The deal already cash-flows at list — no discount required.
- To meet the 1% rule (rent ≥ 1% of price), the offer needs to be $204k (21.4% below list).
- Recommended offer: $204k (21.4% below list) — sets the bar for 1% rule.
- Cap rate 6.4% vs local median 3.1% in Cape Coral — top-decile yield for the area; either an underpriced asset or a hidden risk that comps aren't pricing in. Stress-test before assuming the spread holds.
Location & tenants
- Location reads 77/100 on livability (#208 in FL, #3,098 nationally) — a middle-class / working-renter tenant base. Strengths: housing A+, health & safety A+, amenities B+; Watch: commute F.
- Lee (suburban): math 47% / reading 50% proficiency, ranked #42 of 73 in FL (top 58%) — families likely to look elsewhere, expect single-tenant / working-renter base with shorter leases.
- Market conditions: Rents falling (-5.6%/yr); 1597 active listings in the ZIP; 20 comparable units currently listed for rent nearby; rentals leasing fast (median 11d on market — plan ~1-2 weeks tenant-placement turnaround); 15,411 units permitted in Lee County in 2024 (4,686 in 5+ unit buildings).
- This rent runs 34% of the median local income ($73k/yr) — at the standard rent-burdened threshold; future hikes will face affordability resistance.
Forward outlook
- Local home prices are declining (-3.0%/yr); year-one equity from $2k of loan paydown is wiped out by about $8k of value loss. Plan a longer hold.
- Lee County population projected at +44% by 2050 — long-run rental-demand tailwind backs the buy-and-hold thesis.
Negotiation context
- It's been on market 92 days — a 9% lower offer ($237k) is reasonable based on typical stale-listing flexibility.
- 3 sale attempts since 2y ago with the ask held roughly flat each time — persistent listings suggest the price (not the market) is what's stuck; bring a comps-based counter.
Risks & watch-outs
- Climate carrying-cost: severe wind risk, 99% chance of damaging wind over 30y; moderate wildfire risk; extreme-heat days projected 7→31/yr by 2055 (HVAC capex compounding) — expect insurance premiums to compound above CPI over the hold.
Questions for the listing agent
- It's been on market 92 days. Have you received any prior offers? Is the seller open to a 21% concession, seller financing, or rate buy-down credit?
- Why hasn't it sold? Are there any deal-killer items the seller is aware of (foundation, flood, title, zoning, code violations)?
- Is there a deadline driving the sale (1031 exchange, divorce, estate, relocation)? That informs how much negotiation room exists.
- Schools are B-rated — typically a magnet for longer-tenancy family renters. What's the average tenant stay here, and is there a school-zone premium baked into asking?
- The area grade is low — what's the realistic commute time and amenity access for the typical tenant pool here? Any planned neighborhood developments (good or bad) we should know about?
- What's the average days-on-market for RENTAL listings here right now (not sales)? A rising rental-DOM trend means longer vacancies and softer asking-rent achievability than the comps imply.
- What's the recent tenant-quality profile in this submarket — average credit score on applications, eviction rate, late-payment / NSF rate, and stable-employment percentage? A property-management company in the area should have these aggregated.
- How much new for-sale + rental construction is in the pipeline within 1–3 miles? Heavy new supply typically softens prices + rents 12–24 months out; constrained supply supports both.
Investment metrics
- 1% rule
- 0.79% ✗
- Cap rate
- 6.39%
- Cash-on-cash
- 0.35%
- DSCR
- 1.02
- GRM
- 10.6
CMA / ARV
- ARV (on-the-fly)
- $283,410
- Comps found
- 8
Show comp detail 8 sales within ~0.75 mi
| Address | Dist | Beds/Ba | Sqft | Sold | Price | $/sf | Match |
|---|---|---|---|---|---|---|---|
| 2128 NE 25th St | 0.16mi | 3/2.0 | 1,272 (+6%) | 12mo | $325,000 | $256 | 73 |
| 2017 NE 24th Ter | 0.39mi | 3/2.0 | 1,265 (+5%) | 5mo | $180,000 | $142 | 70 |
| 2010 NE 24th Ter | 0.42mi | 3/2.0 | 1,116 (-8%) | 0mo | $215,000 | $193 | 67 |
| 2127 NE 24th Ter | 0.16mi | 3/2.0 | 1,144 (-5%) | 20mo | $265,000 | $232 | 67 |
| 2038 NE 25th St | 0.31mi | 3/2.0 | 1,083 (-10%) | 10mo | $255,000 | $235 | 60 |
| 2612 NE 22nd Ave | 0.25mi | 3/2.0 | 1,362 (+13%) | 9mo | $330,000 | $242 | 59 |
| 1814 NE 23rd Ave | 0.71mi | 3/2.0 | 1,284 (+6%) | 14mo | $273,000 | $213 | 44 |
| 1804 NE 26th Ter | 0.72mi | 3/2.0 | 1,377 (+14%) | 22mo | $405,000 | $294 | 25 |
Match score weights: distance 35% · size 25% · config 20% · recency 20%. Top-matched comps best support the ARV.
Projected returns pro-forma
-3.0% appreciation · 0.0% rent growth · sell at horizon
- IRR
- -18.8%
- Equity multiple
- 0.36×
- Total profit
- $-46,860
- Equity at exit
- $38,767
- IRR
- -18.0%
- Equity multiple
- 0.14×
- Total profit
- $-62,594
- Equity at exit
- $22,480
Cash invested: $72,800 (down + closing). Projections, not guarantees.
Landlord ↔ Tenant lean methodology
- Overall (STATE)
- 87 Strongly Landlord-Friendly
- State Florida
- 87 Strongly Landlord-Friendly · R+3
- County
- — inherits STATE
- City
- — inherits STATE
ZIP-level market 33909
- Home prices YoY
- -23.1%
- Rents YoY
- -5.6%
- Active inventory
- 1597
- Price-to-rent
- 10.6×
Monthly cashflow live
- Estimated rent
- $2,045 high interval (Pro) →
- Mortgage (P&I)
- −$1,363
- Tax from tax record
- −$122 /mo · $1,465/yr
- Insurance
- −$108
- HOA
- −$0
- Vacancy / Maint / Mgmt
- −$429
- Net cashflow
- $21
Break-even live
UW: 25.0% down · 7.5% · 30yr · 1.5% tax · 5.0% vac · 8.0% maint · 8.0% mgmt
Financing live
Cash to close
- Down payment
- $65,000
- Closing costs
- $7,800
- Reserves months
- —
- Total cash needed
- —
Loan-product check · same deal, 3 products live
Conventional
25% down · 7.5% · 30yr
- Down + closing
- —
- Monthly P&I
- —
- Monthly cashflow
- —
- DSCR
- —
- Eligible?
- —
Personal DTI + credit; lowest rate.
DSCR
20% down · 8.5% · 30yr
- Down + closing
- —
- Monthly P&I
- —
- Monthly cashflow
- —
- DSCR
- —
- Eligible?
- —
No personal income docs; deal must DSCR.
Hard money
10% down · 12.0% · 12mo
- Down + closing
- —
- Monthly P&I
- —
- Monthly cashflow
- —
- DSCR
- —
- Eligible?
- —
Short-term bridge; refi at stabilization.
Rent comps 20 comps
| Address | Beds | Baths | Sqft | Rent | $/sqft | DOM | Units | Dist |
|---|---|---|---|---|---|---|---|---|
| 2116 NE 25th St Cape Coral, FL | 3.0 | 2.0 | 1352 | $1,891 | $1.40 | 3d | 1 | 0.18mi |
| 1871 Concordia Lake Cir #301 Cape Coral, FL | 3.0 | 2.0 | 1468 | $1,650 | $1.12 | 3d | 1 | 0.69mi |
| 571 Sunrise Ln North Fort Myers, FL | 2.0 | 2.0 | 1004 | $1,400 | $1.39 | 23d | 1 | 0.73mi |
| 1757 Concordia Lake Cir #3405 Cape Coral, FL | 2.0 | 2.0 | 1190 | $1,450 | $1.22 | 23d | 1 | 0.74mi |
| 1706 Kismet Pkwy E Cape Coral, FL | 3.0 | 2.0 | 1408 | $1,950 | $1.38 | 14d | 1 | 0.77mi |
| 1788 Concordia Lake Cir Cape Coral, FL | 2.0–3.0 | 2.0 | 1329 | $3,800 | $2.86 | 11d | 2 | 0.78mi |
| 13700 Oak St North Fort Myers, FL | 1.0–3.0 | 1.0–2.0 | 1023 | $2,465 | $2.41 | 3d | 32 | 0.97mi |
| 2108 NE 15th Pl Cape Coral, FL | 3.0 | 2.0 | 1422 | $2,266 | $1.59 | 3d | 1 | 1.08mi |
| 2221 NE 15th Ln Cape Coral, FL | 2.0 | 2.0 | 1400 | $1,675 | $1.20 | 16d | 1 | 1.10mi |
| 2309 NE 15th Ln Cape Coral, FL | 3.0 | 2.0 | 1250 | $1,595 | $1.28 | 3d | 1 | 1.10mi |
| 1409 NE 23rd St Cape Coral, FL | 3.0 | 2.0 | 1147 | $1,750 | $1.53 | 3d | 1 | 1.14mi |
| 2213 NE 33rd St Cape Coral, FL | 3.0 | 2.0 | 1385 | $1,800 | $1.30 | 23d | 1 | 1.21mi |
| 2112 NE 14th Ave Cape Coral, FL | 3.0 | 2.0 | 1472 | $1,941 | $1.32 | 3d | 1 | 1.24mi |
| 2006 NE 15th Ter Cape Coral, FL | 3.0 | 2.0 | 1141 | $1,999 | $1.75 | 10d | 1 | 1.24mi |
| 2700 Diplomat Pkwy E Cape Coral, FL | 1.0–3.0 | 1.0–2.0 | 1116 | $2,970 | $2.66 | 3d | 41 | 1.24mi |
| 2122 NE 13th Pl Cape Coral, FL | 3.0 | 2.0 | 1279 | $1,850 | $1.45 | 23d | 1 | 1.28mi |
| 3404 Rainbow Ln North Fort Myers, FL | 2.0 | 2.0 | 1056 | $1,800 | $1.70 | 3d | 1 | 1.38mi |
| 8791 Littleton Rd North Fort Myers, FL | 2.0 | 2.0 | 1074 | $1,549 | $1.44 | 23d | 1 | 1.39mi |
| 2505 Liberty Park Dr Cape Coral, FL | 1.0–2.0 | 1.0–2.0 | 1092 | $2,203 | $2.02 | 3d | 14 | 1.42mi |
| 28 Nyborg Ave North Fort Myers, FL | 3.0 | 2.0 | 1042 | $1,299 | $1.25 | 14d | 1 | 1.49mi |
Listing history 23 events
-
2026-06-17days on market $260,000 Active 92 DOM
-
2026-06-16days on market $260,000 Active 91 DOM
-
2026-06-15days on market $260,000 Active 90 DOM
-
2026-06-13pricedays on market $260,000 Active 88 DOM
-
2026-06-10days on market $265,000 Active 85 DOM
-
2026-06-09days on market $265,000 Active 84 DOM
-
2026-06-07remarks 695-char remark
-
2026-06-07days on market $265,000 Active 82 DOM
-
2026-06-03days on market $265,000 Active 78 DOM
-
2026-06-02days on market $265,000 Active 77 DOM
-
2026-06-01days on market $265,000 Active 76 DOM
-
2026-06-01days on market $265,000 Active 75 DOM
-
2026-03-16$265,000 Active
-
2025-06-30historical
-
2025-03-04price $270,000
-
2025-01-15price $275,000
-
2024-12-04$279,000 Active
-
2024-11-25historical
-
2024-10-28price $279,000
-
2024-08-16$289,000 Active
-
2005-12-21soldstatus $249,000
-
2002-08-30soldstatus $3,000
-
2002-08-07price $3,500
ⓘ Source: listings_history table (triggers on properties + properties_extension) + one-shot
backfill from property_details.listing_events for pre-trigger history.
Tax reassessment forecast FL · Resets to sale price
- Current annual tax
- $1,465 · $122/mo
- Projected year-2 tax
- $2,158 · $180/mo
- Expected delta
- +$693/yr (+$58/mo · 47.3%)
ⓘ Screening estimate from a state-policy table — verify with the county assessor before closing.
Climate risk First Street
- Flood 1/10 Low FEMA zone X (unshaded) · 0% chance over 30 yrs
- Wildfire 5/10 Major
- Heat 10/10 Extreme 7 d/yr ≥107°F today · 31 d/yr by 30 yrs out
- Wind 10/10 Extreme 99% chance of damaging wind over 30 yrs
- Air quality 2/10 Low 1 unhealthy d/yr today · 1 by 30 yrs out
Nearby sold comps map
Loading sold comps map…
Walkable amenities ~0.75 mi
Loading nearby amenities…
Taxation est. · year 1
- Rental income
- $24,535
- − Mortgage interest
- −$14,564
- − Property taxes
- −$1,465
- − Insurance
- −$1,300
- − Repairs & maintenance
- −$1,963
- − Management
- −$1,963
- − Depreciation
- −$7,564
- Taxable loss
- −$4,284
- Est. tax savings @ 24.0%
- +$1,028
- After-tax cash flow
- $1,284/yr
For passive investors: Depreciation is non-cash, so a rental often shows a tax loss while cash-flowing — sheltering income. Rental losses are passive: they offset passive income freely, and up to $25,000/yr can offset ordinary (W-2) income if you actively participate and your MAGI is under $100k (phasing out to $0 by $150k); unused losses carry forward. On sale, claimed depreciation is recaptured at up to 25%, and gains may owe capital-gains tax (a 1031 exchange can defer both). Figures are a year-1 estimate at your 24.0% rate — not tax advice; consult a CPA.
Schools (NCES district)
- District
- Lee
- NCES district ID
- 1201080
- Math proficiency
- 47% ▼ -11.00%
- Reading proficiency
- 50% ▼ -4.00%
- Median HH income
- $49,518
- Composite
- 41.49/100
- National rank
- #3458
- State rank
- #42 of 73 in FL
Livability — Cape Coral
- Score
- 77/100
- State rank
- #208
- US rank
- #3098
Category grades
Schools grade is shown separately in the Schools card above.
Census & demographics
- Census place
- Cape Coral, FL
- County
- Lee County · 788,662 people
- City population
- 217,388
- Metro
- Cape Coral-Fort Myers, FL
- Population (ZIP)
- 40,231
- Household income
- $73,053
- Rent vs Own
- Severe rent burden
- 1657.0
Population outlook (Lee County) Hauer SSP2
- Today (2025)
- 871,946 people
- By 2030
- 955,468 · +9.6%
- By 2040
- 1,113,587 · +27.7%
- By 2050
- 1,256,891 · +44.1%
- By 2075
- 1,560,270 · +78.9%
- By 2100
- 1,726,848 · +98.0%
Race, ethnicity, and origin ACS 2023
- Neighborhood character
- Diverse neighborhood (Simpson 0.55)
- Race & ethnicity
- White 56% Hispanic / Latino 36% Two or more races 24% Black 3% Asian 1%
- Hispanic origin (detail)
- Puerto Rican 7% Cuban 14% Dominican 4%
- Common ancestry
- Romanian 2% Lithuanian 2% Serbian 1%
- Foreign-born
- 20% · Canada, Jamaica
- Languages at home
- 69% English-only · Spanish 27% Other Indo-European 1% German/W. Germanic 1%
Political lean MEDSL · Lee
- 2024 margin
- Strong R (+28.4) · D 35.5% · R 63.9%
- 2008→2024 swing
- -18.0pp toward R · 2008: -10.4pp · 2024: -28.4pp
- All cycles
- 2024: R+28.4 2020: R+19.2 2016: R+20.4 2012: R+16.6 2008: R+10.4
Not yet ingested
- Civics
- —
Market trends
- HPI YoY
- ▼ -94.24%
- Current HPI
- 313.8761
- Rent YoY
- ▼ -5.60%
- Metro
- Cape Coral-Fort Myers, FL
- State GDP YoY
- ▲ 3.28%
- F500 in state
- 36
Industry mix (Fortune 500 HQ in FL)
| Industry | F500 HQs | Revenue |
|---|---|---|
| Industrial Technology | 2 | $29B |
|
||
| Insurance | 2 | $17B |
|
||
| Retail | 1 | $60B |
|
||
| Technology Distribution | 1 | $58B |
|
||
| Homebuilding | 1 | $35B |
|
||
| Technology Manufacturing | 1 | $35B |
|
||
Price history
+7471.4% since first listed11 events — show timeline
- 2026-03-16 Listed $265,000 FORTMLS
- 2025-06-30 Listing Removed — FORTMLS
- 2025-03-04 Price Changed $270,000 FORTMLS
- 2025-01-15 Price Changed $275,000 FORTMLS
- 2024-12-04 Listed $279,000 FORTMLS
- 2024-11-25 Listing Removed — FORTMLS
- 2024-10-28 Price Changed $279,000 FORTMLS
- 2024-08-16 Listed $289,000 FORTMLS
- 2005-12-21 Sold (Public Records) $249,000 Public Records
- 2002-08-30 Sold (MLS) $3,000 FORTMLS
- 2002-08-07 Price Changed $3,500 FORTMLS
Property tax history
+4.4%/yrLatest (2025): $1,465 · +5.4% YoY. Source: county tax records.
Cash-flow waterfall
monthlySold comps — $/sqft
last 12 mo · ≤1 miLoading sold comps…