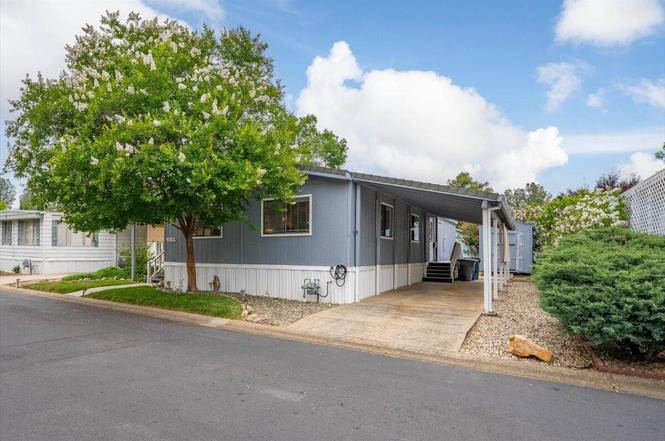
4578 Chippewa Ln #285 · Redding, CA
Flood risk 1/10 · Minimal
- FEMA flood zone
- X (unshaded)
- Chance of flooding over 30 yrs
- 0.0%
- Est. flood insurance / yr
- $507 – $1,088
Fire risk 7/10 · Major
- Est. fire insurance / yr
- $659 – $1,223
Heat risk 8/10 · Major
- Hot days now (above 106°F)
- 7 days/yr
- Hot days in 30 yrs
- 15 days/yr
Wind risk 1/10 · Minimal
- Chance of severe wind over 30 yrs
- —
Air-quality risk 10/10 · Severe
- Unhealthy air days now
- 37 days/yr
- Unhealthy air days in 30 yrs
- 40 days/yr
Risk factors via First Street. Map © Google.
Why this score? — see what drove the B- grade
The composite is a weighted blend of 9 inputs, each scored 0–100. Each bar is that input's sub-score; the figure is the points it added to the 100-point composite (weight × sub-score).
- Cash flow +30.0/30.0
- 1% rule +10.0/10.0
- DSCR +10.0/10.0
- ARV discount +6.1/15.0
- Rent growth +4.0/5.0
- Livability +3.8/5.0
- Schools +2.5/10.0
- Condition / age +2.5/5.0
- Appreciation +0.0/10.0
$90,000
🖨 Deal sheet 📄 Offer letter ✓ Due diligence
Listing remarks
Welcome to easy living in this well-maintained 2-bedroom, 2-bath manufactured home located in a desirable all-age community with outstanding amenities. Offering a comfortable and functional floor plan, this home features indoor laundry, spacious living areas, and a welcoming patio perfect for enjoying your morning coffee or relaxing evenings outdoors. The easy-care landscaping provides low-maintenance living, allowing more time to enjoy the community pool, clubhouse, and resident activities. Clean, bright, and move-in ready, this home offers exceptional value for buyers seeking comfort, convenience, and affordability. Ideally situated near shopping, grocery stores, restaurants, schools, par
Key facts
- Clubhouse
- Community pool
- Indoor laundry
Tags
Property features AI
Finance
- HOA & community: Located in Mountain Shadows park
Exterior
- Parking: Has carport (1 space); Attached carport; Off-street parking; Guest parking
- Utilities: Public water
- Home design: Manufactured home located in a park; Mobile home
- Construction: Wood siding; Metal skirting; Metal roof; Pillar/post/pier foundation; Built as a manufactured home (model: United States)
- Exterior features: Deck; Level topography; Asphalt road frontage on a county road
Interior
- Kitchen: Dishwasher; Disposal; Microwave; Range/Oven; Refrigerator
- Flooring: Vinyl flooring; Carpet
- Heating & cooling: Central air conditioning; Forced air heating
- Interior features: Dishwasher; Disposal; Microwave; Range/Oven; Refrigerator; No fireplace
- Laundry & utility: Washer; Dryer
Neighborhood map
What this means for you Summary
Snapshot
- This is a 2-bed/2.0-bath manufactured listed at $90k.
Deal economics
- At list price, monthly cash flow is $593 ($7k/yr) — positive.
- The deal already cash-flows at list — no discount required.
- Meets the 1% rule at list price ($2k rent vs $90k).
- Cap rate 14.2% vs local median 3.3% in Redding — top-decile yield for the area; either an underpriced asset or a hidden risk that comps aren't pricing in. Stress-test before assuming the spread holds.
Location & tenants
- Location reads 76/100 on livability (#106 in CA, #3,726 nationally) — a middle-class / working-renter tenant base. Strengths: amenities A+, commute A+, health & safety A+; Watch: employment C-, crime F, cost of living F.
- Gateway Unified (suburban): math 25% / reading 35% proficiency, ranked #355 of 517 in CA (top 69%) — families likely to look elsewhere, expect single-tenant / working-renter base with shorter leases.
- Market conditions: Rents rising fast (+6.0%/yr); 391 active listings in the ZIP; 12 comparable units currently listed for rent nearby; rentals at typical pace (median 21d on market — plan ~3-4 weeks tenant-placement turnaround); 246 units permitted in Shasta County in 2024 (0 in 5+ unit buildings).
Forward outlook
- Local home prices are declining (-3.0%/yr); year-one equity from $622 of loan paydown is wiped out by about $3k of value loss. Plan a longer hold.
- Shasta County population projected to shrink 9% by 2050 — rents likely to lag national; underwrite the cash flow, not the appreciation.
- At projected returns (-3.0% appreciation + 6.0% rent growth), your $25k cash investment doubles in ~4 years — after that, you're playing with house money.
Negotiation context
- Only 9 days on market — expect competitive offers; lowballing is unlikely to land.
Risks & watch-outs
- Climate carrying-cost: major wildfire risk; extreme-heat days projected 7→15/yr by 2055 (HVAC capex compounding) — expect insurance premiums to compound above CPI over the hold.
Questions for the listing agent
- Is there a deadline driving the sale (1031 exchange, divorce, estate, relocation)? That informs how much negotiation room exists.
- Schools are B-rated — typically a magnet for longer-tenancy family renters. What's the average tenant stay here, and is there a school-zone premium baked into asking?
- Crime grade is F in this area — have there been break-ins, vandalism, or insurance claims at this property in the last 3 years? What carrier currently insures it and at what premium?
- What's the average days-on-market for RENTAL listings here right now (not sales)? A rising rental-DOM trend means longer vacancies and softer asking-rent achievability than the comps imply.
- What's the recent tenant-quality profile in this submarket — average credit score on applications, eviction rate, late-payment / NSF rate, and stable-employment percentage? A property-management company in the area should have these aggregated.
- How much new for-sale + rental construction is in the pipeline within 1–3 miles? Heavy new supply typically softens prices + rents 12–24 months out; constrained supply supports both.
Investment metrics
- 1% rule
- 1.71% ✓
- Cap rate
- 14.20%
- Cash-on-cash
- 28.25%
- DSCR
- 2.26
- GRM
- 4.9
CMA / ARV
- ARV (on-the-fly)
- $87,360
- Comps found
- 12
Show comp detail 12 sales within ~0.75 mi
| Address | Dist | Beds/Ba | Sqft | Sold | Price | $/sf | Match |
|---|---|---|---|---|---|---|---|
| 458 Balsawood Dr | 0.35mi | 2/2.0 | 1,344 (0%) | 1mo | $60,000 | $45 | 83 |
| 4555 Underwood Dr | 0.30mi | 2/2.0 | 1,440 (+7%) | 1mo | $99,000 | $69 | 73 |
| 1350 Aztec Path #229 | 0.18mi | 2/2.0 | 1,456 (+8%) | 6mo | $95,000 | $65 | 73 |
| 301 Sapwood Dr #280 | 0.30mi | 2/2.0 | 1,440 (+7%) | 4mo | $65,900 | $46 | 71 |
| 323 Sapwood Dr Sp# 279 Dr | 0.29mi | 2/2.0 | 1,440 (+7%) | 4mo | $89,000 | $62 | 71 |
| 477 Logwood Dr Sp# 230 Dr | 0.26mi | 2/2.0 | 1,440 (+7%) | 7mo | $82,000 | $57 | 70 |
| 4587 Hardwood Blvd Sp#202 Blvd | 0.21mi | 3/2.0 (+1) | 1,440 (+7%) | 7mo | $95,000 | $66 | 67 |
| 4576 Hickory Trl | 0.19mi | 3/2.0 (+1) | 1,200 (-11%) | 2mo | $119,000 | $99 | 67 |
| 1318 Mountain Shadows Blvd #255 | 0.07mi | 3/2.0 (+1) | 1,144 (-15%) | 2mo | $95,000 | $83 | 66 |
| 4719 Maple Trl | 0.27mi | 3/2.0 (+1) | 1,520 (+13%) | 3mo | $181,500 | $119 | 58 |
| 362 Lemon Dr #24 | 0.52mi | 3/2.0 (+1) | 1,248 (-7%) | 2mo | $76,100 | $61 | 57 |
| 4649 Underwood Dr #257 | 0.33mi | 3/2.0 (+1) | 1,536 (+14%) | 4mo | $75,000 | $49 | 52 |
Match score weights: distance 35% · size 25% · config 20% · recency 20%. Top-matched comps best support the ARV.
Projected returns pro-forma
-3.0% appreciation · 5.98% rent growth · sell at horizon
- IRR
- 25.8%
- Equity multiple
- 2.11×
- Total profit
- $27,967
- Equity at exit
- $13,419
- IRR
- 35.3%
- Equity multiple
- 4.72×
- Total profit
- $93,813
- Equity at exit
- $7,782
Cash invested: $25,200 (down + closing). Projections, not guarantees.
Landlord ↔ Tenant lean methodology
- Overall (STATE)
- 18 Strongly Tenant-Friendly
- State California
- 18 Strongly Tenant-Friendly · D+13
- County
- — inherits STATE
- City
- — inherits STATE
ZIP-level market 96003
- Rents YoY
- 6.0%
- Active inventory
- 391
- Price-to-rent
- 4.9×
Monthly cashflow live
- Estimated rent
- $1,538 high interval (Pro) →
- Mortgage (P&I)
- −$472
- Tax est. 1.5%
- −$112 /mo · $1,350/yr
- Insurance
- −$38
- HOA
- −$0
- Vacancy / Maint / Mgmt
- −$323
- Net cashflow
- $593
Break-even live
UW: 25.0% down · 7.5% · 30yr · 1.5% tax · 5.0% vac · 8.0% maint · 8.0% mgmt
Financing live
Cash to close
- Down payment
- $22,500
- Closing costs
- $2,700
- Reserves months
- —
- Total cash needed
- —
Loan-product check · same deal, 3 products live
Conventional
25% down · 7.5% · 30yr
- Down + closing
- —
- Monthly P&I
- —
- Monthly cashflow
- —
- DSCR
- —
- Eligible?
- —
Personal DTI + credit; lowest rate.
DSCR
20% down · 8.5% · 30yr
- Down + closing
- —
- Monthly P&I
- —
- Monthly cashflow
- —
- DSCR
- —
- Eligible?
- —
No personal income docs; deal must DSCR.
Hard money
10% down · 12.0% · 12mo
- Down + closing
- —
- Monthly P&I
- —
- Monthly cashflow
- —
- DSCR
- —
- Eligible?
- —
Short-term bridge; refi at stabilization.
Rent comps 12 comps
| Address | Beds | Baths | Sqft | Rent | $/sqft | DOM | Units | Dist |
|---|---|---|---|---|---|---|---|---|
| 4433 White River Dr Redding, CA | 2.0 | 2.0 | 1100 | $1,500 | $1.36 | 43d | 1 | 0.21mi |
| 4296 Clay St Unit 17 Redding, CA | 2.0 | 1.5 | 900 | $1,395 | $1.55 | 21d | 1 | 0.32mi |
| 4490 Alder St Unit C Redding, CA | 2.0 | 1.0 | 900 | $1,150 | $1.28 | 21d | 1 | 0.33mi |
| 701 Redwood Blvd Redding, CA | 2.0 | 1.5–2.5 | 1163 | $1,820 | $1.56 | 13d | 1 | 0.44mi |
| 400 Lake Blvd Redding, CA | 2.0 | 1.5 | 900 | $1,310 | $1.46 | 13d | 1 | 0.45mi |
| 4288 Bradley Dr Redding, CA | 3.0 | 2.0 | 1008 | $1,950 | $1.93 | 21d | 1 | 0.49mi |
| 636 Lake Blvd Redding, CA | 2.0–3.0 | 1.0–2.0 | 986 | $1,295 | $1.31 | 13d | 8 | 0.49mi |
| 150 Masonic Ave Unit 1 Redding, CA | 2.0 | 1.5 | 924 | $1,400 | $1.52 | 13d | 1 | 0.73mi |
| 170 Masonic Ave #4 Redding, CA | 2.0 | 1.5 | 924 | $1,400 | $1.52 | 13d | 1 | 0.74mi |
| 5391 Stonethrow Ct Redding, CA | 3.0 | 2.0 | 1100 | $1,895 | $1.72 | 43d | 1 | 0.80mi |
| 3465 Magnums Way Apt 2 Redding, CA | 3.0 | 2.0 | 1080 | $1,775 | $1.64 | 43d | 1 | 1.03mi |
| 251 Hilltop Dr Redding, CA | 1.0–2.0 | 1.0–2.0 | 757 | $1,475 | $1.95 | 13d | 1 | 1.11mi |
Listing history 8 events
-
2026-06-19days on market $90,000 Active 9 DOM
-
2026-06-18days on market $90,000 Active 8 DOM
-
2026-06-17days on market $90,000 Active 7 DOM
-
2026-06-16days on market $90,000 Active 6 DOM
-
2026-06-15days on market $90,000 Active 5 DOM
-
2026-06-14days on market $90,000 Active 3 DOM
-
2026-06-13remarks 699-char remark
-
2026-06-13$90,000 Active 2 DOM
ⓘ Source: listings_history table (triggers on properties + properties_extension) + one-shot
backfill from property_details.listing_events for pre-trigger history.
Climate risk First Street
- Flood 1/10 Low FEMA zone X (unshaded) · 0% chance over 30 yrs
- Wildfire 7/10 Severe
- Heat 8/10 Severe 7 d/yr ≥106°F today · 15 d/yr by 30 yrs out
- Wind 1/10 Low
- Air quality 10/10 Extreme 37 unhealthy d/yr today · 40 by 30 yrs out
Nearby sold comps map
Loading sold comps map…
Walkable amenities ~0.75 mi
Loading nearby amenities…
Taxation est. · year 1
- Rental income
- $18,458
- − Mortgage interest
- −$5,041
- − Property taxes
- −$1,350
- − Insurance
- −$450
- − Repairs & maintenance
- −$1,477
- − Management
- −$1,477
- − Depreciation
- −$2,618
- Taxable income
- $6,045
- Est. tax owed @ 24.0%
- −$1,451
- After-tax cash flow
- $5,667/yr
For passive investors: Depreciation is non-cash, so a rental often shows a tax loss while cash-flowing — sheltering income. Rental losses are passive: they offset passive income freely, and up to $25,000/yr can offset ordinary (W-2) income if you actively participate and your MAGI is under $100k (phasing out to $0 by $150k); unused losses carry forward. On sale, claimed depreciation is recaptured at up to 25%, and gains may owe capital-gains tax (a 1031 exchange can defer both). Figures are a year-1 estimate at your 24.0% rate — not tax advice; consult a CPA.
Schools (NCES district)
- District
- Gateway Unified
- NCES district ID
- 0614950
- Math proficiency
- 25% ▼ -5.00%
- Reading proficiency
- 35% ▲ 2.00%
- Median HH income
- $41,888
- Composite
- 25.39/100
- National rank
- #7465
- State rank
- #355 of 517 in CA
Livability — Redding
- Score
- 76/100
- State rank
- #106
- US rank
- #3726
Category grades
Schools grade is shown separately in the Schools card above.
Census & demographics
- Census place
- Redding, CA
- County
- Shasta County · 147,641 people
- City population
- 112,523
- Metro
- Redding, CA
- Population (ZIP)
- 44,923
- Household income
- $72,445
- Rent vs Own
- Severe rent burden
- 1668.0
Population outlook (Shasta County) Hauer SSP2
- Today (2025)
- 179,231 people
- By 2030
- 176,953 · -1.3%
- By 2040
- 169,982 · -5.2%
- By 2050
- 162,547 · -9.3%
- By 2075
- 145,649 · -18.7%
- By 2100
- 123,025 · -31.4%
Race, ethnicity, and origin ACS 2023
- Neighborhood character
- Predominantly White (76%)
- Race & ethnicity
- White 76% Hispanic / Latino 11% Two or more races 10% Asian 4% Native American 1% Black 1%
- Hispanic origin (detail)
- Mexican 7%
- Common ancestry
- Italian 5% Slovak 3% Lithuanian 3%
- Foreign-born
- 6% · Canada, China
- Languages at home
- 92% English-only · Spanish 3% German/W. Germanic 1% Other Asian/Pacific 1%
Political lean MEDSL · Shasta
- 2024 margin
- Solid R (+36.5) · D 30.5% · R 67.0% · Other 2.5%
- 2008→2024 swing
- -10.7pp toward R · 2008: -25.8pp · 2024: -36.5pp
- All cycles
- 2024: R+36.5 2020: R+33.1 2016: R+37.4 2012: R+30.3 2008: R+25.8
Not yet ingested
- Civics
- —
Market trends
- HPI YoY
- ▼ -181.66%
- Current HPI
- 152.3069
- Rent YoY
- ▲ 5.98%
- Metro
- Redding, CA
- State GDP YoY
- ▲ 3.21%
- F500 in state
- 116
Industry mix (Fortune 500 HQ in CA)
| Industry | F500 HQs | Revenue |
|---|---|---|
| Technology | 27 | $1,492B |
|
||
| Financial Services | 3 | $174B |
|
||
| Retail | 3 | $44B |
|
||
| Insurance | 3 | $26B |
|
||
| Media / Entertainment | 2 | $115B |
|
||
| Pharmaceuticals / Biotech | 2 | $62B |
|
||
Price history
1 event — show timeline
- 2026-06-11 Listed $90,000 SAOR
Property tax history
-2.1%/yrLatest (2020): $116 · +1.2% YoY. Source: county tax records.
Cash-flow waterfall
monthlySold comps — $/sqft
last 12 mo · ≤1 miLoading sold comps…