1210 SW 12th Ave · Amarillo, TX
Flood risk 1/10 · Minimal
- FEMA flood zone
- X (unshaded)
- Chance of flooding over 30 yrs
- 0.0%
- Est. flood insurance / yr
- $507 – $1,088
Fire risk 2/10 · Minimal
- Est. fire insurance / yr
- $1,222 – $2,270
Heat risk 4/10 · Minor
- Hot days now (above 97°F)
- 6 days/yr
- Hot days in 30 yrs
- 18 days/yr
Wind risk 2/10 · Minimal
- Chance of severe wind over 30 yrs
- —
Air-quality risk 2/10 · Minimal
- Unhealthy air days now
- 1 days/yr
- Unhealthy air days in 30 yrs
- 1 days/yr
Risk factors via First Street. Map © Google.
Why this score? — see what drove the F grade
The composite is a weighted blend of 9 inputs, each scored 0–100. Each bar is that input's sub-score; the figure is the points it added to the 100-point composite (weight × sub-score).
- ARV discount +7.5/15.0
- Cash flow +7.2/30.0
- Schools +3.6/10.0
- Livability +3.3/5.0
- 1% rule +2.5/10.0
- Rent growth +2.5/5.0
- Condition / age +2.5/5.0
- DSCR +1.3/10.0
- Appreciation +0.0/10.0
$105,000
🖨 Deal sheet (PDF) 📄 Offer letter ✓ Due diligence
Listing remarks MLS
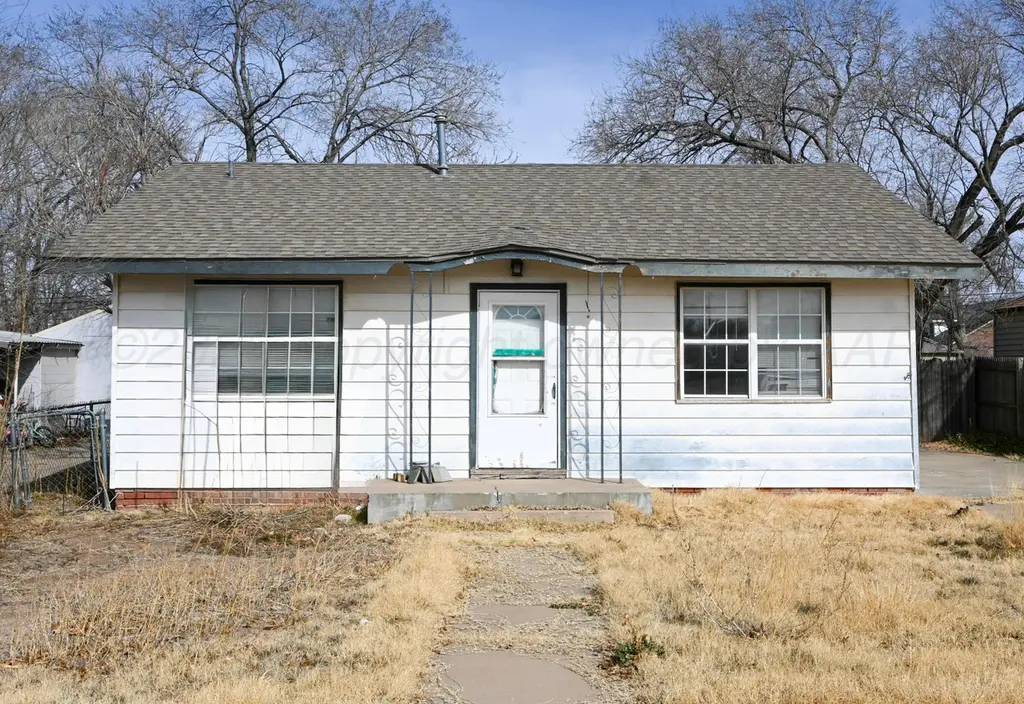
BANK OWNED Home being sold ' AS IS' . This home is right across the street from St. Mary's School, and is a charming home with so much potential. Large size backyard. This is a great fixer upper or investment property. Home has newer windows.
Key facts
- Large size backyard
- New windows
- Built 1927
Tags
Neighborhood map
What this means for you Summary
Snapshot
- This is a 2-bed/1.0-bath single-family listed at $105k.
Deal economics
- At list price, monthly cash flow is $-146 ($-2k/yr) — negative.
- To cash-flow at today's rent, offer at most $79k (24.6% below list).
- To meet the 1% rule (rent ≥ 1% of price), the offer needs to be $79k (25.0% below list).
- Recommended offer: $79k (25.0% below list) — sets the bar for 1% rule.
Location & tenants
- Location reads 66/100 on livability (#624 in TX) — a middle-class / working-renter tenant base. Strengths: cost of living A+, housing A+; Watch: amenities C-, schools D, crime F.
- Amarillo ISD (urban): math 44% / reading 41% proficiency, ranked #336 of 826 in TX (top 41%) — families likely to look elsewhere, expect single-tenant / working-renter base with shorter leases.
- Market conditions: 37 active listings in the ZIP; 17 comparable units currently listed for rent nearby; rentals at typical pace (median 22d on market — plan ~3-4 weeks tenant-placement turnaround); 1,214 units permitted in Potter County in 2024 (650 in 5+ unit buildings).
Forward outlook
- Local home prices are declining (-3.0%/yr); year-one equity from $726 of loan paydown is wiped out by about $3k of value loss. Plan a longer hold.
Negotiation context
- It's been on market 115 days — a 9% lower offer ($96k) is reasonable based on typical stale-listing flexibility.
Risks & watch-outs
- Watch-outs: built in 1927 — expect roof / HVAC / electrical / plumbing capex.
Questions for the listing agent
- What do current leases actually rent for vs. the listed asking? Can we see a recent rent roll and the last 12 months of T-12 income?
- It's been on market 115 days. Have you received any prior offers? Is the seller open to a 25% concession, seller financing, or rate buy-down credit?
- Built in 1927 — when were the roof, HVAC, electrical panel, plumbing, and water heater last replaced?
- Why hasn't it sold? Are there any deal-killer items the seller is aware of (foundation, flood, title, zoning, code violations)?
- Is there a deadline driving the sale (1031 exchange, divorce, estate, relocation)? That informs how much negotiation room exists.
- Schools are D-rated, which usually means shorter tenancies and higher turnover. Who's the typical renter profile here, and what's been the actual vacancy rate?
- Crime grade is F in this area — have there been break-ins, vandalism, or insurance claims at this property in the last 3 years? What carrier currently insures it and at what premium?
- The area grade is low — what's the realistic commute time and amenity access for the typical tenant pool here? Any planned neighborhood developments (good or bad) we should know about?
- What's the average days-on-market for RENTAL listings here right now (not sales)? A rising rental-DOM trend means longer vacancies and softer asking-rent achievability than the comps imply.
- What's the recent tenant-quality profile in this submarket — average credit score on applications, eviction rate, late-payment / NSF rate, and stable-employment percentage? A property-management company in the area should have these aggregated.
- How much new for-sale + rental construction is in the pipeline within 1–3 miles? Heavy new supply typically softens prices + rents 12–24 months out; constrained supply supports both.
Investment metrics
- 1% rule
- 0.75% ✗
- Cap rate
- 4.62%
- Cash-on-cash
- -5.97%
- DSCR
- 0.73
- GRM
- 11.1
CMA / ARV
- ARV (median comp)
- $211,426
- List price
- $105,000
- Delta
- -50.34%
- Verdict
- UNDERPRICED
- Comps
- 1 within 2.0 mi
Projected returns pro-forma
-3.0% appreciation · 3.0% rent growth · sell at horizon
- IRR
- -26.5%
- Equity multiple
- 0.11×
- Total profit
- $-26,289
- Equity at exit
- $15,656
- IRR
- -23.5%
- Equity multiple
- -0.18×
- Total profit
- $-34,728
- Equity at exit
- $9,078
Cash invested: $29,400 (down + closing). Projections, not guarantees.
Landlord ↔ Tenant lean methodology
- Overall (STATE)
- 87 Strongly Landlord-Friendly
- State Texas
- 87 Strongly Landlord-Friendly · R+5
- County
- — inherits STATE
- City
- — inherits STATE
ZIP-level market 79102
- Home prices YoY
- -33.0%
- Active inventory
- 37
- Price-to-rent
- 11.1×
Monthly cashflow live
- Estimated rent
- $787 high interval (Pro) →
- Mortgage (P&I)
- −$551
- Tax from tax record
- −$174 /mo · $2,087/yr
- Insurance
- −$44
- HOA
- −$0
- Vacancy / Maint / Mgmt
- −$165
- Net cashflow
- $-146
Break-even live
Sensitivity live
| Price | -10% $-87 | -5% $-116 | +0% $-146 | +5% $-176 | +10% $-206 |
|---|---|---|---|---|---|
| Rent | -10% $-208 | -5% $-177 | +0% $-146 | +5% $-115 | +10% $-84 |
| Rate | -1.0pp $-93 | -0.5pp $-120 | base $-146 | +0.5pp $-173 | +1.0pp $-201 |
UW: 25.0% down · 7.5% · 30yr · 1.5% tax · 5.0% vac · 8.0% maint · 8.0% mgmt
Financing live
Cash to close
- Down payment
- $26,250
- Closing costs
- $3,150
- Reserves months
- —
- Total cash needed
- —
Loan-product check · same deal, 3 products live
Conventional
25% down · 7.5% · 30yr
- Down + closing
- —
- Monthly P&I
- —
- Monthly cashflow
- —
- DSCR
- —
- Eligible?
- —
Personal DTI + credit; lowest rate.
DSCR
20% down · 8.5% · 30yr
- Down + closing
- —
- Monthly P&I
- —
- Monthly cashflow
- —
- DSCR
- —
- Eligible?
- —
No personal income docs; deal must DSCR.
Hard money
10% down · 12.0% · 12mo
- Down + closing
- —
- Monthly P&I
- —
- Monthly cashflow
- —
- DSCR
- —
- Eligible?
- —
Short-term bridge; refi at stabilization.
Rent comps 17 comps
| Address | Beds | Baths | Sqft | Rent | $/sqft | DOM | Units | Dist |
|---|---|---|---|---|---|---|---|---|
| 1506 SW 11th Ave Unit A Amarillo, TX | 1.0 | 1.0 | 608 | $650 | $1.07 | 45d | 1 | 0.20mi |
| 1212 SW 9th Ave Unit A Amarillo, TX | 1.0 | 1.0 | 550 | $770 | $1.40 | 22d | 1 | 0.22mi |
| 709 SW 14th Ave Unit 4 Amarillo, TX | 1.0 | 1.0 | 700 | $695 | $0.99 | 22d | 1 | 0.35mi |
| 612 SW 17th Ave Amarillo, TX | 1.0 | 1.0 | 1008 | $650 | $0.64 | 22d | 1 | 0.54mi |
| 2030 S Hayden St Amarillo, TX | 1.0 | 1.0 | 630 | $650 | $1.03 | 14d | 1 | 0.74mi |
| 2306 SW 8th Ave Amarillo, TX | 2.0 | 1.0 | 553 | $950 | $1.72 | 22d | 1 | 0.78mi |
| 2306 SW 8th Ave Unit 2 Amarillo, TX | 2.0 | 1.0 | 700 | $950 | $1.36 | 45d | 1 | 0.78mi |
| 1616 1 S Polk St Unit 1 Amarillo, TX | 1.0 | 1.0 | 530 | $525 | $0.99 | 45d | 1 | 0.85mi |
| 2700 W 16th Ave Amarillo, TX | 1.0 | 1.0 | 693 | $830 | $1.20 | 14d | 1 | 0.96mi |
| 705 S Florida St Amarillo, TX | 2.0 | 1.0 | 1014 | $850 | $0.84 | 22d | 1 | 0.99mi |
| 802 S Kentucky St Amarillo, TX | 2.0 | 1.0 | 970 | $899 | $0.93 | 45d | 1 | 1.05mi |
| 3118 SW 15th Ave Amarillo, TX | 2.0–3.0 | 1.0–2.0 | 1015 | $640 | $0.63 | 14d | 17 | 1.10mi |
| 9 S Polk St Unit 9 Amarillo, TX | 1.0 | 1.0 | 530 | $525 | $0.99 | 14d | 1 | 1.16mi |
| 2216 S Polk St Apt D Amarillo, TX | 1.0 | 1.0 | 544 | $575 | $1.06 | 45d | 1 | 1.19mi |
| 1008 S Mississippi St Amarillo, TX | 3.0 | 2.0 | 1061 | $1,275 | $1.20 | 22d | 1 | 1.23mi |
| 2400 S Polk St #204 Amarillo, TX | 1.0 | 1.0 | 549 | $1,300 | $2.37 | 45d | 1 | 1.26mi |
| 108 N Florida St Amarillo, TX | 2.0 | 1.0 | 960 | $800 | $0.83 | 22d | 1 | 1.37mi |
Listing history 18 events
-
2026-06-21days on market $105,000 Active 115 DOM
-
2026-06-18days on market $105,000 Active 112 DOM
-
2026-06-17days on market $105,000 Active 111 DOM
-
2026-06-16days on market $105,000 Active 110 DOM
-
2026-06-15days on market $105,000 Active 109 DOM
-
2026-06-14days on market $105,000 Active 107 DOM
-
2026-06-13days on market $105,000 Active 106 DOM
-
2026-06-10days on market $105,000 Active 104 DOM
-
2026-06-09days on market $105,000 Active 103 DOM
-
2026-06-08days on market $105,000 Active 102 DOM
-
2026-06-07days on market $105,000 Active 101 DOM
-
2026-06-03days on market $105,000 Active 97 DOM
-
2026-06-02days on market $105,000 Active 96 DOM
-
2026-06-01days on market $105,000 Active 95 DOM
-
2026-05-31days on market $105,000 Active 94 DOM
-
2026-05-30days on market $105,000 Active 93 DOM
-
2026-02-26$105,000 Active 242-char remark
Show marketing remark (242 chars)
BANK OWNED Home being sold ' AS IS' . This home is right across the street from St. Mary's School, and is a charming home with so much potential. Large size backyard. This is a great fixer upper or investment property. Home has newer windows.
-
1999-09-23soldstatus 228-char remark
Show marketing remark (228 chars)
BIVINS! STEEL SIDED HOME WITH LARGE LIVING ROOM & MOCK FIREPLACE * HAS SEPARATE DINING ROOM, UTILITY ROOM * CENTRAL HEATING AND AIR * NEW PAINT ON OUTSIDE * FOR FULL PRICE CONV CONTRACT SELLER WILL PAY UP TO $1000 CC OR PP
ⓘ Source: listings_history table (triggers on properties + properties_extension) + one-shot
backfill from property_details.listing_events for pre-trigger history.
Tax reassessment forecast TX · Resets to sale price
- Current annual tax
- $2,087 · $174/mo
- Projected year-2 tax
- $2,087 · $174/mo
- Expected delta
- $0/yr ($0/mo · 0.0%)
ⓘ Screening estimate from a state-policy table — verify with the county assessor before closing.
Climate risk First Street
- Flood 1/10 Low FEMA zone X (unshaded) · 0% chance over 30 yrs
- Wildfire 2/10 Low
- Heat 4/10 Moderate 6 d/yr ≥97°F today · 18 d/yr by 30 yrs out
- Wind 2/10 Low
- Air quality 2/10 Low 1 unhealthy d/yr today · 1 by 30 yrs out
Nearby sold comps map
Loading sold comps map…
Walkable amenities ~0.75 mi
Loading nearby amenities…
Taxation est. · year 1
- Rental income
- $9,449
- − Mortgage interest
- −$5,882
- − Property taxes
- −$2,087
- − Insurance
- −$525
- − Repairs & maintenance
- −$756
- − Management
- −$756
- − Depreciation
- −$3,055
- Taxable loss
- −$3,611
- Est. tax savings @ 24.0%
- +$867
- After-tax cash flow
- $-888/yr
For passive investors: Depreciation is non-cash, so a rental often shows a tax loss while cash-flowing — sheltering income. Rental losses are passive: they offset passive income freely, and up to $25,000/yr can offset ordinary (W-2) income if you actively participate and your MAGI is under $100k (phasing out to $0 by $150k); unused losses carry forward. On sale, claimed depreciation is recaptured at up to 25%, and gains may owe capital-gains tax (a 1031 exchange can defer both). Figures are a year-1 estimate at your 24.0% rate — not tax advice; consult a CPA.
Schools (NCES district)
- District
- Amarillo ISD
- NCES district ID
- 4808130
- Math proficiency
- 44% ▼ -9.00%
- Reading proficiency
- 41% ▼ -3.00%
- Median HH income
- $43,478
- Composite
- 35.96/100
- National rank
- #4798
- State rank
- #336 of 826 in TX
Livability — Amarillo
- Score
- 66/100
- State rank
- #624
- US rank
- #11876
Category grades
Schools grade is shown separately in the Schools card above.
Census & demographics
- Census place
- Amarillo, TX
- County
- Potter County · 72,216 people
- City population
- 185,802
- Metro
- Amarillo, TX
- Population (ZIP)
- 9,393
- Household income
- $51,125
- Rent vs Own
- Severe rent burden
- 487.0
Population outlook (Potter County) Hauer SSP2
- Today (2025)
- 121,296 people
- By 2030
- 120,883 · -0.3%
- By 2040
- 119,668 · -1.3%
- By 2050
- 117,788 · -2.9%
- By 2075
- 110,250 · -9.1%
- By 2100
- 92,923 · -23.4%
Race, ethnicity, and origin ACS 2023
- Neighborhood character
- Diverse neighborhood (Simpson 0.58)
- Race & ethnicity
- White 50% Hispanic / Latino 40% Two or more races 15% Asian 4% Black 3% Native American 1%
- Hispanic origin (detail)
- Mexican 31%
- Common ancestry
- Italian 3% Slovak 1% Lithuanian 1%
- Foreign-born
- 10% · Canada, Philippines
- Languages at home
- 77% English-only · Spanish 21% Other Asian/Pacific 2%
Political lean MEDSL · Potter
- 2024 margin
- Solid R (+44.4) · D 27.3% · R 71.7% · Other 1.1%
- 2008→2024 swing
- -5.0pp toward R · 2008: -39.4pp · 2024: -44.4pp
- All cycles
- 2024: R+44.4 2020: R+38.7 2016: R+41.9 2012: R+44.6 2008: R+39.4
Not yet ingested
- Civics
- —
Market trends
- HPI YoY
- ▼ -86.43%
- Current HPI
- 175.582
- Rent YoY
- —
- Metro
- Amarillo, TX
- State GDP YoY
- ▲ 3.95%
- F500 in state
- 110
Industry mix (Fortune 500 HQ in TX)
| Industry | F500 HQs | Revenue |
|---|---|---|
| Energy | 16 | $1,198B |
|
||
| Technology | 5 | $198B |
|
||
| Engineering / Construction | 4 | $72B |
|
||
| Energy Services | 3 | $60B |
|
||
| Utilities | 3 | $41B |
|
||
| Healthcare | 2 | $330B |
|
||
Price history
2 events — show timeline
- 2026-02-26 Listed $105,000 AARMLS
- 1999-09-23 Sold (MLS) — AARMLS
Property tax history
+4.2%/yrLatest (2025): $2,087 · +2.7% YoY. Source: county tax records.
Cash-flow waterfall
monthlySold comps — $/sqft
last 12 mo · ≤1 miLoading sold comps…