 🏷️ Likely Rental
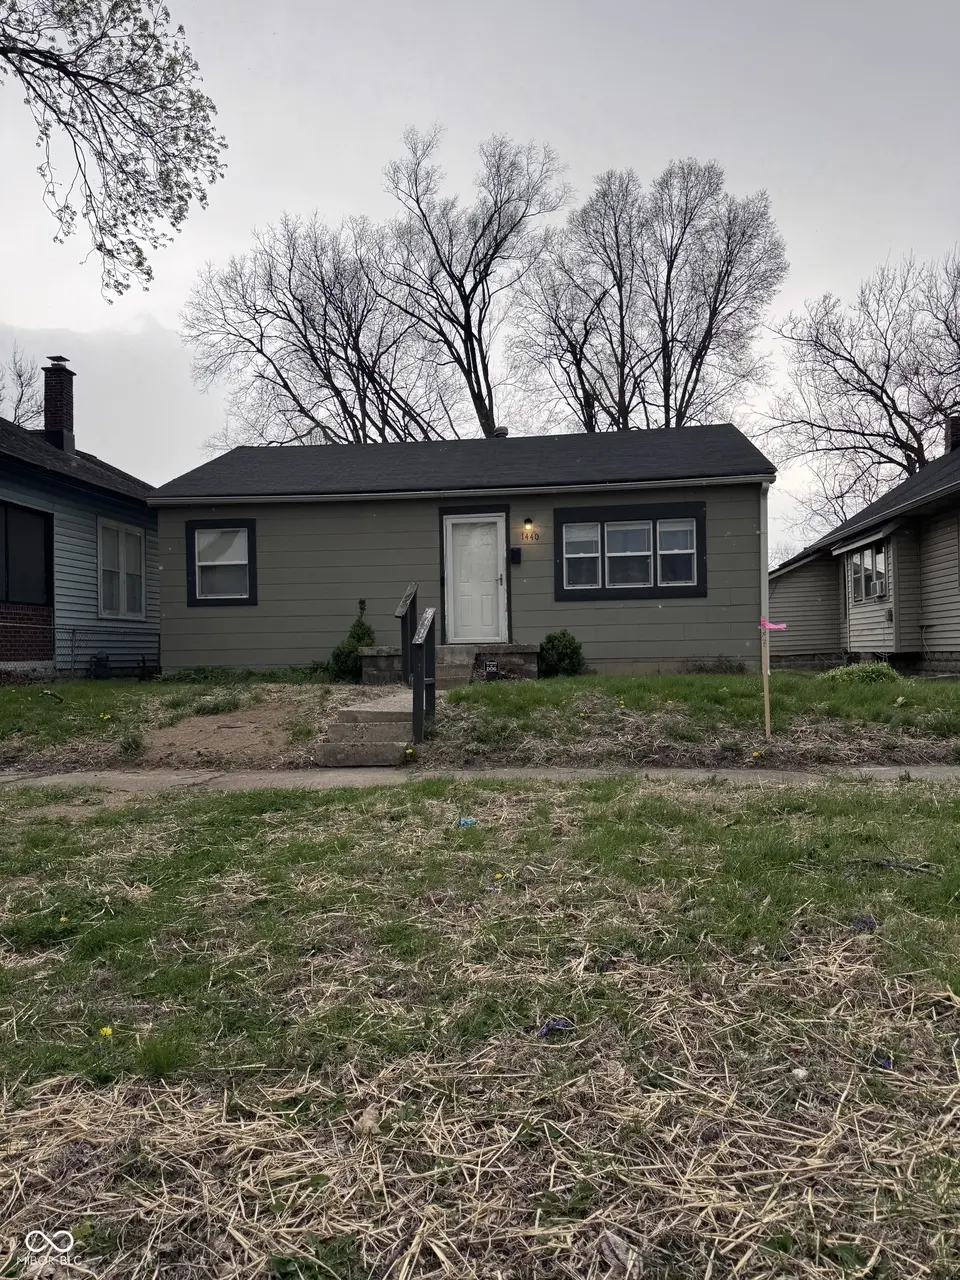
1440 Herschell Ave · Indianapolis city (balance), IN
Flood risk 1/10 · Minimal
- FEMA flood zone
- X (unshaded)
- Chance of flooding over 30 yrs
- 0.0%
- Est. flood insurance / yr
- $507 – $1,088
Fire risk 1/10 · Minimal
- Est. fire insurance / yr
- $717 – $1,331
Heat risk 4/10 · Minor
- Hot days now (above 102°F)
- 7 days/yr
- Hot days in 30 yrs
- 19 days/yr
Wind risk 2/10 · Minimal
- Chance of severe wind over 30 yrs
- 1.0%
Air-quality risk 4/10 · Minor
- Unhealthy air days now
- 5 days/yr
- Unhealthy air days in 30 yrs
- 7 days/yr
Risk factors via First Street. Map © Google.
Why this score? — see what drove the C+ grade
The composite is a weighted blend of 9 inputs, each scored 0–100. Each bar is that input's sub-score; the figure is the points it added to the 100-point composite (weight × sub-score).
- Cash flow +23.8/30.0
- ARV discount +15.0/15.0
- DSCR +7.7/10.0
- 1% rule +5.9/10.0
- Livability +2.5/5.0
- Condition / age +2.5/5.0
- Rent growth +2.4/5.0
- Schools +1.4/10.0
- Appreciation +0.0/10.0
$112,000
🖨 Deal sheet 📄 Offer letter ✓ Due diligence
Listing remarks MLS
RENTED FOR $1,425/MONTH, this West Indianapolis single-family is generating income on day one with a lease in place through September 2026. Walking distance to Riverside Park, this is a low entry point at $115,000 with a reliable tenant already in place - an easy add to any rental portfolio.
Key facts
- Investment property
- 5,619 sq ft lot
- Built 1940
Tags
Neighborhood map
What this means for you Summary
Snapshot
- This is a 2-bed/1.0-bath single-family listed at $112k.
Deal economics
- At list price, monthly cash flow is $215 ($3k/yr) — positive.
- The deal already cash-flows at list — no discount required.
- Meets the 1% rule at list price ($1k rent vs $112k).
- Recommended offer: $109k (3.0% below list) — sets the bar for market timing.
- Cap rate 8.6% vs local median 4.4% in Indianapolis city (balance) — top-decile yield for the area; either an underpriced asset or a hidden risk that comps aren't pricing in. Stress-test before assuming the spread holds.
Location & tenants
- Location reads: area grade C — affects rentability + tenant quality, not the cash-flow math above.
- Indianapolis Public Schools (urban): math 14% / reading 20% proficiency, ranked #286 of 301 in IN (top 95%) — low school quality limits family demand, transient renter base, plan for 1-2y turnover; 77% free/reduced lunch — lower-income household profile, screen leases tightly.
- Market conditions: Rents soft (-0.4%/yr); 262 active listings in the ZIP; 40 comparable units currently listed for rent nearby; rentals at typical pace (median 24d on market — plan ~3-4 weeks tenant-placement turnaround); 1,906 units permitted in Marion County in 2024 (621 in 5+ unit buildings).
Forward outlook
- Local home prices are declining (-3.0%/yr); year-one equity from $774 of loan paydown is wiped out by about $3k of value loss. Plan a longer hold.
- Marion County population projected at +18% by 2050 — long-run rental-demand tailwind backs the buy-and-hold thesis.
Negotiation context
- It's been on market 44 days — a 3% lower offer ($109k) is reasonable based on typical stale-listing flexibility.
- 3 sale attempts since 5y ago with the ask held roughly flat each time — persistent listings suggest the price (not the market) is what's stuck; bring a comps-based counter.
- Current owner paid $45k; list at $112k implies a 149% gain — meaningful room to come down on a strong offer.
Risks & watch-outs
- Watch-outs: built in 1940 — expect roof / HVAC / electrical / plumbing capex.
Questions for the listing agent
- It's been on market 44 days. Have you received any prior offers? Is the seller open to a 3% concession, seller financing, or rate buy-down credit?
- Built in 1940 — when were the roof, HVAC, electrical panel, plumbing, and water heater last replaced?
- Is there a deadline driving the sale (1031 exchange, divorce, estate, relocation)? That informs how much negotiation room exists.
- What's the average days-on-market for RENTAL listings here right now (not sales)? A rising rental-DOM trend means longer vacancies and softer asking-rent achievability than the comps imply.
- What's the recent tenant-quality profile in this submarket — average credit score on applications, eviction rate, late-payment / NSF rate, and stable-employment percentage? A property-management company in the area should have these aggregated.
- How much new for-sale + rental construction is in the pipeline within 1–3 miles? Heavy new supply typically softens prices + rents 12–24 months out; constrained supply supports both.
Investment metrics
- 1% rule
- 1.09% ✓
- Cap rate
- 8.59%
- Cash-on-cash
- 8.21%
- DSCR
- 1.37
- GRM
- 7.6
CMA / ARV
- ARV (median comp)
- $162,531
- List price
- $112,000
- Delta
- -31.09%
- Verdict
- UNDERPRICED
- Comps
- 20 within 1.0 mi
Show comp detail 3 sales within ~0.75 mi
| Address | Dist | Beds/Ba | Sqft | Sold | Price | $/sf | Match |
|---|---|---|---|---|---|---|---|
| 2023 Gent Ave | 0.35mi | 2/1.5 | 875 (+5%) | 23mo | $179,750 | $205 | 54 |
| 2126 White Ave | 0.26mi | 3/1.0 (+1) | 920 (+11%) | 18mo | $133,000 | $145 | 51 |
| 1006 Edgemont Ave | 0.68mi | 3/1.0 (+1) | 954 (+15%) | 3mo | $75,000 | $79 | 36 |
Match score weights: distance 35% · size 25% · config 20% · recency 20%. Top-matched comps best support the ARV.
Projected returns pro-forma
-3.0% appreciation · 0.0% rent growth · sell at horizon
- IRR
- -7.2%
- Equity multiple
- 0.74×
- Total profit
- $-8,051
- Equity at exit
- $16,700
- IRR
- -1.7%
- Equity multiple
- 0.90×
- Total profit
- $-3,215
- Equity at exit
- $9,684
Cash invested: $31,360 (down + closing). Projections, not guarantees.
Landlord ↔ Tenant lean methodology
- Overall (STATE)
- 90 Strongly Landlord-Friendly
- State Indiana
- 90 Strongly Landlord-Friendly · R+11
- County
- — inherits STATE
- City
- — inherits STATE
ZIP-level market 46202
- Home prices YoY
- -26.2%
- Rents YoY
- -0.4%
- Active inventory
- 262
- Price-to-rent
- 7.6×
Monthly cashflow live
- Estimated rent
- $1,220 high interval (Pro) →
- Mortgage (P&I)
- −$587
- Tax from tax record
- −$115 /mo · $1,386/yr
- Insurance
- −$47
- HOA
- −$0
- Vacancy / Maint / Mgmt
- −$256
- Net cashflow
- $215
Break-even live
UW: 25.0% down · 7.5% · 30yr · 1.5% tax · 5.0% vac · 8.0% maint · 8.0% mgmt
Financing live
Cash to close
- Down payment
- $28,000
- Closing costs
- $3,360
- Reserves months
- —
- Total cash needed
- —
Loan-product check · same deal, 3 products live
Conventional
25% down · 7.5% · 30yr
- Down + closing
- —
- Monthly P&I
- —
- Monthly cashflow
- —
- DSCR
- —
- Eligible?
- —
Personal DTI + credit; lowest rate.
DSCR
20% down · 8.5% · 30yr
- Down + closing
- —
- Monthly P&I
- —
- Monthly cashflow
- —
- DSCR
- —
- Eligible?
- —
No personal income docs; deal must DSCR.
Hard money
10% down · 12.0% · 12mo
- Down + closing
- —
- Monthly P&I
- —
- Monthly cashflow
- —
- DSCR
- —
- Eligible?
- —
Short-term bridge; refi at stabilization.
Rent comps 40 comps
| Address | Beds | Baths | Sqft | Rent | $/sqft | DOM | Units | Dist |
|---|---|---|---|---|---|---|---|---|
| 1415 W Pruitt St Indianapolis, IN | 3.0 | 1.0 | 1001 | $1,249 | $1.25 | 23d | 1 | 0.09mi |
| 2248 N Harding St Indianapolis, IN | 2.0 | 1.0 | 1100 | $899 | $0.82 | 23d | 1 | 0.15mi |
| 1367 W Pruitt St Indianapolis, IN | 3.0 | 1.0 | 1088 | $1,450 | $1.33 | 43d | 1 | 0.15mi |
| 1244 Edgemont Ave Indianapolis, IN | 2.0 | 1.0 | 1092 | $1,275 | $1.17 | 43d | 1 | 0.42mi |
| 1228 W 18th St Indianapolis, IN | 2.0 | 1.0 | 1050 | $1,200 | $1.14 | 43d | 1 | 0.46mi |
| 1214 W 25th St Indianapolis, IN | 1.0 | 1.0 | 800 | $775 | $0.97 | 23d | 1 | 0.51mi |
| 1319 W 27th St Indianapolis, IN | 2.0 | 1.0 | 651 | $900 | $1.38 | 12d | 1 | 0.60mi |
| 1519 W 28th St Indianapolis, IN | 2.0 | 1.0 | 816 | $895 | $1.10 | 43d | 1 | 0.64mi |
| 1510 Stadium Way Unit 220 Indianapolis, IN | 1.0 | 1.0 | 665 | $1,365 | $2.05 | 7d | 1 | 0.66mi |
| 970 Edgemont Ave Indianapolis, IN | 2.0 | 1.0 | 740 | $845 | $1.14 | 4d | 1 | 0.70mi |
| 1457 W 29th St Indianapolis, IN | 2.0 | 1.0 | 686 | $995 | $1.45 | 20d | 1 | 0.75mi |
| 906 Burdsal Pkwy Indianapolis, IN | 2.0 | 1.0 | 936 | $1,295 | $1.38 | 23d | 1 | 0.76mi |
| 908 Burdsal Pkwy Marion, IN | 2.0 | 1.0 | 936 | $1,300 | $1.39 | 23d | 1 | 0.76mi |
| 1410 Breedlove Ln Indianapolis, IN | 2.0 | 1.0–2.0 | 886 | $2,557 | $2.88 | 1d | 63 | 0.76mi |
| 2106 Cold Spring Rd Indianapolis, IN | 2.0 | 1.0–1.5 | 940 | $1,189 | $1.26 | 3d | 4 | 0.78mi |
| 1227 W 29th St Indianapolis, IN | 3.0 | 1.5 | 1056 | $1,250 | $1.18 | 23d | 1 | 0.82mi |
| 819 Edgemont Ave Apt 115 Indianapolis, IN | 1.0 | 1.0 | 540 | $915 | $1.69 | 43d | 1 | 0.86mi |
| 2602 Mansion Dr Indianapolis, IN | 2.0–3.0 | 2.0 | 1850 | $1,379 | $0.75 | 7d | 6 | 0.89mi |
| 1411 N Pershing Ave Indianapolis, IN | 1.0 | 1.0 | 700 | $850 | $1.21 | 43d | 1 | 0.91mi |
| 1201 Indiana Ave Indianapolis, IN | 1.0–3.0 | 1.0–3.5 | 967 | $1,770 | $1.83 | 1d | 36 | 0.96mi |
| 1150 N White River Pkwy West Dr Indianapolis, IN | 1.0–2.0 | 1.0 | 722 | $1,224 | $1.69 | 2d | 9 | 0.98mi |
| 1341 W Congress Ave Unit 1343 Indianapolis, IN | 1.0 | 1.0 | 600 | $750 | $1.25 | 43d | 1 | 1.02mi |
| 2701 W 17th St Indianapolis, IN | 2.0 | 1.0 | 810 | $899 | $1.11 | 7d | 1 | 1.04mi |
| 2235 Doctor Martin Luther King Junior St Indianapolis, IN | 3.0 | 1.5 | 948 | $1,700 | $1.79 | 43d | 1 | 1.07mi |
| 524 W 23rd St Indianapolis, IN | 2.0 | 1.0 | 664 | $949 | $1.43 | 43d | 1 | 1.09mi |
| 2774 Pixel DR Indianapolis, IN | 1.0 | 1.0 | 750 | $1,100 | $1.47 | 43d | 1 | 1.11mi |
| 1261 W 32nd St Indianapolis, IN | 2.0 | 1.0 | 832 | $975 | $1.17 | 43d | 1 | 1.12mi |
| 1460 W 32nd St Indianapolis, IN | 1.0 | 1.0 | 576 | $847 | $1.47 | 23d | 1 | 1.12mi |
| 2316 Indianapolis Ave Indianapolis, IN | 1.0 | 1.0 | 550 | $800 | $1.45 | 14d | 1 | 1.13mi |
| 1470 W 32nd St Indianapolis, IN | 2.0 | 1.0 | 700 | $1,000 | $1.43 | 43d | 1 | 1.13mi |
| 1409 N Warman Ave Indianapolis, IN | 2.0 | 1.0 | 816 | $1,300 | $1.59 | 20d | 1 | 1.17mi |
| 2011 N Kessler Boulevard Dr Indianapolis, IN | 3.0 | 1.0 | 888 | $1,375 | $1.55 | 23d | 1 | 1.18mi |
| 1441 W Lynn Dr Indianapolis, IN | 3.0 | 2.0 | 967 | $1,550 | $1.60 | 43d | 1 | 1.22mi |
| 1155 N Holmes Ave Indianapolis, IN | 3.0 | 1.0 | 952 | $2,800 | $2.94 | 3d | 1 | 1.24mi |
| 516 W 28th St Indianapolis, IN | 2.0 | 1.0 | 1005 | $1,100 | $1.09 | 23d | 1 | 1.27mi |
| 2365 N Goodlet Ave Indianapolis, IN | 3.0 | 1.5 | 900 | $1,099 | $1.22 | 23d | 1 | 1.27mi |
| 541 W 29th St Indianapolis, IN | 1.0 | 1.0 | 740 | $900 | $1.22 | 20d | 1 | 1.29mi |
| 930 W 10th St Indianapolis, IN | 1.0–4.0 | 1.0–4.0 | 874 | $2,371 | $2.71 | 4d | 1 | 1.29mi |
| 3440 N Harding St Indianapolis, IN | 2.0 | 1.0 | 754 | $1,325 | $1.76 | 43d | 1 | 1.30mi |
| 3440 N Harding St Indianapolis, IN | 2.0 | 1.0 | 754 | $1,275 | $1.69 | 20d | 1 | 1.30mi |
Listing history 17 events
-
2026-06-18days on market $112,000 Active 44 DOM
-
2026-06-17days on market $112,000 Active 43 DOM
-
2026-06-16days on market $112,000 Active 42 DOM
-
2026-06-15days on market $112,000 Active 41 DOM
-
2026-06-13days on market $112,000 Active 39 DOM
-
2026-06-13days on market $112,000 Active 38 DOM
-
2026-06-09days on market $112,000 Active 35 DOM
-
2026-06-08days on market $112,000 Active 34 DOM
-
2026-06-07statusdays on market $112,000 Active 33 DOM
-
2026-05-11status Pending 292-char remark
Show marketing remark (292 chars)
RENTED FOR $1,425/MONTH, this West Indianapolis single-family is generating income on day one with a lease in place through September 2026. Walking distance to Riverside Park, this is a low entry point at $115,000 with a reliable tenant already in place - an easy add to any rental portfolio.
-
2026-04-24status Active 292-char remark
Show marketing remark (292 chars)
RENTED FOR $1,425/MONTH, this West Indianapolis single-family is generating income on day one with a lease in place through September 2026. Walking distance to Riverside Park, this is a low entry point at $115,000 with a reliable tenant already in place - an easy add to any rental portfolio.
-
2026-04-24price $112,000 292-char remark
Show marketing remark (292 chars)
RENTED FOR $1,425/MONTH, this West Indianapolis single-family is generating income on day one with a lease in place through September 2026. Walking distance to Riverside Park, this is a low entry point at $115,000 with a reliable tenant already in place - an easy add to any rental portfolio.
-
2026-04-14status Pending 292-char remark
Show marketing remark (292 chars)
RENTED FOR $1,425/MONTH, this West Indianapolis single-family is generating income on day one with a lease in place through September 2026. Walking distance to Riverside Park, this is a low entry point at $115,000 with a reliable tenant already in place - an easy add to any rental portfolio.
-
2026-04-01$115,000 Active 292-char remark
Show marketing remark (292 chars)
RENTED FOR $1,425/MONTH, this West Indianapolis single-family is generating income on day one with a lease in place through September 2026. Walking distance to Riverside Park, this is a low entry point at $115,000 with a reliable tenant already in place - an easy add to any rental portfolio.
-
2021-04-22soldstatus $45,000 Closed 371-char remark
Show marketing remark (371 chars)
Great opportunity for first time home owner or investor! 2 Bedroom one Bath, eat-in Kitchen in Riverside Community close to bus line, Riverside Park, Colts athletic area, community center, walking trails, Global Preparatory Academy and Riverside schools. Home comes with stove, refrigerator, washer and dryer. Home also comes with home warranty for buyer's peace of mind.
-
2021-04-02status Pending 371-char remark
Show marketing remark (371 chars)
Great opportunity for first time home owner or investor! 2 Bedroom one Bath, eat-in Kitchen in Riverside Community close to bus line, Riverside Park, Colts athletic area, community center, walking trails, Global Preparatory Academy and Riverside schools. Home comes with stove, refrigerator, washer and dryer. Home also comes with home warranty for buyer's peace of mind.
-
2021-03-29$49,900 Active 371-char remark
Show marketing remark (371 chars)
Great opportunity for first time home owner or investor! 2 Bedroom one Bath, eat-in Kitchen in Riverside Community close to bus line, Riverside Park, Colts athletic area, community center, walking trails, Global Preparatory Academy and Riverside schools. Home comes with stove, refrigerator, washer and dryer. Home also comes with home warranty for buyer's peace of mind.
ⓘ Source: listings_history table (triggers on properties + properties_extension) + one-shot
backfill from property_details.listing_events for pre-trigger history.
Tax reassessment forecast IN · Partial reset (capped growth)
- Current annual tax
- $1,386 · $115/mo
- Projected year-2 tax
- $1,386 · $115/mo
- Expected delta
- $0/yr ($0/mo · 0.0%)
ⓘ Screening estimate from a state-policy table — verify with the county assessor before closing.
Climate risk First Street
- Flood 1/10 Low FEMA zone X (unshaded) · 0% chance over 30 yrs
- Wildfire 1/10 Low
- Heat 4/10 Moderate 7 d/yr ≥102°F today · 19 d/yr by 30 yrs out
- Wind 2/10 Low 100% chance of damaging wind over 30 yrs
- Air quality 4/10 Moderate 5 unhealthy d/yr today · 7 by 30 yrs out
Nearby sold comps map
Loading sold comps map…
Walkable amenities ~0.75 mi
Loading nearby amenities…
Taxation est. · year 1
- Rental income
- $14,645
- − Mortgage interest
- −$6,274
- − Property taxes
- −$1,386
- − Insurance
- −$560
- − Repairs & maintenance
- −$1,172
- − Management
- −$1,172
- − Depreciation
- −$3,258
- Taxable income
- $824
- Est. tax owed @ 24.0%
- −$198
- After-tax cash flow
- $2,378/yr
For passive investors: Depreciation is non-cash, so a rental often shows a tax loss while cash-flowing — sheltering income. Rental losses are passive: they offset passive income freely, and up to $25,000/yr can offset ordinary (W-2) income if you actively participate and your MAGI is under $100k (phasing out to $0 by $150k); unused losses carry forward. On sale, claimed depreciation is recaptured at up to 25%, and gains may owe capital-gains tax (a 1031 exchange can defer both). Figures are a year-1 estimate at your 24.0% rate — not tax advice; consult a CPA.
Schools (NCES district)
- District
- Indianapolis Public Schools
- NCES district ID
- 1804770
- Math proficiency
- 14% ▼ -7.00%
- Reading proficiency
- 20% ▼ -3.00%
- Median HH income
- $32,034
- Composite
- 13.69/100
- National rank
- #9499
- State rank
- #286 of 301 in IN
Livability — Indianapolis city (balance)
No livability data for this city. (Only ~50 U.S. cities are tracked.)
Census & demographics
- Census place
- Indianapolis city (balance), IN
- County
- Marion County · 998,460 people
- City population
- 881,119
- Metro
- Indianapolis-Carmel-Anderson, IN
- Population (ZIP)
- 20,180
- Household income
- $63,506
- Rent vs Own
- Severe rent burden
- 1829.0
Population outlook (Marion County) Hauer SSP2
- Today (2025)
- 1,025,572 people
- By 2030
- 1,065,727 · +3.9%
- By 2040
- 1,141,577 · +11.3%
- By 2050
- 1,208,920 · +17.9%
- By 2075
- 1,367,288 · +33.3%
- By 2100
- 1,438,201 · +40.2%
Race, ethnicity, and origin ACS 2023
- Neighborhood character
- Diverse neighborhood (Simpson 0.57)
- Race & ethnicity
- White 62% Black 20% Hispanic / Latino 8% Asian 6% Two or more races 5%
- Hispanic origin (detail)
- Mexican 5%
- Common ancestry
- Italian 4% Romanian 3% Slovak 3%
- Foreign-born
- 11% · Canada, China
- Languages at home
- 86% English-only · Spanish 6% Other Indo-European 3% Arabic 1%
Political lean MEDSL · Marion
- 2024 margin
- Strong D (+27.7) · D 63.0% · R 35.3% · Other 1.7%
- 2008→2024 swing
- -0.7pp no change · 2008: 28.4pp · 2024: 27.7pp
- All cycles
- 2024: D+27.7 2020: D+29.1 2016: D+22.8 2012: D+22.2 2008: D+28.4
Not yet ingested
- Civics
- —
Market trends
- HPI YoY
- ▼ -136.75%
- Current HPI
- 385.5518
- Rent YoY
- ▼ -0.37%
- Metro
- Indianapolis-Carmel-Anderson, IN
- State GDP YoY
- ▲ 2.90%
- F500 in state
- 18
Industry mix (Fortune 500 HQ in IN)
| Industry | F500 HQs | Revenue |
|---|---|---|
| Industrial Machinery | 2 | $37B |
|
||
| Healthcare | 1 | $177B |
|
||
| Pharmaceuticals | 1 | $45B |
|
||
| Metals / Steel | 1 | $18B |
|
||
| Agriculture | 1 | $17B |
|
||
| Packaging | 1 | $12B |
|
||
Price history
+124.4% since first listed8 events — show timeline
- 2026-05-11 Pending — MIBOR as Distributed by MLS Grid
- 2026-04-24 Relisted — MIBOR as Distributed by MLS Grid
- 2026-04-24 Price Changed $112,000 MIBOR as Distributed by MLS Grid
- 2026-04-14 Pending — MIBOR as Distributed by MLS Grid
- 2026-04-01 Listed $115,000 MIBOR as Distributed by MLS Grid
- 2021-04-22 Sold (MLS) $45,000 MIBOR as Distributed by MLS Grid
- 2021-04-02 Pending — MIBOR as Distributed by MLS Grid
- 2021-03-29 Listed $49,900 MIBOR as Distributed by MLS Grid
Property tax history
+41.7%/yrLatest (2025): $1,386 · +9.4% YoY. Source: county tax records.
Cash-flow waterfall
monthlySold comps — $/sqft
last 12 mo · ≤1 miLoading sold comps…