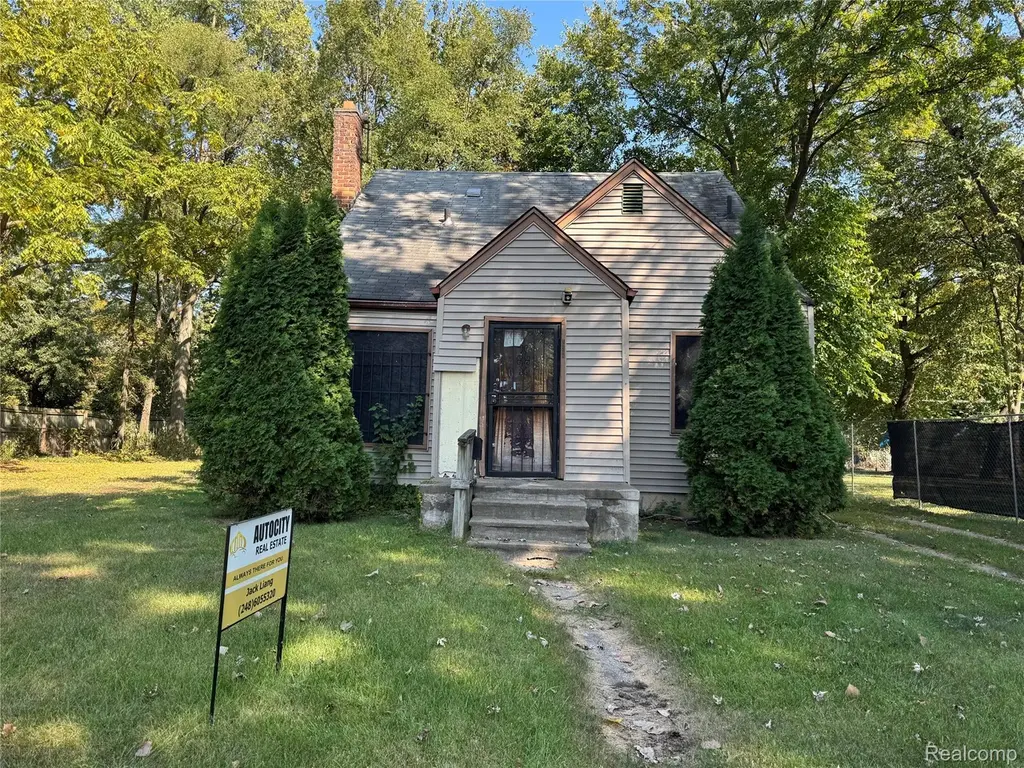
19766 Stahelin Stahelin Ave · Detroit, MI
Flood risk 1/10 · Minimal
- FEMA flood zone
- X (unshaded)
- Chance of flooding over 30 yrs
- 0.0%
- Est. flood insurance / yr
- $473 – $860
Fire risk 1/10 · Minimal
- Est. fire insurance / yr
- $784 – $1,456
Heat risk 2/10 · Minimal
- Hot days now (above 98°F)
- 7 days/yr
- Hot days in 30 yrs
- 15 days/yr
Wind risk 2/10 · Minimal
- Chance of severe wind over 30 yrs
- —
Air-quality risk 3/10 · Minor
- Unhealthy air days now
- 2 days/yr
- Unhealthy air days in 30 yrs
- 5 days/yr
Risk factors via First Street. Map © Google.
Why this score? — see what drove the D grade
The composite is a weighted blend of 9 inputs, each scored 0–100. Each bar is that input's sub-score; the figure is the points it added to the 100-point composite (weight × sub-score).
- Cash flow +15.0/30.0
- ARV discount +7.5/15.0
- 1% rule +5.0/10.0
- DSCR +5.0/10.0
- Rent growth +4.5/5.0
- Livability +3.7/5.0
- Condition / age +2.5/5.0
- Schools +1.3/10.0
- Appreciation +0.0/10.0
$25,000
🖨 Deal sheet (PDF) 📄 Offer letter ✓ Due diligence
Listing remarks MLS
Charming 2-bedroom, 1-bath home in a quiet Detroit neighborhood. This property offers great potential for investors or buyers looking for a project. Features include a partially finished basement and a spacious lot. Please note the home is being sold “As Is†and has a history of fire damage. Bring your vision and make this property your own. Convenient location close to local amenities.
Key facts
- Spacious lot
- Convenient location
- 5,227 sq ft lot
Tags
Neighborhood map
What this means for you Summary
Snapshot
- This is a 2-bed/1.0-bath single-family listed at $25k.
Deal economics
- At list price, monthly cash flow is $795 ($10k/yr) — positive.
- The deal already cash-flows at list — no discount required.
- Meets the 1% rule at list price ($1k rent vs $25k).
- Recommended offer: $22k (12.0% below list) — sets the bar for market timing.
- Cap rate 44.4% vs local median 10.0% in Detroit — top-decile yield for the area; either an underpriced asset or a hidden risk that comps aren't pricing in. Stress-test before assuming the spread holds.
Location & tenants
- Location reads 73/100 on livability (#218 in MI) — a middle-class / working-renter tenant base. Strengths: amenities A+, commute A+, cost of living A+; Watch: schools F, crime F, employment F.
- Detroit Public Schools Community District (urban): math 10% / reading 24% proficiency, ranked #499 of 540 in MI (top 92%) — low school quality limits family demand, transient renter base, plan for 1-2y turnover; 90% free/reduced lunch — lower-income household profile, screen leases tightly.
- Market conditions: Rents rising fast (+8.0%/yr); 309 active listings in the ZIP; 40 comparable units currently listed for rent nearby; rentals at typical pace (median 18d on market — plan ~3-4 weeks tenant-placement turnaround); lower-income renter base — watch delinquency; 2,639 units permitted in Wayne County in 2024 (1,216 in 5+ unit buildings).
- This rent runs 36% of the median local income ($44k/yr) — at the standard rent-burdened threshold; future hikes will face affordability resistance.
Forward outlook
- Local home prices are declining (-3.0%/yr); year-one equity from $173 of loan paydown is wiped out by about $750 of value loss. Plan a longer hold.
- Wayne County population projected at -17% by 2050 — secular population decline; favor cash flow + early exit over multi-decade hold.
- At projected returns (-3.0% appreciation + 8.0% rent growth), your $7k cash investment doubles in ~1 year — after that, you're playing with house money.
Negotiation context
- It's been on market 265 days — a 12% lower offer ($22k) is reasonable based on typical stale-listing flexibility.
- 2 sale attempts; this cycle's ask has dropped $2k (9%) from the opening price — seller is motivated, your offer sets the floor, not the list.
Risks & watch-outs
- Watch-outs: property tax is 4.2% of price; built in 1947 — expect roof / HVAC / electrical / plumbing capex.
Questions for the listing agent
- It's been on market 265 days. Have you received any prior offers? Is the seller open to a 12% concession, seller financing, or rate buy-down credit?
- Built in 1947 — when were the roof, HVAC, electrical panel, plumbing, and water heater last replaced?
- Property tax is high relative to price — has the assessment been appealed recently, and will the sale trigger a re-assessment?
- Why hasn't it sold? Are there any deal-killer items the seller is aware of (foundation, flood, title, zoning, code violations)?
- Is there a deadline driving the sale (1031 exchange, divorce, estate, relocation)? That informs how much negotiation room exists.
- Schools are F-rated, which usually means shorter tenancies and higher turnover. Who's the typical renter profile here, and what's been the actual vacancy rate?
- Crime grade is F in this area — have there been break-ins, vandalism, or insurance claims at this property in the last 3 years? What carrier currently insures it and at what premium?
- The area grade is low — what's the realistic commute time and amenity access for the typical tenant pool here? Any planned neighborhood developments (good or bad) we should know about?
- What's the average days-on-market for RENTAL listings here right now (not sales)? A rising rental-DOM trend means longer vacancies and softer asking-rent achievability than the comps imply.
- What's the recent tenant-quality profile in this submarket — average credit score on applications, eviction rate, late-payment / NSF rate, and stable-employment percentage? A property-management company in the area should have these aggregated.
- How much new for-sale + rental construction is in the pipeline within 1–3 miles? Heavy new supply typically softens prices + rents 12–24 months out; constrained supply supports both.
Investment metrics
- 1% rule
- 5.19% ✓
- Cap rate
- 44.45%
- Cash-on-cash
- 136.27%
- DSCR
- 7.06
- GRM
- 1.6
CMA / ARV
- ARV (median comp)
- $87,711
- List price
- $25,000
- Delta
- -71.50%
- Verdict
- UNDERPRICED
- Comps
- 20 within 1.0 mi
Show comp detail 12 sales within ~0.75 mi
| Address | Dist | Beds/Ba | Sqft | Sold | Price | $/sf | Match |
|---|---|---|---|---|---|---|---|
| 19749 Huntington Rd | 0.32mi | 3/1.5 (+1) | 1,093 (-0%) | 0mo | $169,999 | $156 | 78 |
| 19455 Avon Ave | 0.14mi | 3/1.0 (+1) | 1,023 (-6%) | 2mo | $72,000 | $70 | 76 |
| 19338 Fenmore St | 0.55mi | 3/1.0 (+1) | 1,120 (+2%) | 1mo | $116,000 | $104 | 65 |
| 18926 Ashton Ave | 0.68mi | 3/1.0 (+1) | 1,095 (+0%) | 3mo | $125,000 | $114 | 61 |
| 20534 Grandville Ave | 0.53mi | 3/1.5 (+1) | 1,155 (+6%) | 3mo | $213,500 | $185 | 57 |
| 19352 Margareta St | 0.68mi | 3/1.0 (+1) | 1,060 (-3%) | 3mo | $105,000 | $99 | 56 |
| 18801 Margareta St | 0.68mi | 3/1.0 (+1) | 1,045 (-4%) | 3mo | $60,000 | $57 | 53 |
| 20004 Southfield Fwy | 0.48mi | 2/1.0 | 929 (-15%) | 1mo | $20,000 | $22 | 51 |
| 19950 Oakfield St | 0.64mi | 3/1.0 (+1) | 1,001 (-8%) | 5mo | $40,000 | $40 | 47 |
| 18631 Margareta St | 0.68mi | 3/1.0 (+1) | 950 (-13%) | 0mo | $62,000 | $65 | 41 |
| 19009 Ashton Ave | 0.60mi | 3/3.0 (+1) | 1,225 (+12%) | 2mo | $170,000 | $139 | 37 |
| 18555 Edinborough Rd | 0.74mi | 3/1.0 (+1) | 950 (-13%) | 2mo | $70,000 | $74 | 36 |
Match score weights: distance 35% · size 25% · config 20% · recency 20%. Top-matched comps best support the ARV.
Projected returns pro-forma
-3.0% appreciation · 8.0% rent growth · sell at horizon
- IRR
- —
- Equity multiple
- 8.64×
- Total profit
- $53,485
- Equity at exit
- $3,728
- IRR
- —
- Equity multiple
- 21.45×
- Total profit
- $143,179
- Equity at exit
- $2,162
Cash invested: $7,000 (down + closing). Projections, not guarantees.
Landlord ↔ Tenant lean methodology
- Overall (STATE)
- 62 Landlord-Friendly
- State Michigan
- 62 Landlord-Friendly · EVEN
- County
- — inherits STATE
- City
- — inherits STATE
ZIP-level market 48219
- Home prices YoY
- -10.3%
- Rents YoY
- 8.0%
- Active inventory
- 309
- Price-to-rent
- 1.6×
Monthly cashflow live
- Estimated rent
- $1,297 high interval (Pro) →
- Mortgage (P&I)
- −$131
- Tax from tax record
- −$88 /mo · $1,056/yr
- Insurance
- −$10
- HOA
- −$0
- Vacancy / Maint / Mgmt
- −$272
- Net cashflow
- $795
Break-even live
Sensitivity live
| Price | -10% $809 | -5% $802 | +0% $795 | +5% $788 | +10% $781 |
|---|---|---|---|---|---|
| Rent | -10% $692 | -5% $744 | +0% $795 | +5% $846 | +10% $897 |
| Rate | -1.0pp $808 | -0.5pp $801 | base $795 | +0.5pp $788 | +1.0pp $782 |
UW: 25.0% down · 7.5% · 30yr · 1.5% tax · 5.0% vac · 8.0% maint · 8.0% mgmt
Financing live
Cash to close
- Down payment
- $6,250
- Closing costs
- $750
- Reserves months
- —
- Total cash needed
- —
Loan-product check · same deal, 3 products live
Conventional
25% down · 7.5% · 30yr
- Down + closing
- —
- Monthly P&I
- —
- Monthly cashflow
- —
- DSCR
- —
- Eligible?
- —
Personal DTI + credit; lowest rate.
DSCR
20% down · 8.5% · 30yr
- Down + closing
- —
- Monthly P&I
- —
- Monthly cashflow
- —
- DSCR
- —
- Eligible?
- —
No personal income docs; deal must DSCR.
Hard money
10% down · 12.0% · 12mo
- Down + closing
- —
- Monthly P&I
- —
- Monthly cashflow
- —
- DSCR
- —
- Eligible?
- —
Short-term bridge; refi at stabilization.
Rent comps 40 comps
| Address | Beds | Baths | Sqft | Rent | $/sqft | DOM | Units | Dist |
|---|---|---|---|---|---|---|---|---|
| 19445 Avon Ave Detroit, MI | 3.0 | 1.0 | 1023 | $1,550 | $1.52 | 45d | 1 | 0.13mi |
| 20011 Avon Ave Detroit, MI | 3.0 | 1.0 | 1000 | $1,200 | $1.20 | 6d | 1 | 0.21mi |
| 19329 Stahelin Ave Unit 1 Detroit, MI | 3.0 | 1.5 | 833 | $1,250 | $1.50 | 45d | 1 | 0.25mi |
| 19372 Grandville Ave Detroit, MI | 2.0 | 1.5 | 733 | $1,025 | $1.40 | 0d | 1 | 0.29mi |
| 20068 Faust Ave Detroit, MI | 2.0 | 1.0 | 750 | $1,100 | $1.47 | 26d | 1 | 0.32mi |
| 19176 Grandville Ave Detroit, MI | 3.0 | 1.0 | 941 | $1,300 | $1.38 | 6d | 1 | 0.40mi |
| 19970 Ashton Ave Detroit, MI | 3.0 | 1.0 | 1000 | $1,000 | $1.00 | 45d | 1 | 0.41mi |
| 19918 Southfield Fwy Detroit, MI | 3.0 | 1.0 | 915 | $1,375 | $1.50 | 16d | 1 | 0.47mi |
| 20271 Grandville Ave Detroit, MI | 3.0 | 1.0 | 1010 | $1,550 | $1.53 | 25d | 1 | 0.47mi |
| 20200 Ashton Ave Detroit, MI | 3.0 | 1.0 | 1200 | $1,200 | $1.00 | 18d | 1 | 0.50mi |
| 19818 Fenmore St Detroit, MI | 3.0 | 1.0 | 902 | $1,275 | $1.41 | 45d | 1 | 0.50mi |
| 20043 Fenmore St Detroit, MI | 3.0 | 1.0 | 1030 | $1,423 | $1.38 | 0d | 1 | 0.54mi |
| 20527 Rosemont Ave Detroit, MI | 2.0 | 2.0 | 975 | $1,528 | $1.57 | 45d | 1 | 0.55mi |
| 19367 Plainview Ave Detroit, MI | 3.0 | 2.0 | 1208 | $1,400 | $1.16 | 0d | 1 | 0.56mi |
| 18699 Shaftsbury Ave Detroit, MI | 2.0 | 1.0 | 800 | $1,000 | $1.25 | 45d | 1 | 0.57mi |
| 19457 Evergreen Rd Detroit, MI | 2.0 | 1.0 | 1100 | $1,200 | $1.09 | 45d | 1 | 0.59mi |
| 18659 Shaftsbury Ave Detroit, MI | 3.0 | 1.0 | 763 | $1,323 | $1.73 | 0d | 1 | 0.60mi |
| 20539 Southfield Rd Detroit, MI | 1.0 | 1.0 | 700 | $800 | $1.14 | 11d | 4 | 0.64mi |
| 20510 Fenmore St Detroit, MI | 3.0 | 1.0 | 1194 | $1,300 | $1.09 | 3d | 1 | 0.69mi |
| 20259 Oakfield St Detroit, MI | 3.0 | 1.0 | 1056 | $1,250 | $1.18 | 18d | 1 | 0.72mi |
| 18452 Shaftsbury Ave Detroit, MI | 3.0 | 1.0 | 927 | $1,500 | $1.62 | 18d | 1 | 0.73mi |
| 19307 Lindsay St Detroit, MI | 2.0 | 1.0 | 900 | $1,100 | $1.22 | 0d | 1 | 0.75mi |
| 18494 Ashton Ave Detroit, MI | 3.0 | 1.0 | 1000 | $1,600 | $1.60 | 18d | 1 | 0.78mi |
| 18450 Edinborough Rd Detroit, MI | 3.0 | 1.0 | 1000 | $1,500 | $1.50 | 45d | 1 | 0.80mi |
| 20203 Gilchrist St Detroit, MI | 3.0 | 1.0 | 1031 | $1,250 | $1.21 | 6d | 1 | 0.80mi |
| 19781 Fielding St Detroit, MI | 3.0 | 1.0 | 1000 | $1,294 | $1.29 | 6d | 1 | 0.85mi |
| 20314 Gilchrist St Detroit, MI | 3.0 | 1.0 | 1042 | $1,500 | $1.44 | 6d | 1 | 0.87mi |
| 20210 Biltmore St Detroit, MI | 3.0 | 1.0 | 1033 | $1,350 | $1.31 | 26d | 1 | 0.89mi |
| 20079 Patton St Detroit, MI | 3.0 | 1.0 | 1150 | $1,550 | $1.35 | 6d | 1 | 0.93mi |
| 18556 Kentfield St Detroit, MI | 3.0 | 1.0 | 952 | $1,250 | $1.31 | 4d | 1 | 0.95mi |
| 18461 Heyden St Detroit, MI | 2.0 | 1.0 | 1000 | $1,050 | $1.05 | 6d | 1 | 0.99mi |
| 17654 Sunderland Rd Detroit, MI | 3.0 | 1.0 | 1100 | $1,500 | $1.36 | 45d | 1 | 1.01mi |
| 18276 Oakfield St Detroit, MI | 2.0 | 1.0 | 726 | $1,175 | $1.62 | 45d | 1 | 1.07mi |
| 19503 Mansfield St Detroit, MI | 3.0 | 1.0 | 1200 | $1,350 | $1.12 | 18d | 1 | 1.09mi |
| 18191 Heyden St Detroit, MI | 2.0 | 1.0 | 917 | $1,100 | $1.20 | 26d | 1 | 1.11mi |
| 18134 Vaughan St Detroit, MI | 3.0 | 1.0 | 1060 | $1,150 | $1.08 | 18d | 1 | 1.11mi |
| 19467 Rutherford St Detroit, MI | 3.0 | 1.0 | 1002 | $1,200 | $1.20 | 18d | 1 | 1.14mi |
| 18274 Fielding St Detroit, MI | 2.0 | 1.0 | 700 | $1,200 | $1.71 | 18d | 1 | 1.16mi |
| 20284 Melrose St Southfield, MI | 3.0 | 1.0 | 1200 | $1,550 | $1.29 | 45d | 1 | 1.16mi |
| 19440 Rutherford St Detroit, MI | 3.0 | 1.0 | 1000 | $1,400 | $1.40 | 26d | 1 | 1.17mi |
Listing history 17 events
-
2026-06-21days on market $25,000 Active 265 DOM
-
2026-06-18days on market $25,000 Active 262 DOM
-
2026-06-17days on market $25,000 Active 261 DOM
-
2026-06-15days on market $25,000 Active 259 DOM
-
2026-06-13days on market $25,000 Active 257 DOM
-
2026-06-13days on market $25,000 Active 256 DOM
-
2026-06-09days on market $25,000 Active 253 DOM
-
2026-06-08days on market $25,000 Active 252 DOM
-
2026-06-07days on market $25,000 Active 251 DOM
-
2026-06-04days on market $25,000 Active 248 DOM
-
2026-06-03days on market $25,000 Active 247 DOM
-
2026-06-01days on market $25,000 Active 245 DOM
-
2026-05-31days on market $25,000 Active 244 DOM
-
2026-03-20price $25,000 421-char remark
Show marketing remark (401 chars)
Charming 2-bedroom, 1-bath home in a quiet Detroit neighborhood. This property offers great potential for investors or buyers looking for a project. Features include a partially finished basement and a spacious lot. Please note the home is being sold “As Is” and has a history of fire damage. Bring your vision and make this property your own. Convenient location close to local amenities.
-
2026-03-20price $25,000 401-char remark
Show marketing remark (401 chars)
Charming 2-bedroom, 1-bath home in a quiet Detroit neighborhood. This property offers great potential for investors or buyers looking for a project. Features include a partially finished basement and a spacious lot. Please note the home is being sold “As Is” and has a history of fire damage. Bring your vision and make this property your own. Convenient location close to local amenities.
-
2025-09-29$27,500 Active 401-char remark
Show marketing remark (421 chars)
Charming 2-bedroom, 1-bath home in a quiet Detroit neighborhood. This property offers great potential for investors or buyers looking for a project. Features include a partially finished basement and a spacious lot. Please note the home is being sold “As Is†and has a history of fire damage. Bring your vision and make this property your own. Convenient location close to local amenities.
-
2025-09-29$27,500 Active 421-char remark
Show marketing remark (421 chars)
Charming 2-bedroom, 1-bath home in a quiet Detroit neighborhood. This property offers great potential for investors or buyers looking for a project. Features include a partially finished basement and a spacious lot. Please note the home is being sold “As Is†and has a history of fire damage. Bring your vision and make this property your own. Convenient location close to local amenities.
ⓘ Source: listings_history table (triggers on properties + properties_extension) + one-shot
backfill from property_details.listing_events for pre-trigger history.
Tax reassessment forecast MI · Partial reset (capped growth)
- Current annual tax
- $1,056 · $88/mo
- Projected year-2 tax
- $1,056 · $88/mo
- Expected delta
- $0/yr ($0/mo · 0.0%)
ⓘ Screening estimate from a state-policy table — verify with the county assessor before closing.
Climate risk First Street
- Flood 1/10 Low FEMA zone X (unshaded) · 0% chance over 30 yrs
- Wildfire 1/10 Low
- Heat 2/10 Low 7 d/yr ≥98°F today · 15 d/yr by 30 yrs out
- Wind 2/10 Low
- Air quality 3/10 Moderate 2 unhealthy d/yr today · 5 by 30 yrs out
Nearby sold comps map
Loading sold comps map…
Walkable amenities ~0.75 mi
Loading nearby amenities…
Taxation est. · year 1
- Rental income
- $15,561
- − Mortgage interest
- −$1,400
- − Property taxes
- −$1,056
- − Insurance
- −$125
- − Repairs & maintenance
- −$1,245
- − Management
- −$1,245
- − Depreciation
- −$727
- Taxable income
- $9,763
- Est. tax owed @ 24.0%
- −$2,343
- After-tax cash flow
- $7,196/yr
For passive investors: Depreciation is non-cash, so a rental often shows a tax loss while cash-flowing — sheltering income. Rental losses are passive: they offset passive income freely, and up to $25,000/yr can offset ordinary (W-2) income if you actively participate and your MAGI is under $100k (phasing out to $0 by $150k); unused losses carry forward. On sale, claimed depreciation is recaptured at up to 25%, and gains may owe capital-gains tax (a 1031 exchange can defer both). Figures are a year-1 estimate at your 24.0% rate — not tax advice; consult a CPA.
Schools (NCES district)
- District
- Detroit Public Schools Community District
- NCES district ID
- 2601103
- Math proficiency
- 10% ▼ -2.00%
- Reading proficiency
- 24% ▲ 6.00%
- Median HH income
- $25,815
- Composite
- 13.06/100
- National rank
- #9564
- State rank
- #499 of 540 in MI
Livability — Detroit
- Score
- 73/100
- State rank
- #218
- US rank
- #5427
Category grades
Schools grade is shown separately in the Schools card above.
Census & demographics
- Census place
- Detroit, MI
- County
- Wayne County · 1,562,939 people
- City population
- 572,865
- Metro
- Detroit-Warren-Dearborn, MI
- Population (ZIP)
- 47,208
- Household income
- $43,655
- Rent vs Own
- Severe rent burden
- 3584.0
Population outlook (Wayne County) Hauer SSP2
- Today (2025)
- 1,675,273 people
- By 2030
- 1,620,300 · -3.3%
- By 2040
- 1,502,341 · -10.3%
- By 2050
- 1,384,039 · -17.4%
- By 2075
- 1,124,592 · -32.9%
- By 2100
- 881,193 · -47.4%
Race, ethnicity, and origin ACS 2023
- Neighborhood character
- Predominantly Black (88%)
- Race & ethnicity
- Black 88% White 5% Two or more races 4% Hispanic / Latino 1%
- Common ancestry
- Romanian 1% Lithuanian 1%
- Foreign-born
- 2% · Canada
- Languages at home
- 96% English-only · Spanish 1% French/Haitian/Cajun 1%
Political lean MEDSL · Wayne
- 2024 margin
- Strong D (+29.0) · D 62.7% · R 33.7% · Other 3.6%
- 2008→2024 swing
- -20.5pp toward R · 2008: 49.5pp · 2024: 29.0pp
- All cycles
- 2024: D+29.0 2020: D+38.1 2016: D+37.3 2012: D+46.9 2008: D+49.5
Not yet ingested
- Civics
- —
Market trends
- HPI YoY
- ▼ -65.06%
- Current HPI
- 563.3263
- Rent YoY
- ▲ 8.04%
- Metro
- Detroit-Warren-Dearborn, MI
- State GDP YoY
- ▲ 1.37%
- F500 in state
- 28
Industry mix (Fortune 500 HQ in MI)
| Industry | F500 HQs | Revenue |
|---|---|---|
| Automotive Parts | 3 | $48B |
|
||
| Automotive | 2 | $372B |
|
||
| Chemicals | 1 | $45B |
|
||
| Automotive Retail | 1 | $29B |
|
||
| Healthcare / Medical Devices | 1 | $23B |
|
||
| Automotive Technology | 1 | $20B |
|
||
Price history
-9.1% since first listed4 events — show timeline
- 2026-03-20 Price Changed $25,000 MiRealSource-MiMLS
- 2026-03-20 Price Changed $25,000 REALCOMP
- 2025-09-29 Listed $27,500 REALCOMP
- 2025-09-29 Listed $27,500 MiRealSource-MiMLS
Property tax history
-3.2%/yrLatest (2025): $1,056 · -53.8% YoY. Source: county tax records.
Cash-flow waterfall
monthlySold comps — $/sqft
last 12 mo · ≤1 miLoading sold comps…