 Multi-family
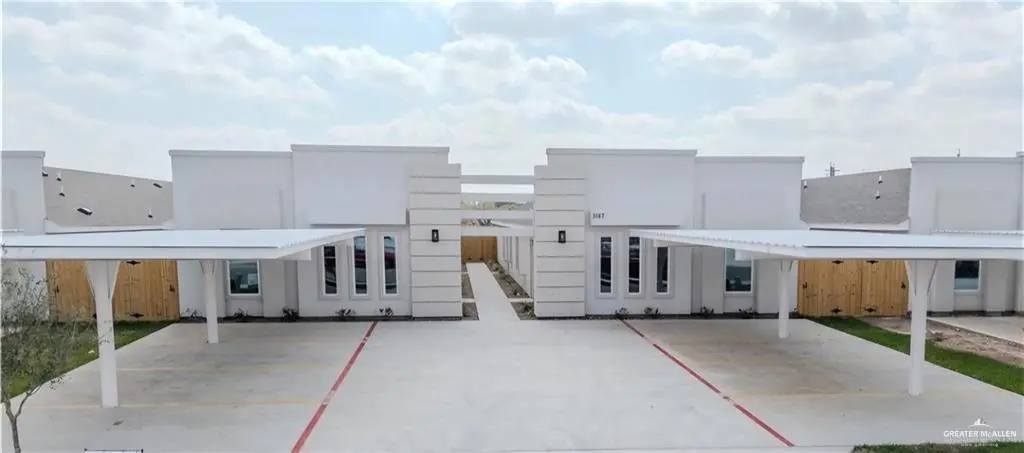
3131 Stark Rd · Midway South, TX
Flood risk No data
- FEMA flood zone
- —
- Chance of flooding over 30 yrs
- —
- Est. flood insurance / yr
- —
Fire risk No data
- Est. fire insurance / yr
- —
Heat risk No data
- Hot days now (above threshold)
- —
- Hot days in 30 yrs
- —
Wind risk No data
- Chance of severe wind over 30 yrs
- —
Air-quality risk No data
- Unhealthy air days now
- —
- Unhealthy air days in 30 yrs
- —
Risk factors via First Street. Map © Google.
Why this score? — see what drove the D+ grade
The composite is a weighted blend of 9 inputs, each scored 0–100. Each bar is that input's sub-score; the figure is the points it added to the 100-point composite (weight × sub-score).
- Cash flow +16.7/30.0
- ARV discount +7.1/15.0
- DSCR +5.2/10.0
- Appreciation +4.7/10.0
- 1% rule +4.6/10.0
- Condition / age +4.0/5.0
- Livability +2.9/5.0
- Rent growth +2.5/5.0
- Schools +2.2/10.0
$489,000
🖨 Deal sheet (PDF) 📄 Offer letter ✓ Due diligence
Multi-family units
County records classify this as Multi-Family (5+ Unit). Listing-text estimate: 1 unit. estimate disagrees with records
5+ unit building — per-unit beds/baths from public records are typically unavailable; the breakdown below (if shown) is an estimate from the listing text.
Listing remarks MLS
**Exceptional Multi-Family Investment Opportunity!** Discover this stunning, newly built multi-family property that redefines modern living! Featuring an open concept design, this exceptional property includes two spacious 3-bedroom, 2-bath units and two inviting 2-bedroom, 2-bath units, perfect for maximizing rental income or accommodating a growing family. Situated just 2 minutes from the expressway, convenience is at your doorstep, ensuring easy access to all that the area has to offer. Each unit comes fully equipped with all appliances, including a washer and dryer, making move-in a breeze for any tenant. Enjoy peace of mind with a gated entrance and ample space throughout, creating a welcoming environment for residents. This property is a prime opportunity to start or expand your investment portfolio. Don’t miss out on this exceptional offering—schedule your viewing today!
Key facts
- Gated entrance
- Open concept design
- 0.27 acre lot
Tags
Neighborhood map
What this means for you Summary
Snapshot
- This is a multifamily listed at $489k. Condition is rated good.
Deal economics
- At list price, monthly cash flow is $304 ($4k/yr) — positive.
- The deal already cash-flows at list — no discount required.
- To meet the 1% rule (rent ≥ 1% of price), the offer needs to be $472k (3.6% below list).
- Recommended offer: $430k (12.0% below list) — sets the bar for market timing.
Location & tenants
- Location reads 58/100 on livability (#1,201 in TX) — a working-class tenant base; expect higher turnover. Strengths: cost of living A+, housing A+, crime B+; Watch: schools F, amenities F, commute F.
- Weslaco ISD (suburban): math 23% / reading 31% proficiency, ranked #705 of 826 in TX (top 85%) — low school quality limits family demand, transient renter base, plan for 1-2y turnover.
- Market conditions: 710 active listings in the ZIP; 2 comparable units currently listed for rent nearby; 7,378 units permitted in Hidalgo County in 2024 (641 in 5+ unit buildings).
Forward outlook
- In year one you build about $524 of equity ($3k loan paydown + $-3k appreciation (-0.6% local appreciation)).
- Hidalgo County population projected at +28% by 2050 — long-run rental-demand tailwind backs the buy-and-hold thesis.
Negotiation context
- It's been on market 153 days — a 12% lower offer ($430k) is reasonable based on typical stale-listing flexibility.
- 2 sale attempts with the ask held roughly flat each time — persistent listings suggest the price (not the market) is what's stuck; bring a comps-based counter.
Questions for the listing agent
- It's been on market 153 days. Have you received any prior offers? Is the seller open to a 12% concession, seller financing, or rate buy-down credit?
- What does the HOA fee cover, when was the last increase, and are there any pending special assessments or reserve-fund shortfalls?
- Why hasn't it sold? Are there any deal-killer items the seller is aware of (foundation, flood, title, zoning, code violations)?
- Is there a deadline driving the sale (1031 exchange, divorce, estate, relocation)? That informs how much negotiation room exists.
- Schools are F-rated, which usually means shorter tenancies and higher turnover. Who's the typical renter profile here, and what's been the actual vacancy rate?
- The area grade is low — what's the realistic commute time and amenity access for the typical tenant pool here? Any planned neighborhood developments (good or bad) we should know about?
- What's the average days-on-market for RENTAL listings here right now (not sales)? A rising rental-DOM trend means longer vacancies and softer asking-rent achievability than the comps imply.
- What's the recent tenant-quality profile in this submarket — average credit score on applications, eviction rate, late-payment / NSF rate, and stable-employment percentage? A property-management company in the area should have these aggregated.
- How much new apartment / multifamily construction is in the pipeline within 1–3 miles? Heavy new supply (>2% of stock underway) typically softens rents 12–24 months out; light construction supports rent growth.
Investment metrics
- 1% rule
- 0.96% ✗
- Cap rate
- 7.04%
- Cash-on-cash
- 2.67%
- DSCR
- 1.12
- GRM
- 8.6
CMA / ARV
- ARV (median comp)
- $485,000
- List price
- $489,000
- Delta
- 0.82%
- Verdict
- FAIR
- Comps
- 17 within 1.0 mi
Show comp detail 12 sales within ~0.75 mi
| Address | Dist | Beds/Ba | Sqft | Sold | Price | $/sf | Match |
|---|---|---|---|---|---|---|---|
| 605 Sparrow Rd | 0.54mi | —/— | 4,080 (-4%) | 6mo | $485,000 | $119 | 64 |
| 513 Sparrow Rd | 0.56mi | —/— | 4,080 (-4%) | 5mo | $485,000 | $119 | 64 |
| 604 Dominion Dr | 0.40mi | —/— | 3,802 (-10%) | 1mo | $479,000 | $126 | 64 |
| 2900 Delta Rd | 0.43mi | —/— | 3,726 (-12%) | 1mo | $479,000 | $129 | 59 |
| 705 Sparrow Rd | 0.60mi | —/— | 4,080 (-4%) | 9mo | $495,000 | $121 | 58 |
| 2909 Charlie Rd | 0.49mi | —/— | 3,802 (-10%) | 3mo | $479,000 | $126 | 58 |
| 2701 Woodpecker Rd | 0.63mi | —/— | 4,080 (-4%) | 10mo | $535,000 | $131 | 57 |
| 2705 Woodpecker Rd | 0.65mi | —/— | 4,080 (-4%) | 10mo | $535,000 | $131 | 56 |
| 2612 Mockingbird Rd | 0.55mi | —/— | 4,502 (+6%) | 10mo | $499,000 | $111 | 55 |
| 801 Sparrow Rd | 0.60mi | —/— | 4,080 (-4%) | 14mo | $510,000 | $125 | 54 |
| 2508 Mockingbird Rd | 0.63mi | —/— | 4,426 (+5%) | 15mo | $545,000 | $123 | 50 |
| 2608 Mockingbird Rd | 0.63mi | —/— | 4,502 (+6%) | 19mo | $499,000 | $111 | 44 |
Match score weights: distance 35% · size 25% · config 20% · recency 20%. Top-matched comps best support the ARV.
Projected returns pro-forma
-0.58% appreciation · 3.0% rent growth · sell at horizon
- IRR
- -1.3%
- Equity multiple
- 0.94×
- Total profit
- $-8,099
- Equity at exit
- $127,873
- IRR
- 4.9%
- Equity multiple
- 1.50×
- Total profit
- $67,845
- Equity at exit
- $142,851
Cash invested: $136,920 (down + closing). Projections, not guarantees.
Landlord ↔ Tenant lean methodology
- Overall (STATE)
- 87 Strongly Landlord-Friendly
- State Texas
- 87 Strongly Landlord-Friendly · R+5
- County
- — inherits STATE
- City
- — inherits STATE
ZIP-level market 78596
- Home prices YoY
- -0.2%
- Active inventory
- 710
- Price-to-rent
- 34.3×
Monthly cashflow live
- Estimated rent
- $4,716 high interval (Pro) →
- Mortgage (P&I)
- −$2,564
- Tax est. 1.5%
- −$611 /mo · $7,335/yr
- Insurance
- −$204
- HOA
- −$42
- Vacancy / Maint / Mgmt
- −$990
- Net cashflow
- $304
Break-even live
Sensitivity live
| Price | -10% $642 | -5% $473 | +0% $304 | +5% $135 | +10% $-34 |
|---|---|---|---|---|---|
| Rent | -10% $-68 | -5% $118 | +0% $304 | +5% $491 | +10% $677 |
| Rate | -1.0pp $551 | -0.5pp $429 | base $304 | +0.5pp $178 | +1.0pp $49 |
4-unit breakdown (identical units grouped — click to expand)
| Units | Beds | Baths | Est. rent |
|---|---|---|---|
| 2× units | 3 | 2 | $2,376 |
| #1 | 3 | 2 | $1,188 |
| #2 | 3 | 2 | $1,188 |
| 2× units | 2 | 2 | $2,340 |
| #3 | 2 | 2 | $1,170 |
| #4 | 2 | 2 | $1,170 |
| Total (4 units) | $4,716 | ||
UW: 25.0% down · 7.5% · 30yr · 1.5% tax · 5.0% vac · 8.0% maint · 8.0% mgmt
Financing live
Cash to close
- Down payment
- $122,250
- Closing costs
- $14,670
- Reserves months
- —
- Total cash needed
- —
Loan-product check · same deal, 3 products live
Conventional
25% down · 7.5% · 30yr
- Down + closing
- —
- Monthly P&I
- —
- Monthly cashflow
- —
- DSCR
- —
- Eligible?
- —
Personal DTI + credit; lowest rate.
DSCR
20% down · 8.5% · 30yr
- Down + closing
- —
- Monthly P&I
- —
- Monthly cashflow
- —
- DSCR
- —
- Eligible?
- —
No personal income docs; deal must DSCR.
Hard money
10% down · 12.0% · 12mo
- Down + closing
- —
- Monthly P&I
- —
- Monthly cashflow
- —
- DSCR
- —
- Eligible?
- —
Short-term bridge; refi at stabilization.
Rent comps 2 comps
| Address | Beds | Baths | Sqft | Rent | $/sqft | DOM | Units | Dist |
|---|---|---|---|---|---|---|---|---|
| 1405 San Vicente Unit 3 Weslaco, TX | 3.0 | 2.0 | 4256 | $1,250 | $0.29 | 24d | 1 | 0.98mi |
| 1405 San Vicente Unit 1 Weslaco, TX | 3.0 | 2.0 | 4256 | $1,200 | $0.28 | 24d | 1 | 0.98mi |
HOA detail
- Monthly dues
- $42 · $504/yr
- Likely covers
- security
Listing history 18 events
-
2026-06-21days on market $489,000 Active 153 DOM
-
2026-06-18days on market $489,000 Active 151 DOM
-
2026-06-17days on market $489,000 Active 150 DOM
-
2026-06-16days on market $489,000 Active 149 DOM
-
2026-06-15days on market $489,000 Active 148 DOM
-
2026-06-15days on market $489,000 Active 147 DOM
-
2026-06-13days on market $489,000 Active 146 DOM
-
2026-06-12days on market $489,000 Active 145 DOM
-
2026-06-09days on market $489,000 Active 142 DOM
-
2026-06-08days on market $489,000 Active 141 DOM
-
2026-06-08days on market $489,000 Active 140 DOM
-
2026-06-07days on market $489,000 Active 139 DOM
-
2026-06-03days on market $489,000 Active 136 DOM
-
2026-06-02days on market $489,000 Active 135 DOM
-
2026-06-01days on market $489,000 Active 134 DOM
-
2026-05-31days on market $489,000 Active 133 DOM
-
2026-01-19$489,000 Active 902-char remark
Show marketing remark (902 chars)
**Exceptional Multi-Family Investment Opportunity!** Discover this stunning, newly built multi-family property that redefines modern living! Featuring an open concept design, this exceptional property includes two spacious 3-bedroom, 2-bath units and two inviting 2-bedroom, 2-bath units, perfect for maximizing rental income or accommodating a growing family. Situated just 2 minutes from the expressway, convenience is at your doorstep, ensuring easy access to all that the area has to offer. Each unit comes fully equipped with all appliances, including a washer and dryer, making move-in a breeze for any tenant. Enjoy peace of mind with a gated entrance and ample space throughout, creating a welcoming environment for residents. This property is a prime opportunity to start or expand your investment portfolio. Don’t miss out on this exceptional offering—schedule your viewing today!
-
2025-06-09$495,000 Active
ⓘ Source: listings_history table (triggers on properties + properties_extension) + one-shot
backfill from property_details.listing_events for pre-trigger history.
Nearby sold comps map
Loading sold comps map…
Walkable amenities ~0.75 mi
Loading nearby amenities…
Taxation est. · year 1
- Rental income
- $56,592
- − Mortgage interest
- −$27,392
- − Property taxes
- −$7,335
- − Insurance
- −$2,445
- − Repairs & maintenance
- −$4,527
- − Management
- −$4,527
- − HOA
- −$504
- − Depreciation
- −$14,225
- Taxable loss
- −$4,364
- Est. tax savings @ 24.0%
- +$1,047
- After-tax cash flow
- $4,699/yr
For passive investors: Depreciation is non-cash, so a rental often shows a tax loss while cash-flowing — sheltering income. Rental losses are passive: they offset passive income freely, and up to $25,000/yr can offset ordinary (W-2) income if you actively participate and your MAGI is under $100k (phasing out to $0 by $150k); unused losses carry forward. On sale, claimed depreciation is recaptured at up to 25%, and gains may owe capital-gains tax (a 1031 exchange can defer both). Figures are a year-1 estimate at your 24.0% rate — not tax advice; consult a CPA.
Condition & rehab AI · 12 photos
This multi-family property is in good condition with modern finishes and a clean, well-maintained appearance. It is ready for immediate rental or resale.
Value-add opportunities
- Both Landscaping — Enhances curb appeal and adds value
- Both Painting — Fresh paint can make the home more appealing
- Both Window treatments — Improves privacy and adds aesthetic value
Renovation cost estimate screening
Value-add ROI direction
- Both Landscaping — Enhances curb appeal and adds value ↑
- Both Painting — Fresh paint can make the home more appealing ↑
- Both Window treatments — Improves privacy and adds aesthetic value ↑
ⓘ Cost ranges are severity-bucket heuristics (US national rule-of-thumb). Get contractor quotes + a written scope before underwriting a rehab budget.
Schools (NCES district)
- District
- Weslaco ISD
- NCES district ID
- 4844960
- Math proficiency
- 23% ▼ -29.00%
- Reading proficiency
- 31% ▼ -9.00%
- Median HH income
- $32,867
- Composite
- 22.05/100
- National rank
- #8196
- State rank
- #705 of 826 in TX
Livability — Midway South
- Score
- 58/100
- State rank
- #1201
- US rank
- #21023
Category grades
Schools grade is shown separately in the Schools card above.
Census & demographics
- Census place
- Midway South, TX
- Population (ZIP)
- 38,942
Population outlook (Hidalgo County) Hauer SSP2
- Today (2025)
- 955,232 people
- By 2030
- 1,009,774 · +5.7%
- By 2040
- 1,120,332 · +17.3%
- By 2050
- 1,225,036 · +28.2%
- By 2075
- 1,439,189 · +50.7%
- By 2100
- 1,533,429 · +60.5%
Race, ethnicity, and origin ACS 2023
- Neighborhood character
- Predominantly Hispanic (86%)
- Race & ethnicity
- Hispanic / Latino 86% Two or more races 38% White 13%
- Hispanic origin (detail)
- Mexican 82%
- Common ancestry
- Slovak 1%
- Foreign-born
- 17% · Canada
- Languages at home
- 27% English-only · Spanish 72%
Political lean MEDSL · Hidalgo
- 2024 margin
- Toss-up / Even · D 48.1% · R 51.0%
- 2008→2024 swing
- -41.6pp toward R · 2008: 38.7pp · 2024: -2.9pp
- All cycles
- 2024: R+2.9 2020: D+17.1 2016: D+40.5 2012: D+41.8 2008: D+38.7
Not yet ingested
- Civics
- —
Market trends
- HPI YoY
- ▼ -0.58%
- Current HPI
- 261.5117
- Rent YoY
- —
- Metro
- —
- State GDP YoY
- ▲ 3.95%
- F500 in state
- 110
Industry mix (Fortune 500 HQ in TX)
| Industry | F500 HQs | Revenue |
|---|---|---|
| Energy | 16 | $1,198B |
|
||
| Technology | 5 | $198B |
|
||
| Engineering / Construction | 4 | $72B |
|
||
| Energy Services | 3 | $60B |
|
||
| Utilities | 3 | $41B |
|
||
| Healthcare | 2 | $330B |
|
||
Price history
-1.2% since first listed2 events — show timeline
- 2026-01-19 Listed $489,000 MCALLENMLS
- 2025-06-09 Listed $495,000 MCALLENMLS
Cash-flow waterfall
monthlySold comps — $/sqft
last 12 mo · ≤1 miLoading sold comps…