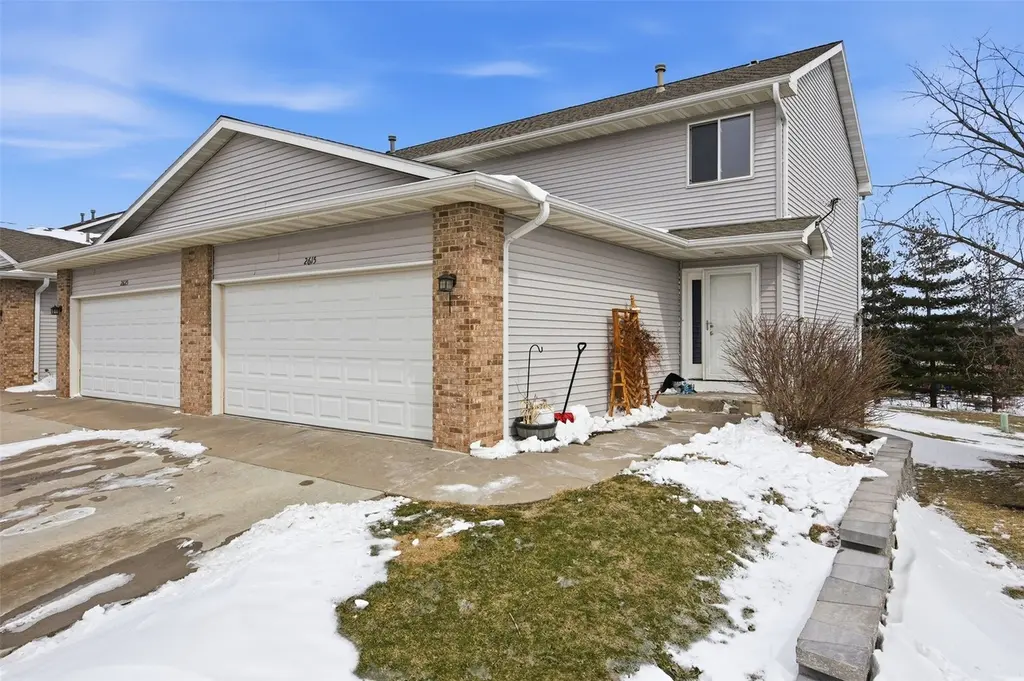
2615 Pheasant Ridge Ct · Marion, IA
Flood risk 1/10 · Minimal
- FEMA flood zone
- X (unshaded)
- Chance of flooding over 30 yrs
- 0.0%
- Est. flood insurance / yr
- $473 – $860
Fire risk 1/10 · Minimal
- Est. fire insurance / yr
- $902 – $1,676
Heat risk 3/10 · Minor
- Hot days now (above 104°F)
- 7 days/yr
- Hot days in 30 yrs
- 15 days/yr
Wind risk 2/10 · Minimal
- Chance of severe wind over 30 yrs
- —
Air-quality risk 2/10 · Minimal
- Unhealthy air days now
- 1 days/yr
- Unhealthy air days in 30 yrs
- 2 days/yr
Risk factors via First Street. Map © Google.
Why this score? — see what drove the F grade
The composite is a weighted blend of 9 inputs, each scored 0–100. Each bar is that input's sub-score; the figure is the points it added to the 100-point composite (weight × sub-score).
- ARV discount +7.5/15.0
- Schools +6.6/10.0
- Rent growth +4.6/5.0
- Cash flow +4.2/30.0
- Livability +4.2/5.0
- Condition / age +2.5/5.0
- 1% rule +2.0/10.0
- DSCR +0.0/10.0
- Appreciation +0.0/10.0
$189,000
🖨 Deal sheet 📄 Offer letter ✓ Due diligence
Listing remarks MLS
Open house this Sunday 3/24 from 12-1:30pm. Beautiful Marion condo in a convenient location close to park, schools and shopping. This condo has a fantastic screened in deck to overlook the beautiful pine trees in the back. Enjoy the cozy warm gas fireplace in the living room where you can overlook it from the kitchen and dinning room. 2 nice sized bedrooms upstairs and a 3rd bedroom in the low-level with a bath connected to it. Call to set up an showing soon.
Key facts
- 3 seasons porch
- New furnace
- New appliances
Tags
Neighborhood map
What this means for you Summary
Snapshot
- This is a 2-bed/2.5-bath condo listed at $189k.
Deal economics
- At list price, monthly cash flow is $-511 ($-6k/yr) — negative.
- To cash-flow at today's rent, offer at most $99k (47.8% below list).
- To meet the 1% rule (rent ≥ 1% of price), the offer needs to be $132k (30.3% below list).
- Recommended offer: $99k (47.8% below list) — sets the bar for cash-flow.
Location & tenants
- Location reads 84/100 on livability (#19 in IA, #633 nationally) — a professional / high-income tenant draw. Strengths: crime A+, cost of living A+, housing A+; Watch: amenities D-, commute F.
- Linn-Mar Community School District (suburban): math 75% / reading 76% proficiency, ranked #44 of 289 in IA (top 15%) — strong family-tenant draw, lease renewals of 3-5y typical; only 16% free/reduced lunch — higher-income household profile.
- Zoned schools: Novak Elementary School (math 67% / reading 62%, grade B, #317 of 616 statewide, top 58%, 371 students, 27% FRL); Excelsior Middle School (math 71% / reading 72%, grade A, #106 of 246 statewide, top 44%, 617 students, 28% FRL); Linn-Mar High School (math 73% / reading 78%, grade A-, #79 of 336 statewide, top 25%, 2,271 students, 23% FRL).
- Market conditions: Rents rising fast (+8.4%/yr); 455 active listings in the ZIP; 1 comparable units currently listed for rent nearby; solid renter incomes; 1,023 units permitted in Linn County in 2024 (456 in 5+ unit buildings).
- This rent is only 18% of the median local income ($88k/yr) — well below the 30% rent-burden line; pricing power to push rent on renewal without tenant pushback.
Forward outlook
- Local home prices are declining (-3.0%/yr); year-one equity from $1k of loan paydown is wiped out by about $6k of value loss. Plan a longer hold.
- Linn County population projected at +16% by 2050 — long-run rental-demand tailwind backs the buy-and-hold thesis.
Negotiation context
- Only 4 days on market — expect competitive offers; lowballing is unlikely to land.
- 2 sale attempts since 7y ago with the ask held roughly flat each time — persistent listings suggest the price (not the market) is what's stuck; bring a comps-based counter.
- Current owner paid $149k; 27% above their basis — modest negotiation headroom, anchor on the comps not their cost.
Questions for the listing agent
- What do current leases actually rent for vs. the listed asking? Can we see a recent rent roll and the last 12 months of T-12 income?
- What does the HOA fee cover, when was the last increase, and are there any pending special assessments or reserve-fund shortfalls?
- Any open or pending special assessments — roof, HVAC, plumbing, elevator, façade? What's the per-unit balance and payoff schedule, and is the seller paying it off at close or rolling it to the buyer?
- Is there a deadline driving the sale (1031 exchange, divorce, estate, relocation)? That informs how much negotiation room exists.
- Schools are A-rated — typically a magnet for longer-tenancy family renters. What's the average tenant stay here, and is there a school-zone premium baked into asking?
- The area grade is low — what's the realistic commute time and amenity access for the typical tenant pool here? Any planned neighborhood developments (good or bad) we should know about?
- What's the average days-on-market for RENTAL listings here right now (not sales)? A rising rental-DOM trend means longer vacancies and softer asking-rent achievability than the comps imply.
- What's the recent tenant-quality profile in this submarket — average credit score on applications, eviction rate, late-payment / NSF rate, and stable-employment percentage? A property-management company in the area should have these aggregated.
- How much new apartment / multifamily construction is in the pipeline within 1–3 miles? Heavy new supply (>2% of stock underway) typically softens rents 12–24 months out; light construction supports rent growth.
Investment metrics
- 1% rule
- 0.70% ✗
- Cap rate
- 3.05%
- Cash-on-cash
- -11.59%
- DSCR
- 0.48
- GRM
- 12.0
CMA / ARV
No comps found within radius.
Projected returns pro-forma
-3.0% appreciation · 8.0% rent growth · sell at horizon
- IRR
- -30.7%
- Equity multiple
- -0.06×
- Total profit
- $-56,051
- Equity at exit
- $28,181
- IRR
- -15.7%
- Equity multiple
- -0.10×
- Total profit
- $-58,340
- Equity at exit
- $16,341
Cash invested: $52,920 (down + closing). Projections, not guarantees.
Landlord ↔ Tenant lean methodology
- Overall (STATE)
- 83 Strongly Landlord-Friendly
- State Iowa
- 83 Strongly Landlord-Friendly · R+6
- County
- — inherits STATE
- City
- — inherits STATE
ZIP-level market 52302
- Rents YoY
- 8.4%
- Active inventory
- 455
- Price-to-rent
- 12.0×
Monthly cashflow live
- Estimated rent
- $1,318 medium interval (Pro) →
- Mortgage (P&I)
- −$991
- Tax from tax record
- −$282 /mo · $3,390/yr
- Insurance
- −$79
- HOA
- −$200
- Vacancy / Maint / Mgmt
- −$277
- Net cashflow
- $-511
Break-even live
UW: 25.0% down · 7.5% · 30yr · 1.5% tax · 5.0% vac · 8.0% maint · 8.0% mgmt
Financing live
Cash to close
- Down payment
- $47,250
- Closing costs
- $5,670
- Reserves months
- —
- Total cash needed
- —
Loan-product check · same deal, 3 products live
Conventional
25% down · 7.5% · 30yr
- Down + closing
- —
- Monthly P&I
- —
- Monthly cashflow
- —
- DSCR
- —
- Eligible?
- —
Personal DTI + credit; lowest rate.
DSCR
20% down · 8.5% · 30yr
- Down + closing
- —
- Monthly P&I
- —
- Monthly cashflow
- —
- DSCR
- —
- Eligible?
- —
No personal income docs; deal must DSCR.
Hard money
10% down · 12.0% · 12mo
- Down + closing
- —
- Monthly P&I
- —
- Monthly cashflow
- —
- DSCR
- —
- Eligible?
- —
Short-term bridge; refi at stabilization.
Rent comps 1 comps
| Address | Beds | Baths | Sqft | Rent | $/sqft | DOM | Units | Dist |
|---|---|---|---|---|---|---|---|---|
| 2785 Ridgeview Way Marion, IA | 3.0 | 1.5 | 2015 | $1,650 | $0.82 | 13d | 1 | 0.08mi |
HOA detail condo
- Monthly dues
- $200 · $2,400/yr
- Likely covers
- gas
- Assessments
- None detected in remarks — confirm with the listing agent.
Listing history 6 events
-
2026-03-22status Pending
-
2026-03-18$189,000 Active
-
2019-05-21soldstatus $149,000
-
2019-05-16soldstatus $148,950 463-char remark
Show marketing remark (463 chars)
Open house this Sunday 3/24 from 12-1:30pm. Beautiful Marion condo in a convenient location close to park, schools and shopping. This condo has a fantastic screened in deck to overlook the beautiful pine trees in the back. Enjoy the cozy warm gas fireplace in the living room where you can overlook it from the kitchen and dinning room. 2 nice sized bedrooms upstairs and a 3rd bedroom in the low-level with a bath connected to it. Call to set up an showing soon.
-
2019-02-19$148,950 463-char remark
Show marketing remark (463 chars)
Open house this Sunday 3/24 from 12-1:30pm. Beautiful Marion condo in a convenient location close to park, schools and shopping. This condo has a fantastic screened in deck to overlook the beautiful pine trees in the back. Enjoy the cozy warm gas fireplace in the living room where you can overlook it from the kitchen and dinning room. 2 nice sized bedrooms upstairs and a 3rd bedroom in the low-level with a bath connected to it. Call to set up an showing soon.
-
2003-01-14soldstatus $108,000
ⓘ Source: listings_history table (triggers on properties + properties_extension) + one-shot
backfill from property_details.listing_events for pre-trigger history.
Tax reassessment forecast IA · Partial reset (capped growth)
- Current annual tax
- $3,390 · $282/mo
- Projected year-2 tax
- $3,390 · $282/mo
- Expected delta
- $0/yr ($0/mo · 0.0%)
ⓘ Screening estimate from a state-policy table — verify with the county assessor before closing.
Climate risk First Street
- Flood 1/10 Low FEMA zone X (unshaded) · 0% chance over 30 yrs
- Wildfire 1/10 Low
- Heat 3/10 Moderate 7 d/yr ≥104°F today · 15 d/yr by 30 yrs out
- Wind 2/10 Low
- Air quality 2/10 Low 1 unhealthy d/yr today · 2 by 30 yrs out
Nearby sold comps map
Loading sold comps map…
Walkable amenities ~0.75 mi
Loading nearby amenities…
Taxation est. · year 1
- Rental income
- $15,815
- − Mortgage interest
- −$10,587
- − Property taxes
- −$3,390
- − Insurance
- −$945
- − Repairs & maintenance
- −$1,265
- − Management
- −$1,265
- − HOA
- −$2,400
- − Depreciation
- −$5,498
- Taxable loss
- −$9,536
- Est. tax savings @ 24.0%
- +$2,289
- After-tax cash flow
- $-3,846/yr
For passive investors: Depreciation is non-cash, so a rental often shows a tax loss while cash-flowing — sheltering income. Rental losses are passive: they offset passive income freely, and up to $25,000/yr can offset ordinary (W-2) income if you actively participate and your MAGI is under $100k (phasing out to $0 by $150k); unused losses carry forward. On sale, claimed depreciation is recaptured at up to 25%, and gains may owe capital-gains tax (a 1031 exchange can defer both). Figures are a year-1 estimate at your 24.0% rate — not tax advice; consult a CPA.
Schools (NCES district)
- District
- Linn-Mar Community School District
- NCES district ID
- 1917220
- Math proficiency
- 75% ▼ -7.00%
- Reading proficiency
- 76% ▼ -5.00%
- Median HH income
- $72,473
- Composite
- 66.08/100
- National rank
- #440
- State rank
- #44 of 289 in IA
Livability — Marion
- Score
- 84/100
- State rank
- #19
- US rank
- #633
Category grades
Schools grade is shown separately in the Schools card above.
Census & demographics
- Census place
- Marion, IA
- County
- Linn County · 179,860 people
- City population
- 42,706
- Metro
- Cedar Rapids, IA
- Population (ZIP)
- 42,706
- Household income
- $87,983
- Rent vs Own
- Severe rent burden
- 940.0
Population outlook (Linn County) Hauer SSP2
- Today (2025)
- 239,589 people
- By 2030
- 248,587 · +3.8%
- By 2040
- 264,817 · +10.5%
- By 2050
- 278,685 · +16.3%
- By 2075
- 311,754 · +30.1%
- By 2100
- 336,773 · +40.6%
Race, ethnicity, and origin ACS 2023
- Neighborhood character
- Predominantly White (89%)
- Race & ethnicity
- White 89% Two or more races 4% Hispanic / Latino 3% Black 3% Asian 2%
- Common ancestry
- Portuguese 6% Iranian 3% Slovak 2%
- Foreign-born
- 3% · Canada
- Languages at home
- 96% English-only · Spanish 1% Other Indo-European 1%
Political lean MEDSL · Linn
- 2024 margin
- Lean D (+9.9) · D 54.2% · R 44.3% · Other 1.4%
- 2008→2024 swing
- -11.6pp toward R · 2008: 21.5pp · 2024: 9.9pp
- All cycles
- 2024: D+9.9 2020: D+13.7 2016: D+9.0 2012: D+17.6 2008: D+21.5
Not yet ingested
- Civics
- —
Market trends
- HPI YoY
- ▼ -144.98%
- Current HPI
- 199.2949
- Rent YoY
- ▲ 8.37%
- Metro
- Cedar Rapids, IA
- State GDP YoY
- ▲ 2.48%
- F500 in state
- 4
Industry mix (Fortune 500 HQ in IA)
| Industry | F500 HQs | Revenue |
|---|---|---|
| Financial Services | 1 | $16B |
|
||
| Retail / Convenience | 1 | $15B |
|
||
Price history
+75.0% since first listed6 events — show timeline
- 2026-03-22 Pending — CRAAR, CDRMLS
- 2026-03-18 Listed $189,000 CRAAR, CDRMLS
- 2019-05-21 Sold (Public Records) $149,000 Public Records
- 2019-05-16 Sold (MLS) $148,950 CRAAR, CDRMLS
- 2019-02-19 Listed $148,950 CRAAR, CDRMLS
- 2003-01-14 Sold (Public Records) $108,000 Public Records
Property tax history
+3.8%/yrLatest (2025): $3,390 · +3.7% YoY. Source: county tax records.
Cash-flow waterfall
monthlySold comps — $/sqft
last 12 mo · ≤1 miLoading sold comps…