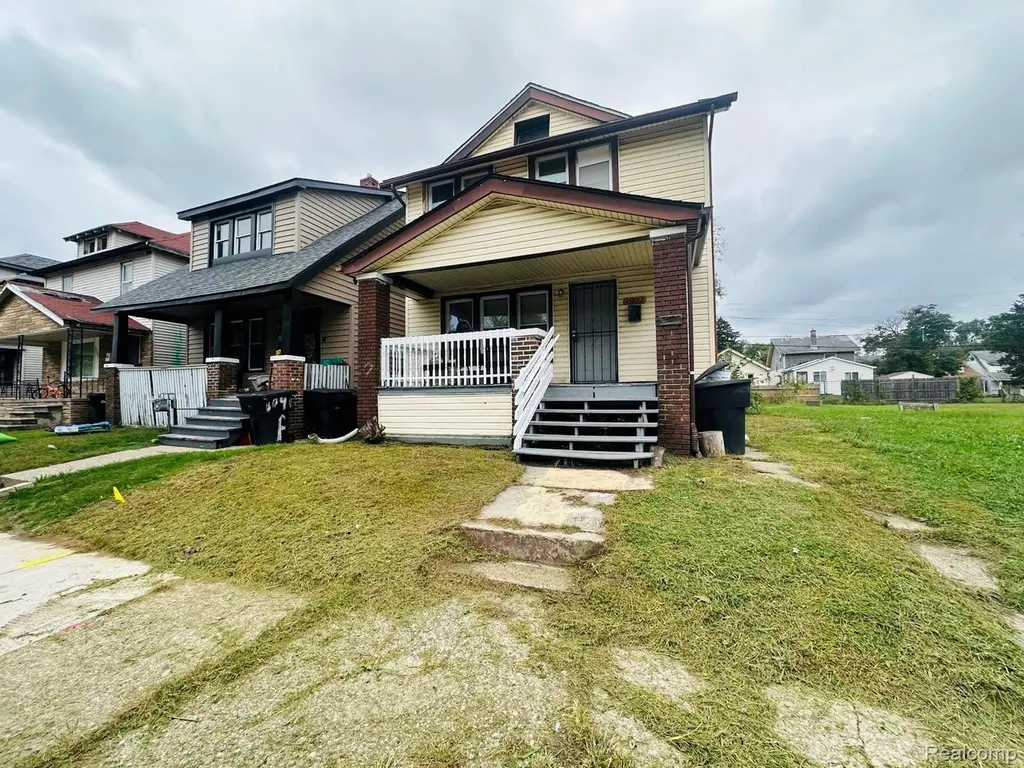
15822 Fairfield St · Detroit, MI
Flood risk 1/10 · Minimal
- FEMA flood zone
- X (unshaded)
- Chance of flooding over 30 yrs
- 0.0%
- Est. flood insurance / yr
- $473 – $860
Fire risk 1/10 · Minimal
- Est. fire insurance / yr
- $784 – $1,456
Heat risk 2/10 · Minimal
- Hot days now (above 97°F)
- 6 days/yr
- Hot days in 30 yrs
- 13 days/yr
Wind risk 2/10 · Minimal
- Chance of severe wind over 30 yrs
- —
Air-quality risk 4/10 · Minor
- Unhealthy air days now
- 4 days/yr
- Unhealthy air days in 30 yrs
- 6 days/yr
Risk factors via First Street. Map © Google.
Why this score? — see what drove the B- grade
The composite is a weighted blend of 9 inputs, each scored 0–100. Each bar is that input's sub-score; the figure is the points it added to the 100-point composite (weight × sub-score).
- Cash flow +24.7/30.0
- ARV discount +15.0/15.0
- 1% rule +8.6/10.0
- DSCR +8.0/10.0
- Rent growth +4.0/5.0
- Livability +3.7/5.0
- Condition / age +2.5/5.0
- Schools +1.3/10.0
- Appreciation +0.0/10.0
$95,000
🖨 Deal sheet (PDF) 📄 Offer letter ✓ Due diligence
Listing remarks MLS
Discover Your Next Opportunity: 15822 Fairfield St, Detroit, MI 48238 Priced at an attractive $97,000 (recently adjusted for quick sale), this beautifully remodeled 3-bedroom, 1-bath colonial-style single-family home offers exceptional value and tremendous potential in Detroit's vibrant Pilgrim Village / Roycroft neighborhood. classic charm, it spans approximately Nestled in a historic, tree-lined residential area between Livernois Avenue and Wyoming Avenue near 7 Mile Road, this home places you in the heart of Detroit's revitalizing northwest side. Enjoy easy access to: Shopping, dining, and culture along the Livernois corridor and Avenue of Fashion (home to iconic spots like Baker's Keyboard Lounge). Rouge Park and Palmer Park are nearby for trails, fields, and outdoor activities . Close to freeways, public transit options, and major routes for convenient commuting. This car-dependent but transit-friendly location offers a perfect blend of quiet neighborhood living with urban accessibility. Private yard with wooden fencing - ideal for gardening, play, or relaxation. Whether you're a first-time buyer, house hacker, or investor, the low price point, solid bones, and neighborhood momentum make this a standout deal. Current market conditions in the area support strong upside potential through sweat equity or rental income. Don't miss this fantastic opportunity to own a piece of Detroit's comeback story at an affordable entry price. Perfect for families, professionals, or savvy investors looking for value in a location with real growth potential!
Key facts
- 2,614 sq ft lot
- Built 1923
- Listed 7 days
Tags
Property features AI
Exterior
- Parking: No garage
- Utilities: Water available; Sewer available
- Home design: Single-family residence; Two stories; Ground-level entry with steps
- Construction: Vinyl siding; Brick/mortar foundation
- Exterior features: Paved road access; Lot approximately 0.06 acres (28 x 100)
Interior
- Bathrooms: One full bathroom
- Heating & cooling: Forced air heating (natural gas); No cooling
- Interior features: Unfinished basement; Five total rooms
Neighborhood map
What this means for you Summary
Snapshot
- This is a 3-bed/1.0-bath single-family listed at $95k.
Deal economics
- At list price, monthly cash flow is $199 ($2k/yr) — positive.
- The deal already cash-flows at list — no discount required.
- Meets the 1% rule at list price ($1k rent vs $95k).
Location & tenants
- Location reads 73/100 on livability (#218 in MI) — a middle-class / working-renter tenant base. Strengths: amenities A+, commute A+, cost of living A+; Watch: schools F, crime F, employment F.
- Detroit Public Schools Community District (urban): math 10% / reading 24% proficiency, ranked #499 of 540 in MI (top 92%) — low school quality limits family demand, transient renter base, plan for 1-2y turnover; 90% free/reduced lunch — lower-income household profile, screen leases tightly.
- Market conditions: Rents rising fast (+6.1%/yr); 350 active listings in the ZIP; 40 comparable units currently listed for rent nearby; rentals at typical pace (median 26d on market — plan ~3-4 weeks tenant-placement turnaround); lower-income renter base — watch delinquency; 2,639 units permitted in Wayne County in 2024 (1,216 in 5+ unit buildings).
- At $1,294/mo this rent would consume 47% of the median local household income ($33k/yr) (locally 2172% of renters already pay >50% of income on rent) — very limited rent-growth headroom before tenants either downsize or default.
Forward outlook
- Local home prices are declining (-3.0%/yr); year-one equity from $657 of loan paydown is wiped out by about $3k of value loss. Plan a longer hold.
- Wayne County population projected at -17% by 2050 — secular population decline; favor cash flow + early exit over multi-decade hold.
- At projected returns (-3.0% appreciation + 6.1% rent growth), your $27k cash investment doubles in ~9 years — after that, you're playing with house money.
Negotiation context
- Only 7 days on market — expect competitive offers; lowballing is unlikely to land.
- 8 sale attempts since 13y ago with the ask held roughly flat each time — persistent listings suggest the price (not the market) is what's stuck; bring a comps-based counter.
Risks & watch-outs
- Watch-outs: property tax is 3.6% of price; built in 1923 — expect roof / HVAC / electrical / plumbing capex.
Questions for the listing agent
- Built in 1923 — when were the roof, HVAC, electrical panel, plumbing, and water heater last replaced?
- Property tax is high relative to price — has the assessment been appealed recently, and will the sale trigger a re-assessment?
- Is there a deadline driving the sale (1031 exchange, divorce, estate, relocation)? That informs how much negotiation room exists.
- Schools are F-rated, which usually means shorter tenancies and higher turnover. Who's the typical renter profile here, and what's been the actual vacancy rate?
- Crime grade is F in this area — have there been break-ins, vandalism, or insurance claims at this property in the last 3 years? What carrier currently insures it and at what premium?
- What's the average days-on-market for RENTAL listings here right now (not sales)? A rising rental-DOM trend means longer vacancies and softer asking-rent achievability than the comps imply.
- What's the recent tenant-quality profile in this submarket — average credit score on applications, eviction rate, late-payment / NSF rate, and stable-employment percentage? A property-management company in the area should have these aggregated.
- How much new for-sale + rental construction is in the pipeline within 1–3 miles? Heavy new supply typically softens prices + rents 12–24 months out; constrained supply supports both.
Investment metrics
- 1% rule
- 1.36% ✓
- Cap rate
- 8.81%
- Cash-on-cash
- 8.99%
- DSCR
- 1.40
- GRM
- 6.1
CMA / ARV
- ARV (median comp)
- $161,618
- List price
- $95,000
- Delta
- -41.22%
- Verdict
- UNDERPRICED
- Comps
- 20 within 1.0 mi
Show comp detail 12 sales within ~0.75 mi
| Address | Dist | Beds/Ba | Sqft | Sold | Price | $/sf | Match |
|---|---|---|---|---|---|---|---|
| 15863 Belden St | 0.08mi | 3/1.0 | 1,156 (-4%) | 1mo | $18,600 | $16 | 89 |
| 15904 Parkside St | 0.17mi | 3/1.5 | 1,204 (-0%) | 2mo | $140,000 | $116 | 89 |
| 15840 Lawton St | 0.25mi | 3/1.0 | 1,176 (-2%) | 7mo | $38,000 | $32 | 79 |
| 15455 Wildemere St | 0.20mi | 3/1.0 | 1,095 (-9%) | 2mo | $18,500 | $17 | 73 |
| 15021 Petoskey Ave | 0.56mi | 3/1.0 | 1,177 (-2%) | 1mo | $28,000 | $24 | 69 |
| 16820 Santa Rosa Dr | 0.64mi | 3/1.0 | 1,224 (+2%) | 0mo | $10,000 | $8 | 67 |
| 16596 Prairie St | 0.66mi | 3/1.0 | 1,224 (+2%) | 8mo | $50,000 | $41 | 60 |
| 6433 Globe St | 0.46mi | 3/1.0 | 1,344 (+12%) | 7mo | $100,000 | $74 | 53 |
| 15853 Santa Rosa Dr | 0.44mi | 4/1.0 (+1) | 1,050 (-13%) | 2mo | $140,000 | $133 | 51 |
| 16570 Inverness St | 0.71mi | 4/2.0 (+1) | 1,300 (+8%) | 3mo | $120,000 | $92 | 42 |
| 14752 Petoskey Ave | 0.72mi | 3/1.5 | 1,029 (-15%) | 0mo | $40,000 | $39 | 40 |
| 16890 Monica St | 0.73mi | 4/1.0 (+1) | 1,359 (+13%) | 7mo | $165,000 | $121 | 34 |
Match score weights: distance 35% · size 25% · config 20% · recency 20%. Top-matched comps best support the ARV.
Projected returns pro-forma
-3.0% appreciation · 6.14% rent growth · sell at horizon
- IRR
- 1.5%
- Equity multiple
- 1.06×
- Total profit
- $1,634
- Equity at exit
- $14,165
- IRR
- 14.6%
- Equity multiple
- 2.38×
- Total profit
- $36,711
- Equity at exit
- $8,214
Cash invested: $26,600 (down + closing). Projections, not guarantees.
Landlord ↔ Tenant lean methodology
- Overall (STATE)
- 62 Landlord-Friendly
- State Michigan
- 62 Landlord-Friendly · EVEN
- County
- — inherits STATE
- City
- — inherits STATE
ZIP-level market 48238
- Home prices YoY
- -14.4%
- Rents YoY
- 6.1%
- Active inventory
- 350
- Price-to-rent
- 6.1×
Monthly cashflow live
- Estimated rent
- $1,294 high interval (Pro) →
- Mortgage (P&I)
- −$498
- Tax from tax record
- −$285 /mo · $3,419/yr
- Insurance
- −$40
- HOA
- −$0
- Vacancy / Maint / Mgmt
- −$272
- Net cashflow
- $199
Break-even live
Sensitivity live
| Price | -10% $253 | -5% $226 | +0% $199 | +5% $172 | +10% $145 |
|---|---|---|---|---|---|
| Rent | -10% $97 | -5% $148 | +0% $199 | +5% $250 | +10% $301 |
| Rate | -1.0pp $247 | -0.5pp $223 | base $199 | +0.5pp $175 | +1.0pp $150 |
UW: 25.0% down · 7.5% · 30yr · 1.5% tax · 5.0% vac · 8.0% maint · 8.0% mgmt
Financing live
Cash to close
- Down payment
- $23,750
- Closing costs
- $2,850
- Reserves months
- —
- Total cash needed
- —
Loan-product check · same deal, 3 products live
Conventional
25% down · 7.5% · 30yr
- Down + closing
- —
- Monthly P&I
- —
- Monthly cashflow
- —
- DSCR
- —
- Eligible?
- —
Personal DTI + credit; lowest rate.
DSCR
20% down · 8.5% · 30yr
- Down + closing
- —
- Monthly P&I
- —
- Monthly cashflow
- —
- DSCR
- —
- Eligible?
- —
No personal income docs; deal must DSCR.
Hard money
10% down · 12.0% · 12mo
- Down + closing
- —
- Monthly P&I
- —
- Monthly cashflow
- —
- DSCR
- —
- Eligible?
- —
Short-term bridge; refi at stabilization.
Rent comps 40 comps
| Address | Beds | Baths | Sqft | Rent | $/sqft | DOM | Units | Dist |
|---|---|---|---|---|---|---|---|---|
| 15906 Alden St Detroit, MI | 3.0 | 1.0 | 1030 | $1,150 | $1.12 | 18d | 1 | 0.20mi |
| 15345 Parkside St Detroit, MI | 3.0 | 1.0 | 1152 | $1,300 | $1.13 | 45d | 1 | 0.33mi |
| 16174 Princeton St Unit 2 Detroit, MI | 2.0 | 1.0 | 985 | $1,100 | $1.12 | 45d | 1 | 0.35mi |
| 16174 Princeton St Detroit, MI | 2.0 | 1.0 | 985 | $1,100 | $1.12 | 21d | 1 | 0.35mi |
| 7350 Globe St Detroit, MI | 3.0 | 1.0 | 1000 | $1,550 | $1.55 | 5d | 1 | 0.55mi |
| 16582 Santa Rosa Dr Detroit, MI | 3.0 | 1.0 | 1314 | $1,399 | $1.06 | 19d | 1 | 0.59mi |
| 16255 Lilac St Detroit, MI | 3.0 | 1.0 | 1312 | $1,394 | $1.06 | 19d | 1 | 0.73mi |
| 2521 W McNichols Rd Unit B2 Detroit, MI | 2.0 | 1.0 | 1300 | $1,250 | $0.96 | 45d | 1 | 0.74mi |
| 15771 Turner St Detroit, MI | 2.0 | 1.0 | 1000 | $1,049 | $1.05 | 45d | 1 | 0.76mi |
| 17215 Warrington Dr Detroit, MI | 2.0 | 1.0 | 1015 | $2,000 | $1.97 | 45d | 1 | 0.81mi |
| 16927 Inverness St Detroit, MI | 2.0 | 1.0 | 897 | $1,650 | $1.84 | 18d | 1 | 0.82mi |
| 17145 Santa Rosa Dr Unit 1 Detroit, MI | 3.0 | 1.0 | 1050 | $1,400 | $1.33 | 19d | 1 | 0.83mi |
| 17147 Monica St Unit 2 1 Detroit, MI | 2.0 | 1.0 | 900 | $975 | $1.08 | 26d | 1 | 0.87mi |
| 16722 Tuller St Detroit, MI | 3.0 | 1.5 | 1100 | $1,500 | $1.36 | 18d | 1 | 0.87mi |
| 17163 Prairie St Unit 1B Detroit, MI | 3.0 | 1.5 | 1317 | $1,350 | $1.03 | 45d | 1 | 0.91mi |
| 2034 Ewald Cir Detroit, MI | 2.0 | 1.0 | 1000 | $995 | $0.99 | 6d | 1 | 0.91mi |
| 15457 Cloverlawn St Detroit, MI | 3.0 | 2.0 | 1500 | $1,275 | $0.85 | 26d | 1 | 0.97mi |
| 326 Eason St Highland Park, MI | 3.0 | 1.0 | 1256 | $1,300 | $1.04 | 19d | 1 | 1.01mi |
| 17551 Santa Rosa Dr Detroit, MI | 2.0 | 1.0 | 1036 | $1,095 | $1.06 | 45d | 1 | 1.05mi |
| 2433 Pasadena St Unit 2435 Detroit, MI | 2.0 | 1.0 | 700 | $1,025 | $1.46 | 45d | 1 | 1.06mi |
| 17596 Santa Rosa Dr Detroit, MI | 2.0 | 1.0 | 1350 | $1,195 | $0.89 | 45d | 1 | 1.08mi |
| 17596 Santa Rosa Dr Unit 2 Detroit, MI | 2.0 | 1.0 | 1350 | $1,195 | $0.89 | 26d | 1 | 1.08mi |
| 13639 La Salle Blvd Detroit, MI | 2.0 | 1.0 | 800 | $695 | $0.87 | 12d | 1 | 1.11mi |
| 14656 Roselawn St Detroit, MI | 3.0 | 1.0 | 1000 | $1,200 | $1.20 | 19d | 1 | 1.13mi |
| 17368 Woodingham Dr Detroit, MI | 3.0 | 1.5 | 1200 | $1,800 | $1.50 | 45d | 1 | 1.16mi |
| 15777 Wisconsin St Unit 77 Detroit, MI | 2.0 | 1.0 | 900 | $950 | $1.06 | 6d | 1 | 1.17mi |
| 941 Merton Rd Highland Park, MI | 2.0 | 1.0 | 850 | $1,000 | $1.18 | 45d | 1 | 1.19mi |
| 3812 W Grand St Detroit, MI | 2.0 | 1.0 | 1100 | $1,025 | $0.93 | 18d | 1 | 1.19mi |
| 17449 Manderson Rd Unit 1 Detroit, MI | 2.0 | 1.0 | 750 | $1,150 | $1.53 | 26d | 1 | 1.19mi |
| 16183 Wisconsin St Detroit, MI | 3.0 | 1.5 | 1370 | $1,400 | $1.02 | 45d | 1 | 1.20mi |
| 17159 Northlawn St Unit 17161 Detroit, MI | 2.0 | 1.0 | 1122 | $975 | $0.87 | 6d | 1 | 1.23mi |
| 16230 Indiana St Unit 2 Detroit, MI | 2.0 | 1.0 | 1050 | $1,200 | $1.14 | 19d | 1 | 1.24mi |
| 1926 Clements St Unit 1926 Detroit, MI | 3.0 | 1.0 | 1150 | $1,250 | $1.09 | 21d | 1 | 1.25mi |
| 1926 Clements St Detroit, MI | 3.0 | 1.0 | 1150 | $1,150 | $1.00 | 6d | 1 | 1.25mi |
| 17195 Northlawn St #1 Detroit, MI | 2.0 | 1.0 | 1200 | $1,100 | $0.92 | 21d | 1 | 1.25mi |
| 17195 Northlawn St #2 Detroit, MI | 2.0 | 1.0 | 1200 | $1,050 | $0.88 | 26d | 1 | 1.25mi |
| 15878 Kentucky St Detroit, MI | 2.0 | 1.0 | 800 | $900 | $1.12 | 45d | 1 | 1.26mi |
| 14550 Northlawn St Detroit, MI | 3.0 | 2.0 | 950 | $1,200 | $1.26 | 18d | 1 | 1.27mi |
| 17670 Manderson Rd Unit 17670 Detroit, MI | 2.0 | 1.0 | 1199 | $1,595 | $1.33 | 45d | 1 | 1.27mi |
| 17666 Manderson Rd Unit 17666 Detroit, MI | 2.0 | 1.0 | 1200 | $1,595 | $1.33 | 45d | 1 | 1.27mi |
Listing history 30 events
-
2026-06-21days on market $95,000 Active 7 DOM
-
2026-06-18days on market $95,000 Active 4 DOM
-
2026-06-17days on market $95,000 Active 3 DOM
-
2026-06-16days on market $95,000 Active 2 DOM
-
2026-06-15$95,000 Active 1 DOM
-
2026-06-15remarks 699-char remark
-
2026-06-15days on market $95,000 Active 1 DOM
-
2026-06-13days on market $95,000 Active 304 DOM
-
2026-06-13days on market $95,000 Active 303 DOM
-
2026-06-09days on market $95,000 Active 300 DOM
-
2026-06-08days on market $95,000 Active 299 DOM
-
2026-06-07days on market $95,000 Active 298 DOM
-
2026-06-04days on market $95,000 Active 295 DOM
-
2026-06-03days on market $95,000 Active 294 DOM
-
2026-06-01days on market $95,000 Active 292 DOM
-
2026-05-31days on market $95,000 Active 291 DOM
-
2026-02-06price $97,000 114-char remark
-
2026-02-05price $97,000 114-char remark
-
2025-08-13$99,000 Active 114-char remark
-
2025-08-13$99,000 Active 114-char remark
-
2022-01-13soldstatus $99,900
-
2014-01-29soldstatus $2,350
-
2014-01-29soldstatus $2,350
-
2014-01-08historical
-
2013-12-11$2,350
-
2013-12-11$2,350
-
2013-08-23historical
-
2013-08-23historical
-
2013-05-08$2,900
-
2013-05-08$2,900
ⓘ Source: listings_history table (triggers on properties + properties_extension) + one-shot
backfill from property_details.listing_events for pre-trigger history.
Tax reassessment forecast MI · Partial reset (capped growth)
- Current annual tax
- $3,419 · $285/mo
- Projected year-2 tax
- $3,419 · $285/mo
- Expected delta
- $0/yr ($0/mo · 0.0%)
ⓘ Screening estimate from a state-policy table — verify with the county assessor before closing.
Climate risk First Street
- Flood 1/10 Low FEMA zone X (unshaded) · 0% chance over 30 yrs
- Wildfire 1/10 Low
- Heat 2/10 Low 6 d/yr ≥97°F today · 13 d/yr by 30 yrs out
- Wind 2/10 Low
- Air quality 4/10 Moderate 4 unhealthy d/yr today · 6 by 30 yrs out
Nearby sold comps map
Loading sold comps map…
Walkable amenities ~0.75 mi
Loading nearby amenities…
Taxation est. · year 1
- Rental income
- $15,524
- − Mortgage interest
- −$5,321
- − Property taxes
- −$3,419
- − Insurance
- −$475
- − Repairs & maintenance
- −$1,242
- − Management
- −$1,242
- − Depreciation
- −$2,764
- Taxable income
- $1,061
- Est. tax owed @ 24.0%
- −$255
- After-tax cash flow
- $2,137/yr
For passive investors: Depreciation is non-cash, so a rental often shows a tax loss while cash-flowing — sheltering income. Rental losses are passive: they offset passive income freely, and up to $25,000/yr can offset ordinary (W-2) income if you actively participate and your MAGI is under $100k (phasing out to $0 by $150k); unused losses carry forward. On sale, claimed depreciation is recaptured at up to 25%, and gains may owe capital-gains tax (a 1031 exchange can defer both). Figures are a year-1 estimate at your 24.0% rate — not tax advice; consult a CPA.
Schools (NCES district)
- District
- Detroit Public Schools Community District
- NCES district ID
- 2601103
- Math proficiency
- 10% ▼ -2.00%
- Reading proficiency
- 24% ▲ 6.00%
- Median HH income
- $25,815
- Composite
- 13.06/100
- National rank
- #9564
- State rank
- #499 of 540 in MI
Livability — Detroit
- Score
- 73/100
- State rank
- #218
- US rank
- #5427
Category grades
Schools grade is shown separately in the Schools card above.
Census & demographics
- Census place
- Detroit, MI
- County
- Wayne County · 1,562,939 people
- City population
- 572,865
- Metro
- Detroit-Warren-Dearborn, MI
- Population (ZIP)
- 24,731
- Household income
- $33,315
- Rent vs Own
- Severe rent burden
- 2172.0
Population outlook (Wayne County) Hauer SSP2
- Today (2025)
- 1,675,273 people
- By 2030
- 1,620,300 · -3.3%
- By 2040
- 1,502,341 · -10.3%
- By 2050
- 1,384,039 · -17.4%
- By 2075
- 1,124,592 · -32.9%
- By 2100
- 881,193 · -47.4%
Race, ethnicity, and origin ACS 2023
- Neighborhood character
- Predominantly Black (94%)
- Race & ethnicity
- Black 94% Two or more races 3% White 1%
- Foreign-born
- 1%
Political lean MEDSL · Wayne
- 2024 margin
- Strong D (+29.0) · D 62.7% · R 33.7% · Other 3.6%
- 2008→2024 swing
- -20.5pp toward R · 2008: 49.5pp · 2024: 29.0pp
- All cycles
- 2024: D+29.0 2020: D+38.1 2016: D+37.3 2012: D+46.9 2008: D+49.5
Not yet ingested
- Civics
- —
Market trends
- HPI YoY
- ▼ -31.96%
- Current HPI
- 189.6227
- Rent YoY
- ▲ 6.14%
- Metro
- Detroit-Warren-Dearborn, MI
- State GDP YoY
- ▲ 1.37%
- F500 in state
- 28
Industry mix (Fortune 500 HQ in MI)
| Industry | F500 HQs | Revenue |
|---|---|---|
| Automotive Parts | 3 | $48B |
|
||
| Automotive | 2 | $372B |
|
||
| Chemicals | 1 | $45B |
|
||
| Automotive Retail | 1 | $29B |
|
||
| Healthcare / Medical Devices | 1 | $23B |
|
||
| Automotive Technology | 1 | $20B |
|
||
Price history
+3175.9% since first listed20 events — show timeline
- 2026-06-14 Listing Removed — MiRealSource-MiMLS
- 2026-06-14 Listed $95,000 REALCOMP
- 2026-06-14 Listed $95,000 MiRealSource-MiMLS
- 2026-06-14 Listing Removed — REALCOMP
- 2026-05-28 Price Changed $95,000 MiRealSource-MiMLS
- 2026-05-28 Price Changed $95,000 REALCOMP
- 2026-02-06 Price Changed $97,000 MiRealSource-MiMLS
- 2026-02-05 Price Changed $97,000 REALCOMP
- 2025-08-13 Listed $99,000 MiRealSource-MiMLS
- 2025-08-13 Listed $99,000 REALCOMP
- 2022-01-13 Sold (Public Records) $99,900 Public Records
- 2014-01-29 Sold (MLS) $2,350 REALCOMP
- 2014-01-29 Sold (MLS) $2,350 MiRealSource-MiMLS
- 2014-01-08 Listing Removed — MiRealSource-MiMLS
- 2013-12-11 Listed $2,350 REALCOMP
- 2013-12-11 Listed $2,350 MiRealSource-MiMLS
- 2013-08-23 Listing Removed — MiRealSource-MiMLS
- 2013-08-23 Listing Removed — REALCOMP
- 2013-05-08 Listed $2,900 MiRealSource-MiMLS
- 2013-05-08 Listed $2,900 REALCOMP
Property tax history
+14.6%/yrLatest (2025): $3,419 · +98.6% YoY. Source: county tax records.
Cash-flow waterfall
monthlySold comps — $/sqft
last 12 mo · ≤1 miLoading sold comps…