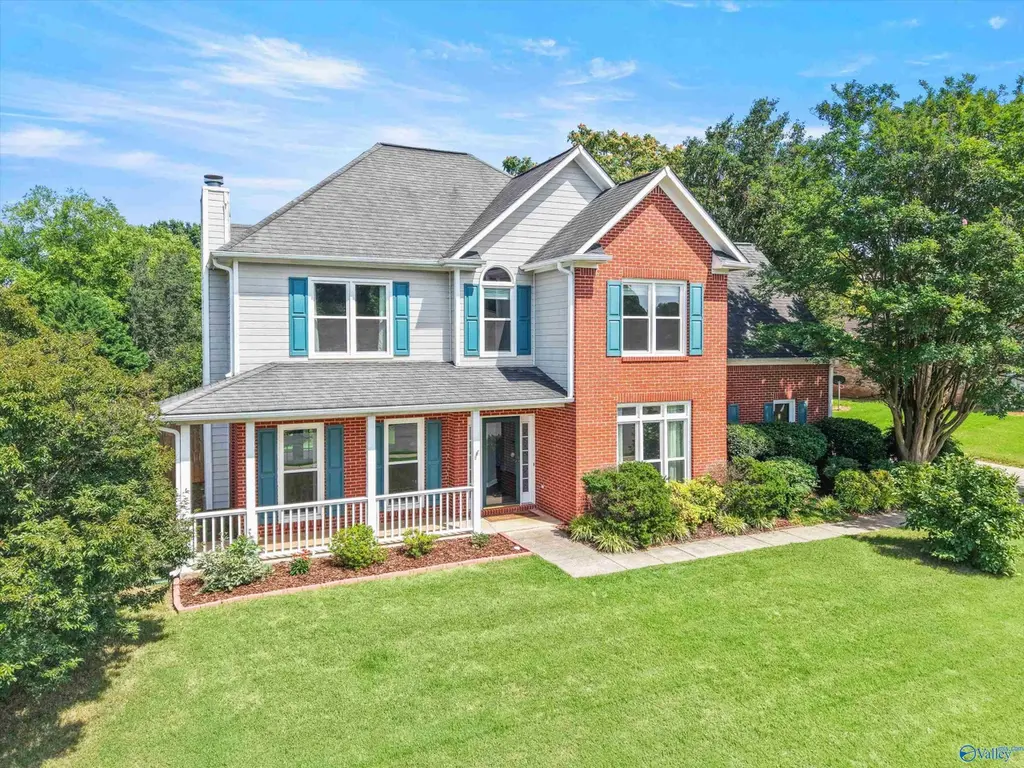
119 Antique Rose Dr · Madison, AL
Flood risk 1/10 · Minimal
- FEMA flood zone
- X (unshaded)
- Chance of flooding over 30 yrs
- 0.0%
- Est. flood insurance / yr
- $507 – $1,088
Fire risk 3/10 · Minor
- Est. fire insurance / yr
- $916 – $1,700
Heat risk 6/10 · Moderate
- Hot days now (above 104°F)
- 7 days/yr
- Hot days in 30 yrs
- 19 days/yr
Wind risk 4/10 · Minor
- Chance of severe wind over 30 yrs
- 18.0%
Air-quality risk 2/10 · Minimal
- Unhealthy air days now
- 1 days/yr
- Unhealthy air days in 30 yrs
- 1 days/yr
Risk factors via First Street. Map © Google.
Why this score? — see what drove the D- grade
The composite is a weighted blend of 9 inputs, each scored 0–100. Each bar is that input's sub-score; the figure is the points it added to the 100-point composite (weight × sub-score).
- Appreciation +10.0/10.0
- Cash flow +5.8/30.0
- Schools +5.6/10.0
- ARV discount +4.9/15.0
- Livability +3.8/5.0
- Rent growth +2.9/5.0
- Condition / age +2.5/5.0
- 1% rule +0.3/10.0
- DSCR +0.2/10.0
$399,900
🖨 Deal sheet 📄 Offer letter ✓ Due diligence
Listing remarks
Traditional 2-story home in the heart of Madison City. This charming residence features 4 bedrooms and 3 bathrooms, with updated baths and new LVP flooring throughout. Enjoy a formal dining room for gatherings and a cozy living area with a gas fireplace. Step outside to a backyard built for relaxing and entertaining, unwind under the pergola on the back patio or gather around the fire pit. The privacy-fenced yard includes a handy storage shed. Convenient location close to schools, parks, shopping, and commuter routes. Move-in ready and easy to love.
Key facts
- 2 garage spots
- Built 1998
- Listed 4 days
Property features AI
Finance
- Other: Living area approximately 2,294 square feet; One gas-log fireplace
- HOA & community: No association; Subdivision: Kensington Estates; Community curbs
Exterior
- Parking: Two-car garage; Garage faces side
- Utilities: Public sewer
- Home design: Single-family residence; Two stories; Built in 1998; Residential property
- Construction: Vinyl siding; Slab foundation
- Exterior features: Treed lot; Detached building; Curb and gutters; Sidewalk; Underground utilities; Patio; Covered porch; Public water
Interior
- Kitchen: Range; Dishwasher; Microwave; Refrigerator
- Bathrooms: Two full bathrooms; One half bathroom
- Heating & cooling: Central heating; Central cooling
- Interior features: Fireplace with gas log; 9 total rooms
Neighborhood map
What this means for you Summary
Snapshot
- This is a 4-bed/1.5-bath single-family listed at $400k.
Deal economics
- At list price, monthly cash flow is $-799 ($-10k/yr) — negative.
- To cash-flow at today's rent, offer at most $259k (35.3% below list).
- To meet the 1% rule (rent ≥ 1% of price), the offer needs to be $210k (47.5% below list).
- Recommended offer: $210k (47.5% below list) — sets the bar for 1% rule.
- Cap rate 3.9% vs local median 2.6% in Madison — top-decile yield for the area; either an underpriced asset or a hidden risk that comps aren't pricing in. Stress-test before assuming the spread holds.
Location & tenants
- Location reads 76/100 on livability (#12 in AL, #3,280 nationally) — a middle-class / working-renter tenant base. Strengths: employment A+, housing A+, crime B+; Watch: amenities F, commute F.
- Madison City (suburban): math 51% / reading 71% proficiency, ranked #4 of 129 in AL (top 3%) — acceptable for families but not a draw, mixed tenant base, ~2y average lease; only 17% free/reduced lunch — higher-income household profile.
- Zoned schools: Rainbow Elementary School (math 52% / reading 76%, grade B, #44 of 627 statewide, top 7%, 926 students, 18% FRL); Discovery Middle School (math 46% / reading 69%, grade B, #13 of 257 statewide, top 5%, 1,334 students, 25% FRL); Bob Jones High School (math 53% / reading 51%, grade D+, #11 of 305 statewide, top 4%, 1,920 students, 24% FRL).
- Market conditions: Rents rising (+1.6%/yr); 382 active listings in the ZIP; 29 comparable units currently listed for rent nearby; rentals at typical pace (median 24d on market — plan ~3-4 weeks tenant-placement turnaround); 45% of comp listings sitting > 30 days — soft ceiling on asking rent; high-income renter base; 4,709 units permitted in Madison County in 2024 (1,186 in 5+ unit buildings).
Forward outlook
- In year one you build about $43k of equity ($3k loan paydown + $40k appreciation (10.0% local appreciation)).
- Madison County population projected at +18% by 2050 — long-run rental-demand tailwind backs the buy-and-hold thesis.
- By year 2, paydown + projected appreciation supports a ~$69k cash-out refi (75% LTV) — recoverable capital for the next deal without selling this one.
Negotiation context
- Only 4 days on market — expect competitive offers; lowballing is unlikely to land.
Risks & watch-outs
- Climate carrying-cost: extreme-heat days projected 7→19/yr by 2055 (HVAC capex compounding) — expect insurance premiums to compound above CPI over the hold.
Questions for the listing agent
- What do current leases actually rent for vs. the listed asking? Can we see a recent rent roll and the last 12 months of T-12 income?
- Is there a deadline driving the sale (1031 exchange, divorce, estate, relocation)? That informs how much negotiation room exists.
- Schools are A-rated — typically a magnet for longer-tenancy family renters. What's the average tenant stay here, and is there a school-zone premium baked into asking?
- The area grade is low — what's the realistic commute time and amenity access for the typical tenant pool here? Any planned neighborhood developments (good or bad) we should know about?
- What's the average days-on-market for RENTAL listings here right now (not sales)? A rising rental-DOM trend means longer vacancies and softer asking-rent achievability than the comps imply.
- What's the recent tenant-quality profile in this submarket — average credit score on applications, eviction rate, late-payment / NSF rate, and stable-employment percentage? A property-management company in the area should have these aggregated.
- How much new for-sale + rental construction is in the pipeline within 1–3 miles? Heavy new supply typically softens prices + rents 12–24 months out; constrained supply supports both.
Investment metrics
- 1% rule
- 0.53% ✗
- Cap rate
- 3.89%
- Cash-on-cash
- -8.57%
- DSCR
- 0.62
- GRM
- 15.9
CMA / ARV
- ARV (on-the-fly)
- $378,056
- Comps found
- 12
Show comp detail 12 sales within ~0.75 mi
| Address | Dist | Beds/Ba | Sqft | Sold | Price | $/sf | Match |
|---|---|---|---|---|---|---|---|
| 141 Antique Rose Dr | 0.17mi | 3/2.0 (-1) | 2,281 (+4%) | 3mo | $375,000 | $164 | 76 |
| 663 Gooch Ln | 0.50mi | 4/2.0 | 2,171 (-1%) | 8mo | $360,000 | $166 | 66 |
| 102 Appaloosa Ct | 0.37mi | 4/2.0 | 2,045 (-7%) | 6mo | $324,000 | $158 | 64 |
| 102 Medicine Bend Ct | 0.51mi | 4/2.5 | 2,060 (-6%) | 1mo | $400,000 | $194 | 61 |
| 231 Pebble Brook Dr | 0.40mi | 3/3.0 (-1) | 2,170 (-1%) | 9mo | $408,000 | $188 | 61 |
| 215 Pebblebrook Dr | 0.45mi | 4/2.5 | 2,312 (+5%) | 7mo | $422,950 | $183 | 61 |
| 109 Sleepy Hollow Ln | 0.35mi | 4/2.0 | 1,942 (-12%) | 5mo | $327,500 | $169 | 58 |
| 166 Brass Oak Dr | 0.66mi | 4/2.5 | 2,362 (+8%) | 1mo | $354,000 | $150 | 52 |
| 120 Brownstone Dr | 0.39mi | 4/3.0 | 2,500 (+14%) | 6mo | $410,000 | $164 | 48 |
| 112 Ramble Cir | 0.62mi | 5/2.5 (+1) | 2,431 (+11%) | 0mo | $450,000 | $185 | 44 |
| 165 Brass Oak Dr | 0.62mi | 5/2.0 (+1) | 2,001 (-9%) | 7mo | $345,000 | $172 | 43 |
| 104 Brookdel Dr | 0.49mi | 5/2.5 (+1) | 2,505 (+14%) | 3mo | $450,000 | $180 | 42 |
Match score weights: distance 35% · size 25% · config 20% · recency 20%. Top-matched comps best support the ARV.
Projected returns pro-forma
10.0% appreciation · 1.58% rent growth · sell at horizon
- IRR
- 17.9%
- Equity multiple
- 2.46×
- Total profit
- $163,776
- Equity at exit
- $360,262
- IRR
- 16.6%
- Equity multiple
- 5.61×
- Total profit
- $516,351
- Equity at exit
- $776,918
Cash invested: $111,972 (down + closing). Projections, not guarantees.
Landlord ↔ Tenant lean methodology
- Overall (STATE)
- 90 Strongly Landlord-Friendly
- State Alabama
- 90 Strongly Landlord-Friendly · R+15
- County
- — inherits STATE
- City
- — inherits STATE
ZIP-level market 35758
- Home prices YoY
- 4.2%
- Rents YoY
- 1.6%
- Active inventory
- 382
- Price-to-rent
- 15.9×
Monthly cashflow live
- Estimated rent
- $2,101 high interval (Pro) →
- Mortgage (P&I)
- −$2,097
- Tax from tax record
- −$195 /mo · $2,346/yr
- Insurance
- −$167
- HOA
- −$0
- Vacancy / Maint / Mgmt
- −$441
- Net cashflow
- $-799
Break-even live
UW: 25.0% down · 7.5% · 30yr · 1.5% tax · 5.0% vac · 8.0% maint · 8.0% mgmt
Financing live
Cash to close
- Down payment
- $99,975
- Closing costs
- $11,997
- Reserves months
- —
- Total cash needed
- —
Loan-product check · same deal, 3 products live
Conventional
25% down · 7.5% · 30yr
- Down + closing
- —
- Monthly P&I
- —
- Monthly cashflow
- —
- DSCR
- —
- Eligible?
- —
Personal DTI + credit; lowest rate.
DSCR
20% down · 8.5% · 30yr
- Down + closing
- —
- Monthly P&I
- —
- Monthly cashflow
- —
- DSCR
- —
- Eligible?
- —
No personal income docs; deal must DSCR.
Hard money
10% down · 12.0% · 12mo
- Down + closing
- —
- Monthly P&I
- —
- Monthly cashflow
- —
- DSCR
- —
- Eligible?
- —
Short-term bridge; refi at stabilization.
Rent comps 29 comps
| Address | Beds | Baths | Sqft | Rent | $/sqft | DOM | Units | Dist |
|---|---|---|---|---|---|---|---|---|
| 110 Wildweed Ct Madison, AL | 3.0 | 2.0 | 1481 | $1,750 | $1.18 | 43d | 1 | 0.17mi |
| 111 Tumbleweed Dr Madison, AL | 4.0 | 2.0 | 2010 | $2,450 | $1.22 | 13d | 1 | 0.38mi |
| 649 Gooch Ln Madison, AL | 4.0 | 2.0 | 1913 | $2,061 | $1.08 | 43d | 1 | 0.40mi |
| 333 Hay Rake Dr Madison, AL | 3.0 | 2.5 | 2047 | $2,200 | $1.07 | 13d | 1 | 0.73mi |
| 333 Hay Rake Dr Unit 1 Madison, AL | 3.0 | 3.0 | 2047 | $2,200 | $1.07 | 23d | 1 | 0.73mi |
| 318 Cornstalk CIR Madison, AL | 3.0 | 2.0 | 1837 | $1,995 | $1.09 | 43d | 1 | 0.97mi |
| 318 Cornstalk CIR Madison, AL | 3.0 | 2.0 | 1837 | $1,895 | $1.03 | 23d | 1 | 0.97mi |
| 217 John Clift CIR Madison, AL | 4.0 | 3.0 | 2503 | $2,800 | $1.12 | 13d | 1 | 0.97mi |
| 6079 Wall Triana Hwy Madison, AL | 3.0 | 2.0 | 1630 | $2,100 | $1.29 | 43d | 1 | 0.97mi |
| 206 Osceola Cir Madison, AL | 3.0 | 2.0 | 1850 | $1,850 | $1.00 | 43d | 1 | 0.97mi |
| 311 Cornstalk Cir Madison, AL | 3.0 | 2.0 | 1850 | $1,995 | $1.08 | 43d | 1 | 0.99mi |
| 309 Cornstalk CIR Madison, AL | 3.0 | 2.0 | 1850 | $1,995 | $1.08 | 43d | 1 | 1.00mi |
| 204 Stockyard CIR Madison, AL | 4.0 | 2.0 | 2106 | $2,300 | $1.09 | 13d | 1 | 1.00mi |
| 104 Kings Cross Dr Madison, AL | 3.0 | 2.0 | 1905 | $2,050 | $1.08 | 23d | 1 | 1.01mi |
| 104 Kings Cross Dr Madison, AL | 3.0 | 2.0 | 1906 | $2,050 | $1.08 | 43d | 1 | 1.01mi |
| 106 Champions Green Dr Madison, AL | 3.0 | 2.0 | 1950 | $1,995 | $1.02 | 23d | 1 | 1.01mi |
| 112 Willow Rose Ln Madison, AL | 4.0 | 2.0 | 2106 | $2,500 | $1.19 | 23d | 1 | 1.15mi |
| 102 McDermotts Way Madison, AL | 3.0 | 2.0 | 1462 | $1,675 | $1.15 | 14d | 1 | 1.16mi |
| 403 Barrington Hills Dr Madison, AL | 4.0 | 2.0 | 1820 | $1,950 | $1.07 | 21d | 1 | 1.23mi |
| 5541 Promenade Point Pkwy NW Madison, AL | 1.0–3.0 | 1.0–2.0 | 1556 | $2,300 | $1.48 | 21d | 1 | 1.26mi |
| 109 DuPont Cir Madison, AL | 3.0 | 2.0 | 1725 | $1,895 | $1.10 | 14d | 1 | 1.26mi |
| 115 Clift Creek DR Madison, AL | 4.0 | 3.0 | 1943 | $2,495 | $1.28 | 13d | 1 | 1.27mi |
| 206 Stockyard CIR Madison, AL | 3.0 | 2.0 | 1703 | $2,234 | $1.31 | 43d | 1 | 1.28mi |
| 212 Stockyard CIR Madison, AL | 5.0 | 2.5 | 2360 | $2,634 | $1.12 | 43d | 1 | 1.29mi |
| 207 Stockyard CIR Madison, AL | 4.0 | 3.0 | 1943 | $2,350 | $1.21 | 43d | 1 | 1.29mi |
| 114 Clover Ridge Dr Madison, AL | 3.0 | 2.0 | 2002 | $2,250 | $1.12 | 43d | 1 | 1.31mi |
| 137 Clover Ridge Dr Madison, AL | 3.0 | 2.0 | 1860 | $1,850 | $0.99 | 14d | 1 | 1.38mi |
| 500 Oval Ave NW Madison, AL | 2.0–4.0 | 2.5–3.0 | 1776 | $2,645 | $1.49 | 13d | 50 | 1.44mi |
| 110 Markum Ln Madison, AL | 3.0 | 2.0 | 1937 | $2,100 | $1.08 | 43d | 1 | 1.48mi |
Listing history 3 events
-
2026-06-08status $399,900 Pending 4 DOM
-
2026-06-07remarks 555-char remark
-
2026-06-07$399,900 Active 4 DOM
ⓘ Source: listings_history table (triggers on properties + properties_extension) + one-shot
backfill from property_details.listing_events for pre-trigger history.
Tax reassessment forecast AL · Resets to sale price
- Current annual tax
- $2,346 · $195/mo
- Projected year-2 tax
- $2,346 · $195/mo
- Expected delta
- $0/yr ($0/mo · 0.0%)
ⓘ Screening estimate from a state-policy table — verify with the county assessor before closing.
Climate risk First Street
- Flood 1/10 Low FEMA zone X (unshaded) · 0% chance over 30 yrs
- Wildfire 3/10 Moderate
- Heat 6/10 Major 7 d/yr ≥104°F today · 19 d/yr by 30 yrs out
- Wind 4/10 Moderate 18% chance of damaging wind over 30 yrs
- Air quality 2/10 Low 1 unhealthy d/yr today · 1 by 30 yrs out
Nearby sold comps map
Loading sold comps map…
Walkable amenities ~0.75 mi
Loading nearby amenities…
Taxation est. · year 1
- Rental income
- $25,215
- − Mortgage interest
- −$22,401
- − Property taxes
- −$2,346
- − Insurance
- −$2,000
- − Repairs & maintenance
- −$2,017
- − Management
- −$2,017
- − Depreciation
- −$11,633
- Taxable loss
- −$17,199
- Est. tax savings @ 24.0%
- +$4,128
- After-tax cash flow
- $-5,463/yr
For passive investors: Depreciation is non-cash, so a rental often shows a tax loss while cash-flowing — sheltering income. Rental losses are passive: they offset passive income freely, and up to $25,000/yr can offset ordinary (W-2) income if you actively participate and your MAGI is under $100k (phasing out to $0 by $150k); unused losses carry forward. On sale, claimed depreciation is recaptured at up to 25%, and gains may owe capital-gains tax (a 1031 exchange can defer both). Figures are a year-1 estimate at your 24.0% rate — not tax advice; consult a CPA.
Schools (NCES district)
- District
- Madison City
- NCES district ID
- 0100008
- Math proficiency
- 51% ▼ -25.00%
- Reading proficiency
- 71% ▼ -2.00%
- Median HH income
- $89,091
- Composite
- 55.56/100
- National rank
- #1238
- State rank
- #4 of 129 in AL
Livability — Madison
- Score
- 76/100
- State rank
- #12
- US rank
- #3280
Category grades
Schools grade is shown separately in the Schools card above.
Census & demographics
- Census place
- Madison, AL
- County
- Madison County · 380,832 people
- City population
- 93,742
- Metro
- Huntsville, AL
- Population (ZIP)
- 50,266
- Household income
- $117,380
- Rent vs Own
- Severe rent burden
- 875.0
Population outlook (Madison County) Hauer SSP2
- Today (2025)
- 392,086 people
- By 2030
- 409,788 · +4.5%
- By 2040
- 440,557 · +12.4%
- By 2050
- 460,990 · +17.6%
- By 2075
- 502,872 · +28.3%
- By 2100
- 513,623 · +31.0%
Race, ethnicity, and origin ACS 2023
- Neighborhood character
- Predominantly White (68%)
- Race & ethnicity
- White 68% Black 14% Hispanic / Latino 8% Asian 7% Two or more races 7%
- Hispanic origin (detail)
- Mexican 3% Puerto Rican 2%
- Common ancestry
- Slovak 3% Italian 2% Lithuanian 2%
- Foreign-born
- 9% · Canada, South Korea, Vietnam
- Languages at home
- 87% English-only · Spanish 5% Other Asian/Pacific 2% Chinese 1%
Political lean MEDSL · Madison
- 2024 margin
- Lean R (+9.0) · D 44.7% · R 53.7% · Other 1.6%
- 2008→2024 swing
- +6.0pp toward D · 2008: -14.9pp · 2024: -9.0pp
- All cycles
- 2024: R+9.0 2020: R+8.0 2016: R+16.8 2012: R+18.7 2008: R+14.9
Not yet ingested
- Civics
- —
Market trends
- HPI YoY
- ▲ 14.46%
- Current HPI
- 355.2784
- Rent YoY
- ▲ 1.58%
- Metro
- Huntsville, AL
- State GDP YoY
- ▲ 2.94%
- F500 in state
- 4
Industry mix (Fortune 500 HQ in AL)
| Industry | F500 HQs | Revenue |
|---|---|---|
| Financial Services | 1 | $8B |
|
||
| Healthcare | 1 | $5B |
|
||
Price history
+105.1% since first listed4 events — show timeline
- 2026-06-04 Listed $399,900 VMLS
- 2011-06-06 Sold (Public Records) $378,600 Public Records
- 2007-10-30 Sold (Public Records) $367,200 Public Records
- 2006-07-10 Sold (Public Records) $195,000 Public Records
Property tax history
+8.2%/yrLatest (2024): $2,346 · +10.0% YoY. Source: county tax records.
Cash-flow waterfall
monthlySold comps — $/sqft
last 12 mo · ≤1 miLoading sold comps…