 🔨 Auction
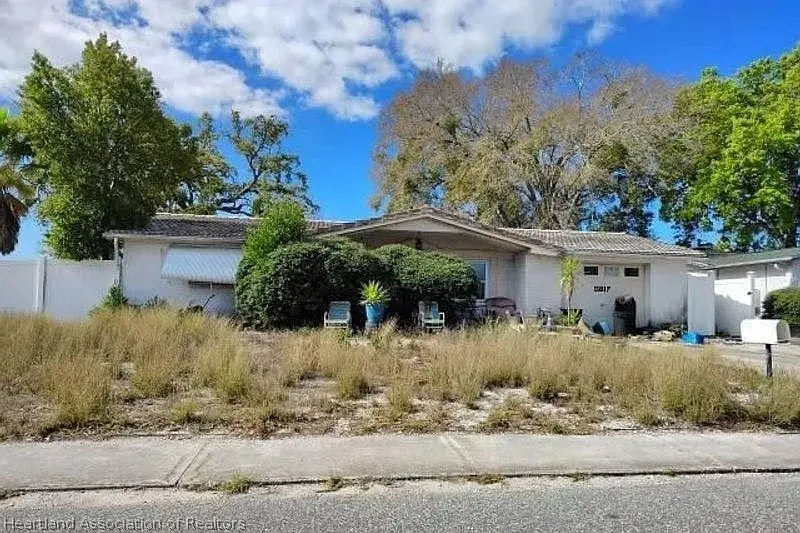
11817 Alpine Pkwy · Bayonet Point, FL
Flood risk 1/10 · Minimal
- FEMA flood zone
- X (unshaded)
- Chance of flooding over 30 yrs
- 0.0%
- Est. flood insurance / yr
- $507 – $1,088
Fire risk 6/10 · Moderate
- Est. fire insurance / yr
- $947 – $1,759
Heat risk 10/10 · Severe
- Hot days now (above 114°F)
- 7 days/yr
- Hot days in 30 yrs
- 26 days/yr
Wind risk 10/10 · Severe
- Chance of severe wind over 30 yrs
- 99.0%
Air-quality risk 2/10 · Minimal
- Unhealthy air days now
- 1 days/yr
- Unhealthy air days in 30 yrs
- 3 days/yr
Risk factors via First Street. Map © Google.
Why this score? — see what drove the F grade
The composite is a weighted blend of 9 inputs, each scored 0–100. Each bar is that input's sub-score; the figure is the points it added to the 100-point composite (weight × sub-score).
- Cash flow +9.1/30.0
- ARV discount +7.5/15.0
- Schools +4.3/10.0
- Livability +3.5/5.0
- 1% rule +2.8/10.0
- Rent growth +2.8/5.0
- DSCR +2.5/10.0
- Condition / age +2.5/5.0
- Appreciation +0.0/10.0
$5,000
🖨 Deal sheet 📄 Offer letter ✓ Due diligence
Listing remarks
Foreclosure Auction Ends May 28, 2026 at 11:00 AM EST. Explore this charming 2-bedroom, 1.5-bath residence set in a peaceful and well-located Port Richey community. The list price is the opening bid for the online auction. Sold As-is. Explore more details and submit your bid through Federa Home App.
Key facts
- 5,663 sq ft lot
- Garage
- Built 1976
Property features AI
Finance
- Other: Zoning: R4
Exterior
- Parking: Garage (1 space)
- Utilities: Water: Other; Sewer: Other
- Home design: Single-family residence; One level; Residential property
- Construction: Construction: see remarks
- Exterior features: Front porch; Other roof
Interior
- Flooring: Other
- Bathrooms: 1 full bathroom; 1 half bathroom
- Heating & cooling: No heating
- Interior features: Other flooring; Total of 1 room
Neighborhood map
What this means for you Summary
Snapshot
- This is a 2-bed/2.0-bath single-family listed at $5k.
Deal economics
- At list price, monthly cash flow is $-168 ($-2k/yr) — negative.
- The deal already cash-flows at list — no discount required.
- Meets the 1% rule at list price ($2k rent vs $5k).
Location & tenants
- Location reads 69/100 on livability (#485 in FL) — a middle-class / working-renter tenant base. Strengths: cost of living A+, housing A+, health & safety A+; Watch: crime D+, amenities D+, schools F.
- Pasco (suburban): math 50% / reading 52% proficiency, ranked #32 of 73 in FL (top 44%) — acceptable for families but not a draw, mixed tenant base, ~2y average lease.
- Market conditions: Rents rising (+1.3%/yr); 577 active listings in the ZIP; 40 comparable units currently listed for rent nearby; rentals at typical pace (median 24d on market — plan ~3-4 weeks tenant-placement turnaround); 6,765 units permitted in Pasco County in 2024 (1,250 in 5+ unit buildings).
- This rent runs 43% of the median local income ($47k/yr) — at the standard rent-burdened threshold; future hikes will face affordability resistance.
Forward outlook
- Local home prices are declining (-3.0%/yr); year-one equity from $1k of loan paydown is wiped out by about $6k of value loss. Plan a longer hold.
- Pasco County population projected at +29% by 2050 — long-run rental-demand tailwind backs the buy-and-hold thesis.
Negotiation context
- Only 5 days on market — expect competitive offers; lowballing is unlikely to land.
Risks & watch-outs
- Watch-outs: property tax is 64.9% of price.
- Climate carrying-cost: severe wind risk, 99% chance of damaging wind over 30y; major wildfire risk; extreme-heat days projected 7→26/yr by 2055 (HVAC capex compounding) — expect insurance premiums to compound above CPI over the hold.
Questions for the listing agent
- What do current leases actually rent for vs. the listed asking? Can we see a recent rent roll and the last 12 months of T-12 income?
- Built in 1976 — when were the roof, HVAC, electrical panel, plumbing, and water heater last replaced?
- Property tax is high relative to price — has the assessment been appealed recently, and will the sale trigger a re-assessment?
- Is there a deadline driving the sale (1031 exchange, divorce, estate, relocation)? That informs how much negotiation room exists.
- Schools are F-rated, which usually means shorter tenancies and higher turnover. Who's the typical renter profile here, and what's been the actual vacancy rate?
- Crime grade is D in this area — have there been break-ins, vandalism, or insurance claims at this property in the last 3 years? What carrier currently insures it and at what premium?
- The area grade is low — what's the realistic commute time and amenity access for the typical tenant pool here? Any planned neighborhood developments (good or bad) we should know about?
- What's the average days-on-market for RENTAL listings here right now (not sales)? A rising rental-DOM trend means longer vacancies and softer asking-rent achievability than the comps imply.
- What's the recent tenant-quality profile in this submarket — average credit score on applications, eviction rate, late-payment / NSF rate, and stable-employment percentage? A property-management company in the area should have these aggregated.
- How much new for-sale + rental construction is in the pipeline within 1–3 miles? Heavy new supply typically softens prices + rents 12–24 months out; constrained supply supports both.
Investment metrics
- 1% rule
- 0.78% ✗
- Cap rate
- 5.36%
- Cash-on-cash
- -3.33%
- DSCR
- 0.85
- GRM
- 10.7
CMA / ARV
- ARV (on-the-fly)
- $216,216
- Comps found
- 12
Show comp detail 12 sales within ~0.75 mi
| Address | Dist | Beds/Ba | Sqft | Sold | Price | $/sf | Match |
|---|---|---|---|---|---|---|---|
| 11807 Alpine Pkwy | 0.02mi | 2/2.0 | 1,128 (+3%) | 4mo | $120,000 | $106 | 90 |
| 7704 Christina Ln | 0.10mi | 2/2.0 | 1,128 (+3%) | 2mo | $260,000 | $230 | 88 |
| 11341 Winwood Pl | 0.62mi | 2/2.0 | 1,107 (+1%) | 1mo | $189,000 | $171 | 68 |
| 7513 Kensico Dr | 0.10mi | 2/1.0 | 936 (-14%) | 4mo | $188,750 | $202 | 64 |
| 11230 Rhonda Ave | 0.59mi | 2/2.0 | 1,046 (-4%) | 1mo | $130,000 | $124 | 64 |
| 8222 Leafy Ct | 0.62mi | 2/2.0 | 1,050 (-4%) | 3mo | $187,500 | $179 | 62 |
| 12410 Partridge Hill Row | 0.64mi | 2/2.0 | 1,050 (-4%) | 3mo | $235,000 | $224 | 62 |
| 7522 Topay Ln | 0.33mi | 3/1.5 (+1) | 1,201 (+10%) | 2mo | $215,000 | $179 | 59 |
| 11214 Kapok Ave | 0.60mi | 2/2.0 | 1,234 (+13%) | 4mo | $299,900 | $243 | 47 |
| 7604 Hawthorn Dr | 0.46mi | 3/2.0 (+1) | 1,254 (+15%) | 3mo | $325,000 | $259 | 47 |
| 11205 Yewtree Ave | 0.63mi | 2/1.0 | 952 (-13%) | 3mo | $165,000 | $173 | 43 |
| 7100 Ashwood Dr | 0.59mi | 3/1.0 (+1) | 960 (-12%) | 2mo | $189,900 | $198 | 41 |
Match score weights: distance 35% · size 25% · config 20% · recency 20%. Top-matched comps best support the ARV.
Projected returns pro-forma
-3.0% appreciation · 1.28% rent growth · sell at horizon
- IRR
- -23.8%
- Equity multiple
- 0.20×
- Total profit
- $-48,559
- Equity at exit
- $32,239
- IRR
- -24.3%
- Equity multiple
- -0.11×
- Total profit
- $-67,272
- Equity at exit
- $18,694
Cash invested: $60,540 (down + closing). Projections, not guarantees.
Landlord ↔ Tenant lean methodology
- Overall (STATE)
- 87 Strongly Landlord-Friendly
- State Florida
- 87 Strongly Landlord-Friendly · R+3
- County
- — inherits STATE
- City
- — inherits STATE
ZIP-level market 34668
- Home prices YoY
- -17.4%
- Rents YoY
- 1.3%
- Active inventory
- 577
- Price-to-rent
- 0.2×
Monthly cashflow live
- Estimated rent
- $1,679 high interval (Pro) →
- Mortgage (P&I)
- −$1,134
- Tax est. 1.5%
- −$270 /mo · $3,243/yr
- Insurance
- −$90
- HOA
- −$0
- Vacancy / Maint / Mgmt
- −$353
- Net cashflow
- $-168
Break-even live
UW: 25.0% down · 7.5% · 30yr · 1.5% tax · 5.0% vac · 8.0% maint · 8.0% mgmt
Financing live
Cash to close
- Down payment
- $54,054
- Closing costs
- $6,486
- Reserves months
- —
- Total cash needed
- —
Loan-product check · same deal, 3 products live
Conventional
25% down · 7.5% · 30yr
- Down + closing
- —
- Monthly P&I
- —
- Monthly cashflow
- —
- DSCR
- —
- Eligible?
- —
Personal DTI + credit; lowest rate.
DSCR
20% down · 8.5% · 30yr
- Down + closing
- —
- Monthly P&I
- —
- Monthly cashflow
- —
- DSCR
- —
- Eligible?
- —
No personal income docs; deal must DSCR.
Hard money
10% down · 12.0% · 12mo
- Down + closing
- —
- Monthly P&I
- —
- Monthly cashflow
- —
- DSCR
- —
- Eligible?
- —
Short-term bridge; refi at stabilization.
Rent comps 40 comps
| Address | Beds | Baths | Sqft | Rent | $/sqft | DOM | Units | Dist |
|---|---|---|---|---|---|---|---|---|
| 7539 Gulf Highlands Dr Port Richey, FL | 2.0 | 1.5 | 936 | $1,550 | $1.66 | 5d | 1 | 0.20mi |
| 12027 Hoosier Ct #203 Hudson, FL | 2.0 | 2.0 | 1103 | $1,550 | $1.41 | 24d | 1 | 0.25mi |
| 12041 Hoosier Ct #204 Hudson, FL | 2.0 | 2.0 | 1103 | $1,495 | $1.36 | 24d | 1 | 0.29mi |
| 12041 Hoosier Ct #204 Hudson, FL | 2.0 | 2.0 | 1103 | $1,495 | $1.36 | 17d | 1 | 0.29mi |
| 7608 Sue Ellen Dr Port Richey, FL | 3.0 | 2.0 | 1310 | $2,400 | $1.83 | 24d | 1 | 0.29mi |
| 7715 Sue Ellen Dr Port Richey, FL | 2.0 | 2.0 | 1080 | $1,495 | $1.38 | 3d | 1 | 0.29mi |
| 7924 Halsey Dr Port Richey, FL | 3.0 | 2.0 | 1272 | $1,800 | $1.42 | 5d | 1 | 0.35mi |
| 7924 Halsey Dr Port Richey, FL | 3.0 | 2.0 | 1272 | $1,800 | $1.42 | 21d | 1 | 0.35mi |
| 11610 Meadow Dr Port Richey, FL | 2.0 | 2.0 | 1128 | $1,570 | $1.39 | 12d | 1 | 0.35mi |
| 11611 Constance Dr Port Richey, FL | 3.0 | 1.0 | 984 | $1,540 | $1.57 | 24d | 1 | 0.37mi |
| 11611 Constance Dr Port Richey, FL | 3.0 | 1.0 | 984 | $1,540 | $1.57 | 11d | 1 | 0.37mi |
| 7530 Judith Cres Port Richey, FL | 2.0 | 2.0 | 1446 | $2,200 | $1.52 | 24d | 1 | 0.38mi |
| 7530 Judith Cres Port Richey, FL | 2.0 | 2.0 | 1446 | $1,695 | $1.17 | 20d | 1 | 0.38mi |
| 7804 Topay Ln Port Richey, FL | 3.0 | 2.0 | 1125 | $1,811 | $1.61 | 5d | 1 | 0.38mi |
| 11630 Paige Dr Port Richey, FL | 3.0 | 1.0 | 1152 | $1,680 | $1.46 | 12d | 1 | 0.40mi |
| 7520 Hawthorn Dr Unit NA Port Richey, FL | 2.0 | 2.0 | 1303 | $1,900 | $1.46 | 24d | 1 | 0.46mi |
| 7520 Hawthorn Dr Port Richey, FL | 2.0 | 2.0 | 1303 | $1,800 | $1.38 | 23d | 1 | 0.46mi |
| 7531 Greybirch Ter Port Richey, FL | 3.0 | 2.0 | 1400 | $2,000 | $1.43 | 24d | 1 | 0.48mi |
| 7616 Danube Dr Hudson, FL | 2.0 | 2.0 | 1125 | $1,350 | $1.20 | 24d | 1 | 0.53mi |
| 7602 Danube Dr Unit 7602 Hudson, FL | 2.0 | 2.0 | 1125 | $1,600 | $1.42 | 24d | 1 | 0.55mi |
| 12200 Hudson Ridge Dr Port Richey, FL | 2.0–3.0 | 2.0 | 1107 | $1,468 | $1.33 | 2d | 10 | 0.56mi |
| 11241 Yewtree Ave Port Richey, FL | 3.0 | 2.0 | 1306 | $1,950 | $1.49 | 23d | 1 | 0.56mi |
| 7540 Venice Dr Port Richey, FL | 3.0 | 2.0 | 1394 | $1,775 | $1.27 | 5d | 1 | 0.66mi |
| 7705 Ilex Dr Port Richey, FL | 3.0 | 2.0 | 1349 | $2,000 | $1.48 | 24d | 1 | 0.72mi |
| 8161 Braddock Cir #1 Port Richey, FL | 2.0 | 2.0 | 1000 | $1,595 | $1.59 | 17d | 1 | 0.73mi |
| 11138 Yellowwood Ln Unit NA Port Richey, FL | 3.0 | 1.0 | 1000 | $1,800 | $1.80 | 24d | 1 | 0.74mi |
| 7213 Seward Dr Port Richey, FL | 2.0 | 1.0 | 700 | $1,500 | $2.14 | 24d | 1 | 0.77mi |
| 11103 Harding Dr Unit 2 Port Richey, FL | 2.0 | 1.0 | 760 | $1,450 | $1.91 | 20d | 1 | 0.79mi |
| 7433 Greystone Dr #7433 Hudson, FL | 2.0 | 2.0 | 1029 | $1,300 | $1.26 | 17d | 1 | 0.81mi |
| 11031 Hassle Ave Port Richey, FL | 3.0 | 1.0 | 1006 | $1,595 | $1.59 | 24d | 1 | 0.90mi |
| 12702 Social Dr Hudson, FL | 2.0 | 1.0 | 1032 | $1,500 | $1.45 | 5d | 1 | 0.92mi |
| 10905 Kingsbridge Rd Port Richey, FL | 3.0 | 2.0 | 1176 | $1,566 | $1.33 | 5d | 1 | 0.93mi |
| 8304 Mill Creek Ln Hudson, FL | 2.0 | 2.0 | 1000 | $1,650 | $1.65 | 24d | 1 | 0.95mi |
| 11635 Salmon Dr Port Richey, FL | 2.0 | 1.5 | 816 | $1,500 | $1.84 | 24d | 1 | 0.97mi |
| 8312 Mill Creek Ln Hudson, FL | 2.0 | 2.0 | 1152 | $1,600 | $1.39 | 24d | 1 | 0.99mi |
| 6731 Sandra Dr Port Richey, FL | 2.0 | 1.0 | 816 | $1,575 | $1.93 | 24d | 1 | 0.99mi |
| 7202 Palisade Dr Port Richey, FL | 2.0 | 2.0 | 1310 | $1,100 | $0.84 | 23d | 1 | 1.02mi |
| 12809 College Hill Dr Hudson, FL | 3.0 | 2.0 | 1114 | $1,780 | $1.60 | 5d | 1 | 1.03mi |
| 11430 Rohrman Rd Port Richey, FL | 1.0 | 1.0 | 700 | $1,000 | $1.43 | 5d | 1 | 1.03mi |
| 10803 Hyssop St Port Richey, FL | 3.0 | 1.0 | 1120 | $1,500 | $1.34 | 10d | 1 | 1.04mi |
Listing history 2 events
-
2026-05-21$5,000 Active
-
2001-05-02soldstatus $71,000
ⓘ Source: listings_history table (triggers on properties + properties_extension) + one-shot
backfill from property_details.listing_events for pre-trigger history.
Climate risk First Street
- Flood 1/10 Low FEMA zone X (unshaded) · 0% chance over 30 yrs
- Wildfire 6/10 Major
- Heat 10/10 Extreme 7 d/yr ≥114°F today · 26 d/yr by 30 yrs out
- Wind 10/10 Extreme 99% chance of damaging wind over 30 yrs
- Air quality 2/10 Low 1 unhealthy d/yr today · 3 by 30 yrs out
Nearby sold comps map
Loading sold comps map…
Walkable amenities ~0.75 mi
Loading nearby amenities…
Taxation est. · year 1
- Rental income
- $20,147
- − Mortgage interest
- −$12,111
- − Property taxes
- −$3,243
- − Insurance
- −$1,081
- − Repairs & maintenance
- −$1,612
- − Management
- −$1,612
- − Depreciation
- −$6,290
- Taxable loss
- −$5,802
- Est. tax savings @ 24.0%
- +$1,392
- After-tax cash flow
- $-622/yr
For passive investors: Depreciation is non-cash, so a rental often shows a tax loss while cash-flowing — sheltering income. Rental losses are passive: they offset passive income freely, and up to $25,000/yr can offset ordinary (W-2) income if you actively participate and your MAGI is under $100k (phasing out to $0 by $150k); unused losses carry forward. On sale, claimed depreciation is recaptured at up to 25%, and gains may owe capital-gains tax (a 1031 exchange can defer both). Figures are a year-1 estimate at your 24.0% rate — not tax advice; consult a CPA.
Schools (NCES district)
- District
- Pasco
- NCES district ID
- 1201530
- Math proficiency
- 50% ▼ -10.00%
- Reading proficiency
- 52% ▼ -5.00%
- Median HH income
- $45,039
- Composite
- 43.14/100
- National rank
- #3074
- State rank
- #32 of 73 in FL
Livability — Bayonet Point
- Score
- 69/100
- State rank
- #485
- US rank
- #8934
Category grades
Schools grade is shown separately in the Schools card above.
Census & demographics
- Census place
- Bayonet Point, FL
- County
- Pasco County · 524,098 people
- Metro
- Tampa-St. Petersburg-Clearwater, FL
- Population (ZIP)
- 49,442
- Household income
- $47,401
- Rent vs Own
- Severe rent burden
- 2699.0
Population outlook (Pasco County) Hauer SSP2
- Today (2025)
- 570,045 people
- By 2030
- 605,844 · +6.3%
- By 2040
- 674,806 · +18.4%
- By 2050
- 736,022 · +29.1%
- By 2075
- 862,900 · +51.4%
- By 2100
- 906,364 · +59.0%
Race, ethnicity, and origin ACS 2023
- Neighborhood character
- Predominantly White (70%)
- Race & ethnicity
- White 70% Hispanic / Latino 23% Two or more races 14% Black 4%
- Hispanic origin (detail)
- Mexican 3% Puerto Rican 10% Cuban 5% Dominican 1%
- Common ancestry
- Romanian 3% Lithuanian 3% Slovak 2%
- Foreign-born
- 11% · Canada, Jamaica
- Languages at home
- 82% English-only · Spanish 14% Other Indo-European 1% French/Haitian/Cajun 1%
Political lean MEDSL · Pasco
- 2024 margin
- Strong R (+25.2) · D 36.9% · R 62.1% · Other 1.0%
- 2008→2024 swing
- -21.6pp toward R · 2008: -3.6pp · 2024: -25.2pp
- All cycles
- 2024: R+25.2 2020: R+20.1 2016: R+21.6 2012: R+6.7 2008: R+3.6
Not yet ingested
- Civics
- —
Market trends
- HPI YoY
- ▼ -75.64%
- Current HPI
- 359.7163
- Rent YoY
- ▲ 1.28%
- Metro
- Tampa-St. Petersburg-Clearwater, FL
- State GDP YoY
- ▲ 3.28%
- F500 in state
- 36
Industry mix (Fortune 500 HQ in FL)
| Industry | F500 HQs | Revenue |
|---|---|---|
| Industrial Technology | 2 | $29B |
|
||
| Insurance | 2 | $17B |
|
||
| Retail | 1 | $60B |
|
||
| Technology Distribution | 1 | $58B |
|
||
| Homebuilding | 1 | $35B |
|
||
| Technology Manufacturing | 1 | $35B |
|
||
Price history
-93.0% since first listed2 events — show timeline
- 2026-05-21 Listed $5,000 HAOR as distributed by MLS GRID
- 2001-05-02 Sold (Public Records) $71,000 Public Records
Property tax history
+18.3%/yrLatest (2025): $3,257 · +486.0% YoY. Source: county tax records.
Cash-flow waterfall
monthlySold comps — $/sqft
last 12 mo · ≤1 miLoading sold comps…