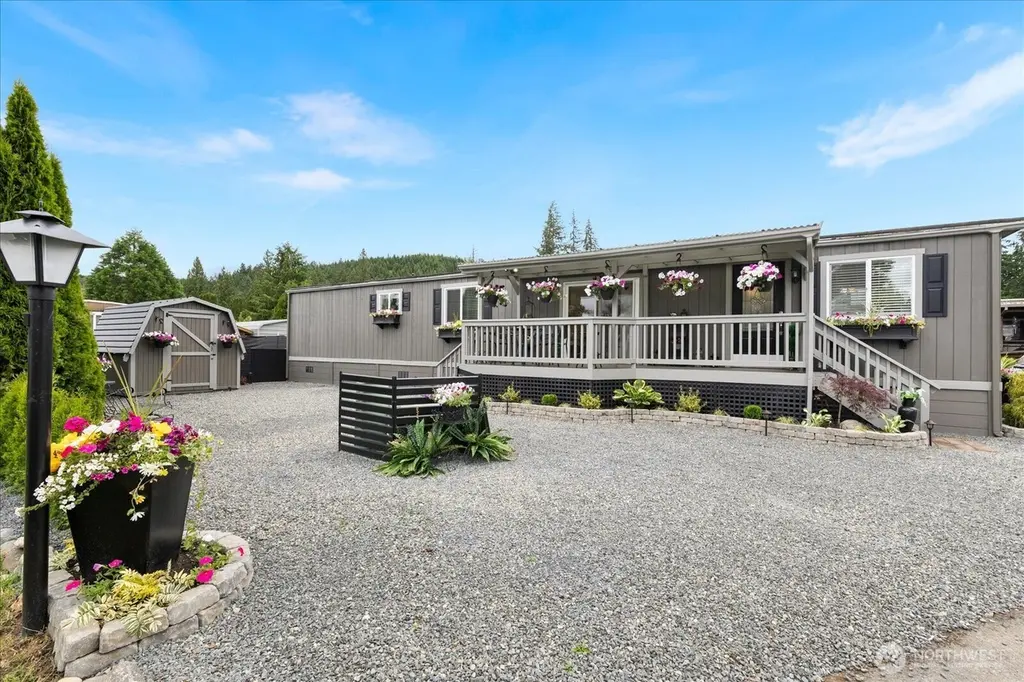
32501 NE 50th St #17 · Carnation, WA
Flood risk 3/10 · Minor
- FEMA flood zone
- X (shaded)
- Chance of flooding over 30 yrs
- 0.2%
- Est. flood insurance / yr
- $507 – $1,088
Fire risk 1/10 · Minimal
- Est. fire insurance / yr
- $604 – $1,122
Heat risk 3/10 · Minor
- Hot days now (above 88°F)
- 7 days/yr
- Hot days in 30 yrs
- 16 days/yr
Wind risk 1/10 · Minimal
- Chance of severe wind over 30 yrs
- —
Air-quality risk 7/10 · Major
- Unhealthy air days now
- 10 days/yr
- Unhealthy air days in 30 yrs
- 13 days/yr
Risk factors via First Street. Map © Google.
Why this score? — see what drove the C- grade
The composite is a weighted blend of 9 inputs, each scored 0–100. Each bar is that input's sub-score; the figure is the points it added to the 100-point composite (weight × sub-score).
- Cash flow +19.2/30.0
- ARV discount +7.5/15.0
- Schools +6.3/10.0
- DSCR +6.1/10.0
- 1% rule +5.1/10.0
- Condition / age +4.8/5.0
- Livability +3.2/5.0
- Rent growth +2.5/5.0
- Appreciation +0.0/10.0
$229,000
🖨 Deal sheet 📄 Offer letter ✓ Due diligence
Listing remarks
Great opportunity to be part of the Coveted Carnation Community. This professionally designed brand new updated 2-bedroom home has been completely remodeled with NEW EVERYTHING! Owner spared no expense on quality finishes throughout starting in the Gourmet kitchen with all new beautiful cabinets accented with crown molding, quartz counters, designer backsplash, top quality Samsung Stainless Steel Appliance Package with convenient eating bar. Custom lighting throughout the entire home is wonderful. New interior paint, flooring, windows and drywall throughout the entire home with tasteful window trim & baseboards. The convenient open floor plan is accented with sliding glass door
Key facts
- Quartz counters
- Gourmet kitchen
- Custom lighting
Tags
Property features AI
Finance
- Financial info: Listing terms: Cash or Conventional
- HOA & community: Park name: Carnation Mobile Haven; Park approved for sale; Approximately 42 homes in the park; Land lease: $975/month
Exterior
- Parking: 2 uncovered open parking spaces
- Utilities: Electric power; Public water; Public sewer; Cable (Comcast); Internet (CenturyLink)
- Home design: Manufactured single-wide home; Updated/remodeled; One story; Made by Kent, model 64/14; Metal skirting
- Construction: Wood construction
- Exterior features: Wood exterior products; Patio/porch/deck; Landscaped
Interior
- Kitchen: Dishwasher; Microwave; Refrigerator; Stove/Range
- Bedrooms: 2 bedrooms
- Flooring: Laminate; Carpet
- Bathrooms: 1 full bathroom with tub and separate shower
- Heating & cooling: Forced air heating
- Interior features: Water heater; Entry; Kitchen with eating space; Living room; Double pane windows
- Laundry & utility: Washer; Dryer; Water heater located in back bedroom
Neighborhood map
What this means for you Summary
Snapshot
- This is a 2-bed/1.0-bath manufactured listed at $229k. Condition is rated excellent.
Deal economics
- At list price, monthly cash flow is $248 ($3k/yr) — positive.
- The deal already cash-flows at list — no discount required.
- Meets the 1% rule at list price ($2k rent vs $229k).
- Cap rate 7.6% vs local median 0.9% in Carnation — top-decile yield for the area; either an underpriced asset or a hidden risk that comps aren't pricing in. Stress-test before assuming the spread holds.
Location & tenants
- Location reads 65/100 on livability (#342 in WA) — a middle-class / working-renter tenant base. Strengths: crime A+, employment A+, housing A+; Watch: amenities F, commute F, cost of living F.
- Riverview School District (suburban): math 63% / reading 72% proficiency, ranked #15 of 291 in WA (top 5%) — acceptable for families but not a draw, mixed tenant base, ~2y average lease; only 14% free/reduced lunch — higher-income household profile.
- Zoned schools: Cedarcrest High School (943 students, 14% FRL) — zoned schools at 14% FRL track the district average.
- Market conditions: 125 active listings in the ZIP; 2 comparable units currently listed for rent nearby; 10,555 units permitted in King County in 2024 (7,119 in 5+ unit buildings).
Forward outlook
- Local home prices are declining (-3.0%/yr); year-one equity from $2k of loan paydown is wiped out by about $7k of value loss. Plan a longer hold.
- King County population projected at +44% by 2050 — long-run rental-demand tailwind backs the buy-and-hold thesis.
Negotiation context
- Only 5 days on market — expect competitive offers; lowballing is unlikely to land.
Questions for the listing agent
- Built in 1975 — when were the roof, HVAC, electrical panel, plumbing, and water heater last replaced?
- Is there a deadline driving the sale (1031 exchange, divorce, estate, relocation)? That informs how much negotiation room exists.
- Schools are B-rated — typically a magnet for longer-tenancy family renters. What's the average tenant stay here, and is there a school-zone premium baked into asking?
- What's the average days-on-market for RENTAL listings here right now (not sales)? A rising rental-DOM trend means longer vacancies and softer asking-rent achievability than the comps imply.
- What's the recent tenant-quality profile in this submarket — average credit score on applications, eviction rate, late-payment / NSF rate, and stable-employment percentage? A property-management company in the area should have these aggregated.
- How much new for-sale + rental construction is in the pipeline within 1–3 miles? Heavy new supply typically softens prices + rents 12–24 months out; constrained supply supports both.
Investment metrics
- 1% rule
- 1.01% ✓
- Cap rate
- 7.59%
- Cash-on-cash
- 4.64%
- DSCR
- 1.21
- GRM
- 8.2
CMA / ARV
- ARV (on-the-fly)
- $134,850
- Comps found
- 2
Show comp detail 2 sales within ~0.75 mi
| Address | Dist | Beds/Ba | Sqft | Sold | Price | $/sf | Match |
|---|---|---|---|---|---|---|---|
| 32501 NE 50th St #37 | 0.10mi | 2/1.0 | 720 (-7%) | 0mo | $125,000 | $174 | 83 |
| 32501 NE 50th St #38 | 0.05mi | 2/1.0 | 768 (-1%) | 18mo | $109,500 | $143 | 81 |
Match score weights: distance 35% · size 25% · config 20% · recency 20%. Top-matched comps best support the ARV.
Projected returns pro-forma
-3.0% appreciation · 3.0% rent growth · sell at horizon
- IRR
- -9.1%
- Equity multiple
- 0.67×
- Total profit
- $-21,288
- Equity at exit
- $34,145
- IRR
- 0.4%
- Equity multiple
- 1.03×
- Total profit
- $1,931
- Equity at exit
- $19,800
Cash invested: $64,120 (down + closing). Projections, not guarantees.
Landlord ↔ Tenant lean methodology
- Overall (STATE)
- 28 Tenant-Leaning
- State Washington
- 28 Tenant-Leaning · D+8
- County
- — inherits STATE
- City
- — inherits STATE
ZIP-level market 98014
- Active inventory
- 125
- Price-to-rent
- 8.2×
Monthly cashflow live
- Estimated rent
- $2,317 medium interval (Pro) →
- Mortgage (P&I)
- −$1,201
- Tax est. 1.5%
- −$286 /mo · $3,435/yr
- Insurance
- −$95
- HOA
- −$0
- Vacancy / Maint / Mgmt
- −$487
- Net cashflow
- $248
Break-even live
UW: 25.0% down · 7.5% · 30yr · 1.5% tax · 5.0% vac · 8.0% maint · 8.0% mgmt
Financing live
Cash to close
- Down payment
- $57,250
- Closing costs
- $6,870
- Reserves months
- —
- Total cash needed
- —
Loan-product check · same deal, 3 products live
Conventional
25% down · 7.5% · 30yr
- Down + closing
- —
- Monthly P&I
- —
- Monthly cashflow
- —
- DSCR
- —
- Eligible?
- —
Personal DTI + credit; lowest rate.
DSCR
20% down · 8.5% · 30yr
- Down + closing
- —
- Monthly P&I
- —
- Monthly cashflow
- —
- DSCR
- —
- Eligible?
- —
No personal income docs; deal must DSCR.
Hard money
10% down · 12.0% · 12mo
- Down + closing
- —
- Monthly P&I
- —
- Monthly cashflow
- —
- DSCR
- —
- Eligible?
- —
Short-term bridge; refi at stabilization.
Rent comps 2 comps
| Address | Beds | Baths | Sqft | Rent | $/sqft | DOM | Units | Dist |
|---|---|---|---|---|---|---|---|---|
| 31721 W Commercial St Unit A Carnation, WA | 2.0 | 1.0 | 700 | $2,200 | $3.14 | 24d | 1 | 0.43mi |
| 31210 NE 40th St Carnation, WA | 2.0 | 2.0 | 1064 | $2,550 | $2.40 | 3d | 1 | 0.69mi |
Listing history 6 events
-
2026-06-18days on market $229,000 Active 5 DOM
-
2026-06-17days on market $229,000 Active 4 DOM
-
2026-06-16days on market $229,000 Active 3 DOM
-
2026-06-15days on market $229,000 Active 2 DOM
-
2026-06-13remarks 690-char remark
-
2026-06-13$229,000 Active 1 DOM
ⓘ Source: listings_history table (triggers on properties + properties_extension) + one-shot
backfill from property_details.listing_events for pre-trigger history.
Climate risk First Street
- Flood 3/10 Moderate FEMA zone X (shaded) · 20% chance over 30 yrs
- Wildfire 1/10 Low
- Heat 3/10 Moderate 7 d/yr ≥88°F today · 16 d/yr by 30 yrs out
- Wind 1/10 Low
- Air quality 7/10 Severe 10 unhealthy d/yr today · 13 by 30 yrs out
Nearby sold comps map
Loading sold comps map…
Walkable amenities ~0.75 mi
Loading nearby amenities…
Taxation est. · year 1
- Rental income
- $27,804
- − Mortgage interest
- −$12,828
- − Property taxes
- −$3,435
- − Insurance
- −$1,145
- − Repairs & maintenance
- −$2,224
- − Management
- −$2,224
- − Depreciation
- −$6,662
- Taxable loss
- −$714
- Est. tax savings @ 24.0%
- +$171
- After-tax cash flow
- $3,146/yr
For passive investors: Depreciation is non-cash, so a rental often shows a tax loss while cash-flowing — sheltering income. Rental losses are passive: they offset passive income freely, and up to $25,000/yr can offset ordinary (W-2) income if you actively participate and your MAGI is under $100k (phasing out to $0 by $150k); unused losses carry forward. On sale, claimed depreciation is recaptured at up to 25%, and gains may owe capital-gains tax (a 1031 exchange can defer both). Figures are a year-1 estimate at your 24.0% rate — not tax advice; consult a CPA.
Condition & rehab AI · 13 photos
This home is in excellent condition with no visible repairs or maintenance needed. It is move-in ready and has a great location in the Coveted Carnation Community.
Value-add opportunities
- Resale Painting the exterior siding — Painting the exterior siding can enhance the curb appeal and increase the home's resale value.
- Rental Landscaping improvements — Improving the landscaping can make the home more attractive to potential renters and increase its rental value.
Renovation cost estimate screening
Value-add ROI direction
- Resale Painting the exterior siding — Painting the exterior siding can enhance the curb appeal and increase the home's resale value. ↑
- Rental Landscaping improvements — Improving the landscaping can make the home more attractive to potential renters and increase its rental value. ↑
ⓘ Cost ranges are severity-bucket heuristics (US national rule-of-thumb). Get contractor quotes + a written scope before underwriting a rehab budget.
Schools (NCES district)
- District
- Riverview School District
- NCES district ID
- 5304560
- Math proficiency
- 63% ▲ 5.00%
- Reading proficiency
- 72% ▼ -1.00%
- Median HH income
- $100,574
- Composite
- 63.41/100
- National rank
- #1279
- State rank
- #15 of 291 in WA
Livability — Carnation
- Score
- 65/100
- State rank
- #342
- US rank
- #12959
Category grades
Schools grade is shown separately in the Schools card above.
Census & demographics
- Census place
- Carnation, WA
- Population (ZIP)
- 7,681
Population outlook (King County) Hauer SSP2
- Today (2025)
- 2,576,485 people
- By 2030
- 2,803,316 · +8.8%
- By 2040
- 3,255,921 · +26.4%
- By 2050
- 3,706,444 · +43.9%
- By 2075
- 4,746,063 · +84.2%
- By 2100
- 5,407,730 · +109.9%
Race, ethnicity, and origin ACS 2023
- Neighborhood character
- Predominantly White (83%)
- Race & ethnicity
- White 83% Hispanic / Latino 9% Two or more races 8% Asian 5%
- Hispanic origin (detail)
- Mexican 7%
- Common ancestry
- Italian 6% Portuguese 4% Slovak 4%
- Foreign-born
- 8% · Canada, China
- Languages at home
- 90% English-only · Spanish 5% Chinese 2% Other Indo-European 1%
Political lean MEDSL · King
- 2024 margin
- Solid D (+51.7) · D 74.2% · R 22.5% · Other 3.4%
- 2008→2024 swing
- +9.6pp toward D · 2008: 42.1pp · 2024: 51.7pp
- All cycles
- 2024: D+51.7 2020: D+52.7 2016: D+50.4 2012: D+39.9 2008: D+42.1
Not yet ingested
- Civics
- —
Market trends
- HPI YoY
- ▼ -453.46%
- Current HPI
- 326.6646
- Rent YoY
- —
- Metro
- —
- State GDP YoY
- ▲ 4.65%
- F500 in state
- 22
Industry mix (Fortune 500 HQ in WA)
| Industry | F500 HQs | Revenue |
|---|---|---|
| Retail | 2 | $269B |
|
||
| Technology / Retail | 1 | $638B |
|
||
| Technology | 1 | $245B |
|
||
| Telecommunications | 1 | $38B |
|
||
| Food / Beverage | 1 | $36B |
|
||
| Automotive / Trucks | 1 | $34B |
|
||
Price history
1 event — show timeline
- 2026-06-05 Listed $229,000 NWMLS as Distributed by MLS Grid
Cash-flow waterfall
monthlySold comps — $/sqft
last 12 mo · ≤1 miLoading sold comps…